Rep:Mod:dd1991
Inorganic, Module 2, Daniel Davies
Introduction
The aim of this project is to introduce the beneficial uses computational chemistry in understand key properties of molecules. First introducing Gaussview in the construction of molecules, to their energy and structural parameters and properties, such as vibrational modes, being solved with Gaussian. After conducting analysis of simple four atom molecules the project will move to looking more complicated molecules, containing 6 membered aromatic rings. It is hopen that the computational analysis will be able to evaluate the aromaticity of these different aromatic rings.
Optimization of a Molecule
Optimization of a molecular structure using Gaussian entails the Schrodinger equation for the molecule being solved. As the Born-Oppenheimer approximation states, the electrons positions can be considered to be independent to the nuclei due to the vast size differences between the two. A solution is found for a certain position of the the nuclei and then this is repeated for different rearrangements of the structure. After a number of iterations a point where the gradient of the potential energy surface does not change is found. This relates to a minimum point on the surface, although in some cases this could also be a maximum which can be considered to be a transition state. It will be seen later in the frequency analysis how these two points, where the gradient is 0, can be differentiated.
The BH3 Molecule
Using GaussView 5.0 a model of BH3 was constructed. Each B-H bond length was set to 1.5 A before running an optimization calculation on the molecule. The initial optimization was performed using a 3-21G basis set, Density Functional Theory with B3LYP calculation method. The details of the results obtained are given as follows:
| Gaussian Calculation Information | ||
|---|---|---|
 | ||
| File Type | .log | |
| Calculation type | Optimization | |
| Calculation Method | B3LYP | |
| Basis Set | 3-21G | |
| Final Energy | -26.4622634 au | |
| Gradient | ||
| Dipole Moment | 0D | |
| Point Group | D3h | |
| Calculation Running Time | 12.0 seconds | |
| Log File | File:Dd510 BH3 OPT 321g.LOG | |
In order to confirm the optimization occurred successfully force and distance parameters of BH3 must of converged. This is checked by looking at the output .log file. Here is shown the table taken from the .log file.
         Item               Value     Threshold  Converged?
 Maximum Force            0.000413     0.000450     YES
 RMS     Force            0.000271     0.000300     YES
 Maximum Displacement     0.001610     0.001800     YES
 RMS     Displacement     0.001054     0.001200     YES
 Predicted change in Energy=-1.071764D-06
 Optimization completed.
    -- Stationary point found.
From this optimization, a B-H bond length of .119 nm and H-B-H bond angle of 120 degrees was seen. These values concur with ones presented in the literature.[1]
A Better Basis Set
In order to get a more accurate prediction of the BH3 molecule another optimization was performed. A higher basis set, 6-31G, was used which takes into account the energies of the d and p orbitals. As before the results from this optimization are given:
| Gaussian Calculation Information | ||
|---|---|---|
 | ||
| File Type | .log | |
| Calculation type | Optimization | |
| Calculation Method | B3LYP | |
| Basis Set | 6-31G | |
| Final Energy | -26.6153236 au | |
| Gradient | 0.00000235 | |
| Dipole Moment | 0D | |
| Point Group | D3h | |
| Calculation Running Time | 9.0 seconds | |
| Log File | File:DD510BH3 OPT 631G DP.LOG | |
Item               Value     Threshold  Converged?
 Maximum Force            0.000005     0.000450     YES
 RMS     Force            0.000003     0.000300     YES
 Maximum Displacement     0.000019     0.001800     YES
 RMS     Displacement     0.000012     0.001200     YES
 Predicted change in Energy=-1.304899D-10
 Optimization completed.
    -- Stationary point found.
Energy Comparison
1 au can be equated to 2625.50 kJ/mol.[2]
| Basis Set | Energy (au) | Energy (kJ/mol) |
| 3-21G | -26.4622634 | -69476.67256 |
| 6-31G | -26.6153236 | -69878.53211 |
The two optimizations have an very large energy difference of 401.86 kJ/mol. This shows how very dependent the outcome of a calculation is on the basis set used. For this reason when comparing different molecules it is necessary to use the same basis sets when optimizing them.
Pseudo-potentials and Larger Basis Sets
The following calculations were conducted using the High performance computer (HPC).
TlBr3
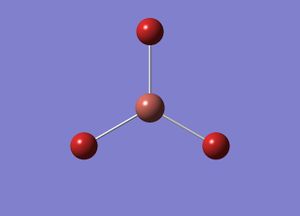
In the same way as with BH3 a trigonal planar structure for TlBr3 was constructed using Gaussview. Unlike before though the point group was pre assigned to be D3h with a "very tight tolerance" of 0.0001 and the basis set used for optimization was LANL2DZ. The results of this of this optimization are given:
| Gaussian Calculation Information | ||
|---|---|---|
 | ||
| File Type | .log | |
| Calculation type | Optimisation | |
| Calculation Method | B3LYP | |
| Basis Set | LanL2DZ | |
| Final Energy | -91.2181285 au | |
| Gradient | .00000090 au | |
| Dipole Moment | 0D | |
| Point Group | D3h | |
| Calculation Running Time | 12.0 seconds | |
| Results, D-space | TlBr3 results | |
  Item               Value     Threshold  Converged?
 Maximum Force            0.000002     0.000450     YES
 RMS     Force            0.000001     0.000300     YES
 Maximum Displacement     0.000022     0.001800     YES
 RMS     Displacement     0.000014     0.001200     YES
 Predicted change in Energy=-6.084077D-11
 Optimization completed.
    -- Stationary point found.
      -------
From this optimization the Tl-Br bond length was given as .265 nm and Br-Tl-Br angle as 120 degrees. While the angle predicted agrees perfectly with the literature, the bond length varies slightly with the literature value of .256 nm. [3]
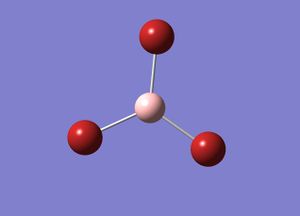
BBr3
| Gaussian Calculation Information | ||
|---|---|---|
 | ||
| File Type | .log | |
| Calculation type | Optimization | |
| Calculation Method | B3LYP | |
| Basis Set | Gen | |
| Final Energy | -64.4364530 au | |
| Gradient | ||
| Dipole Moment | 0.00000382D | |
| Point Group | D3h | |
| Calculation Running Time | 16.2 seconds | |
| Results, D-space | BBr3 results | |
 Item               Value     Threshold  Converged?
 Maximum Force            0.000008     0.000450     YES
 RMS     Force            0.000005     0.000300     YES
 Maximum Displacement     0.000036     0.001800     YES
 RMS     Displacement     0.000023     0.001200     YES
 Predicted change in Energy=-4.027544D-10
 Optimization completed.
    -- Stationary point found.
From this optimisation a B-Br bond length of .193 nm and Br-B-Br angle of 120 degrees. A literature value for the bond length was found to be 0.184nm.[4]
Comparing the BH3, TlBr3 and BBr3 Bond Distances
| Molecule | Bond Distance (nm) |
|---|---|
| BH3 | 0.119 |
| BBr3 | 0.193 |
| TlBr3 | 0.265 |
It can be seen from these results that altering the ligand attached to a central atom can have significant effect on the bond distance. The B-Br distance is predicted to be 62% longer than the B-H distance. What is different between these two ligands is the size of the orbitals which are involved the bonding. For bromine the orbital which overlaps with the boron 1sp2 orbital is a 4p orbital, for hydrogen it is a 1s orbital. As the 4p is more diffuse and is greater mismatched in size to the boron orbital, the overlap is poorer than in comparison to hydrogen. This leads to weaker bonds and in turn a longer bond distance. A similarity that does exist between hydrogen and boron is that both have an unpaired electron in their valence shells.
Looking at the central atoms effect on the bond distance it can be seen from looking at the TlBr3 and BBr3 that heavier central atoms causes longer bonds. Both boron and thallium are in group III in the periodic table but it can be seen that their bond distances to bromine differ significantly. As mentioned previously with the ligands, the thallium outer orbital is a 6p orbital which is larger and more diffuse than the boron's outer 2p orbital.
Defining a Bond
In Gaussview there are some incidents where bonds are not depicted between atoms. This does not mean a bond does not exist there but due to Gaussview's conditions on illustrating bonds. A chemical bond can be seen as an attraction between two atoms. This could be coulombic attractions between ions, forming ionic bonds or the overlap of electronic orbitals which causes a build up of electronic density between atomic nuclei, covalent bonds.
Frequency Analysis
To ensure that the stationary points seen in the previous optimizations were in fact minima and not maxima frequency analysis must be run. During this process the second derivative of the potential energy is found. If these values are positive this corresponds to a minimum point. Frequency analysis also generates the vibrational modes for the molecule.
BH3 Analysis
The previously optimized BH3 using a 6-31G9(dp) basis set was used for the frequency analysis with the job type being changed from "Optimization" to "Frequency".
| Gaussian Calculation Information | ||
|---|---|---|
 | ||
| File Type | .log | |
| Calculation type | FREQ | |
| Calculation Method | B3LYP | |
| Basis Set | 6-31G | |
| Final Energy | -26.61532363 au | |
| Gradient | 0.00000235 | |
| Dipole Moment | 0D | |
| Point Group | D3h | |
| Calculation Running Time | 8.0 seconds | |
| Log File | File:DD510BH3 FREQ TIGHT.LOG | |
  Item               Value     Threshold  Converged?
 Maximum Force            0.000005     0.000450     YES
 RMS     Force            0.000002     0.000300     YES
 Maximum Displacement     0.000019     0.001800     YES
 RMS     Displacement     0.000009     0.001200     YES
 Predicted change in Energy=-1.324717D-10
 Optimization completed.
    -- Stationary point found.
The same method and basis set must be used for both the optimization and frequency analysis due to the energy results being very much dependent on the basis set. In viewing the output .log file of this calculation a series of "low frequency values" are seen, which are as shown:
 Low frequencies ---   -0.9033   -0.7343   -0.0054    6.7375   12.2491   12.2824
 Low frequencies --- 1163.0003 1213.1853 1213.1880
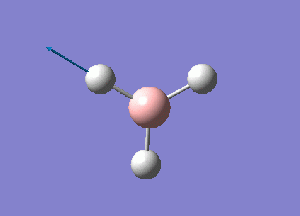
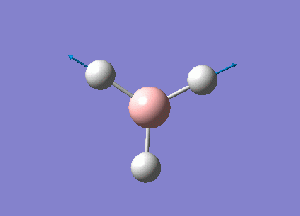
The first row of values should be ideally as near to zero as possible. These 6 values are due to movements of the center of mass of the molecule, from the 3N+6 degrees of freedom. As can be seen these significantly smaller than the lowest energy vibrational mode. The second row of numerical values have to be positive to confirm the stationary point is a minimum point.
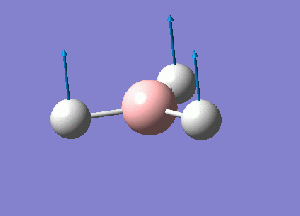
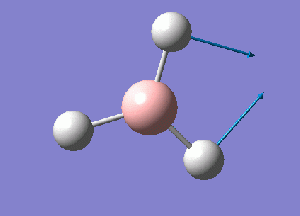
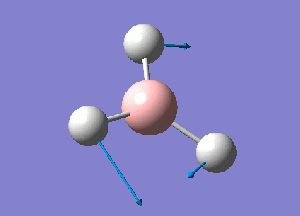
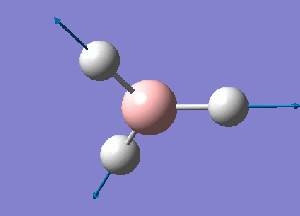
The normal modes of vibration predicted by the frequency analysis are presented in the following table:
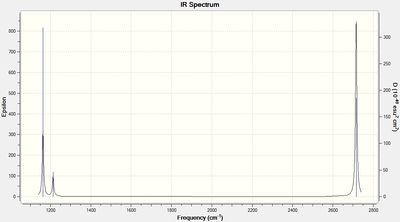
The outcome of the frequency analysis shows 6 vibrational modes which is what is expected from a molecule with 4 atoms, 3N-6 vibrational modes. Yet looking at the predicted IR spectrum, only 3 peaks are seen. Firstly for a vibrational mode to be IR active there must be an overall change in the dipole moment of the species to allow an interaction with an electromagnetic field. For the case of the mode at 2582.26 wave numbers, the vibration is IR inactive. Therefore there are 5 remaining vibrational modes that are IR active. It is seen that there are two sets of two degenerate modes of E' symmetry at both 2715 and 1213 wave numbers.
TlBr3 Analysis
Frequency analysis was performed on the previously optimized TlBr3 molecule.
| Gaussian Calculation Information | ||
|---|---|---|
 | ||
| File Type | .log | |
| Calculation type | FREQ | |
| Calculation Method | B3LYP | |
| Basis Set | LanL2DZ | |
| Final Energy | -91.2181285 au | |
| Gradient | .00000090 au | |
| Dipole Moment | 0D | |
| Point Group | D3h | |
| Calculation Running Time | 18.2 seconds | |
| Results, D-space | TlBr3 Freq results | |
 Item               Value     Threshold  Converged?
 Maximum Force            0.000002     0.000450     YES
 RMS     Force            0.000001     0.000300     YES
 Maximum Displacement     0.000022     0.001800     YES
 RMS     Displacement     0.000011     0.001200     YES
 Predicted change in Energy=-5.660840D-11
 Optimization completed.
    -- Stationary point found.
As with the BH3 frequency analysis, the output file was checked to see the values for the low frequencies, shown below.
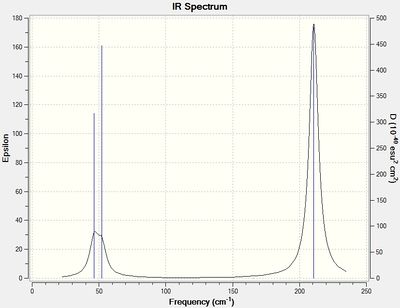
Low frequencies ---   -3.4213   -0.0026   -0.0004    0.0015    3.9362    3.9362
 Low frequencies ---   46.4289   46.4292   52.1449
The normal modes of vibration predicted for TlBr3 are presented in following table:
A Comparison
The following table sumarizes the vibrational modes and their symmetry labels for TlBr3 and BH3.
| TlBr3 frequency (symmetry label) | BH3 frequency (symmetry label) |
|---|---|
| 46 (E') | 1163 (A2 ") |
| 46 (E') | 1213 (E') |
| 52 (A2 ") | 1213 (E') |
| 165 (A1 ') | 2582 (A1 ') |
| 211(E') | 2715 (E') |
| 211(E') | 2715 (E') |
What is noticeable from the values presented is the much greater values seen for BH3. The frequency at which a vibration occurs relates directly to the strength of the bonds vibrating. Relating back the the previous optimizations of these molecules, the bond length of Tl-Br is longer in comparison to the B-H bond. This is due to the bonding orbitals of Tl and Br being more diffused than B and H therefore overlapping poorly. This results in longer, weaker bonds.
The vibrational frequency can also be approximated using hooke's law, :, where is the reduced mass. Here we can see that the frequency is directly proportional to one over the square root of the mass of the molecule. The results obtained from previous analysis follows the trend set out by this formula. An increase in the reduced mass of the molecule leads to a decrease in the vibrational frequency.
The three lowest energy vibrations in both cases are bending vibrations and the higher three are stretching vibrations. Though the order of modes differs in the bending motions with TlBr3 ordered as E', E', A2 " and BH3 as A2 ", E', E'.
The spectra for both species are very similar, with only three peaks being observed. This is no surprise as both molecules have a D3h point group.
Natural Bond Order Analysis
Analysis of BH3
Population analysis was conducted on the previously optimized BH3 structure. This involved changing the job type from "optimization" to "energy", using DFT B3LYP job type with a 6-31G (d,p) basis set.
| Gaussian Calculation Information | ||
|---|---|---|
 | ||
| File Type | .log | |
| Calculation type | Sp | |
| Calculation Method | B3LYP | |
| Basis Set | 6-31G | |
| Final Energy | -26.61532363 au | |
| Gradient | 0.00000235 | |
| Dipole Moment | 0D | |
| Point Group | D3h | |
| Calculation Running Time | 3.0 seconds | |
| Log File | File:BH3 OPT pop.LOG | |
(unable to publish results on D-space)
This makes it possible for the MOs of the molecule to be computed and visualized, As seen below.
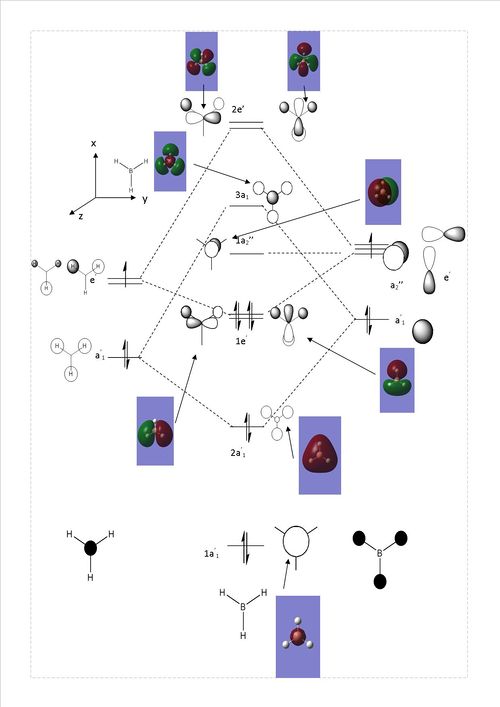
Comparing the qualitative MO diagram with the computed orbitals at first sight seems in much agreement. This shows how LCAO is powerful method when looking at orbital interactions of simple molecules.
NH3 analysis
NH3 Optimisation
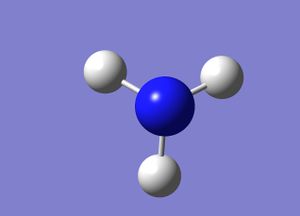
A structure of NH3 was generated using Gaussview. Due to ammonia being a small molecule it was possible to perform an optimization with an initial higher basis set. Details of the optimization are given as follows:
| Gaussian Calculation Information | ||
|---|---|---|
 | ||
| File Type | .log | |
| Calculation type | Optimization | |
| Calculation Method | B3LYP | |
| Basis Set | 6-31G(d,p) | |
| Final Energy | -56.5577686 au | |
| Gradient | 0.00000885 au | |
| Dipole Moment | 1.8464 | |
| Point Group | C1 | |
| Calculation Running Time | 19.0 seconds | |
| Log File | File:DD510 NH3 OPT 631G DP.LOG | |
NH3 Frequency Analysis
Frequency analysis of NH3 was conducted on the previously optimized molecule.
| Gaussian Calculation Information | ||
|---|---|---|
 | ||
| File Type | .log | |
| Calculation type | FREQ | |
| Calculation Method | B3LYP | |
| Basis Set | 6-31G(d,p) | |
| Final Energy | -56.5577686 au | |
| Gradient | 0.00000885 au | |
| Dipole Moment | 1.8464 | |
| Point Group | C1 | |
| Calculation Running Time | 12.0 seconds | |
| Log File | File:DD510 NH3 FREQ 631G DP.LOG | |
 Low frequencies ---  -30.6072    0.0008    0.0010    0.0018   19.7564   28.4092
 Low frequencies --- 1089.5533 1694.1330 1694.1769
It can be confirmed that the stationary point is a minimum point.
Population Analaysis
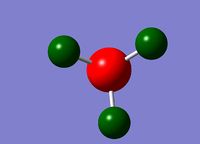
Population analysis was carried out on the previously optimized structure.
| Gaussian Calculation Information | ||
|---|---|---|
 | ||
| File Type | .log | |
| Calculation type | SP | |
| Calculation Method | B3LYP | |
| Basis Set | 6-31G(d,p) | |
| Final Energy | -56.5577686 au | |
| Gradient | 0.00000885 au | |
| Dipole Moment | 1.8464 | |
| Point Group | C1 | |
| Calculation Running Time | 4.0 seconds | |
| Log File | File:DD510 NH3 NBO 631G DP.LOG | |


Association Energies of NH3BH3
NH3BH3 Optimisation
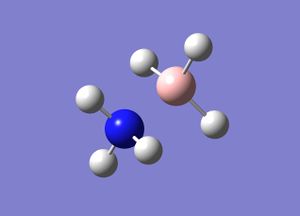
With NH3BH3 being more complex than the independent borane and ammonia it is necessary to perform an initial optimization with a lower basis set, 3-21G. The details of this optimization are given as follows:
| Gaussian Calculation Information | ||
|---|---|---|
 | ||
| File Type | .log | |
| Calculation type | Optimization | |
| Calculation Method | B3LYP | |
| Basis Set | 3-21G | |
| Final Energy | -82.76661684 au | |
| Gradient | 0.00007138 au | |
| Dipole Moment | 5.7542 D | |
| Point Group | C3 | |
| Calculation Running Time | 23 seconds | |
| Log File | File:DD510 NH3BH3 OPT 321G.LOG | |
 Item               Value     Threshold  Converged?
 Maximum Force            0.000188     0.000450     YES
 RMS     Force            0.000039     0.000300     YES
 Maximum Displacement     0.000882     0.001800     YES
 RMS     Displacement     0.000314     0.001200     YES
 Predicted change in Energy=-1.372639D-07
 Optimization completed.
    -- Stationary point found.
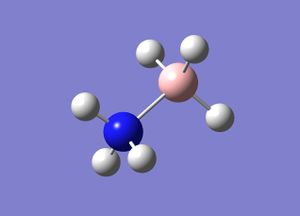
With this initial optimization complete it is now possible to perform an optimization with a higher basis set, 6-31G(dp). Details of this Optimization given as follows:
| Gaussian Calculation Information | ||
|---|---|---|
 | ||
| File Type | .log | |
| Calculation type | Optimisation | |
| Calculation Method | B3LYP | |
| Basis Set | 6-31G(dp) | |
| Final Energy | -83.22468879 au | |
| Gradient | 0.00005911 au | |
| Dipole Moment | 5.5627 D | |
| Point Group | C3 | |
| Calculation Running Time | 26 seconds | |
| Log File | File:DD510 NH3BH3 OPT 631G DP.LOG | |
Item               Value     Threshold  Converged?
 Maximum Force            0.000138     0.000450     YES
 RMS     Force            0.000039     0.000300     YES
 Maximum Displacement     0.001043     0.001800     YES
 RMS     Displacement     0.000231     0.001200     YES
 Predicted change in Energy=-1.199435D-07
 Optimization completed.
    -- Stationary point found.
NH3BH3 Frequency Analysis
Frequency analysis was performed on the previously obtain optimized structure, using the same calculation method and basis set.
| Gaussian Calculation Information | ||
|---|---|---|
 | ||
| File Type | .log | |
| Calculation type | FREQ | |
| Calculation Method | B3LYP | |
| Basis Set | 6-31G(dp) | |
| Final Energy | -83.22468879 au | |
| Gradient | 0.00005911 au | |
| Dipole Moment | 5.5627 D | |
| Point Group | C3 | |
| Calculation Running Time | 41 seconds | |
| Log File | File:DD510 NH3BH3 FREQ.LOG | |
Low frequencies ---  -19.8379   -0.2580   -0.0480    0.1408   12.2896   12.4046
 Low frequencies ---  262.0850  631.3213  637.8351
Calculation of Dissociation Energies
The energies of the optimised BH3, NH3, NH3BH3
E(BH3) = -26.6153236 au
E(NH3) = -56.5577686 au
E(NH3BH3)= -83.22468879 au
The total energy of the NH3BH3 structure will be the sum of the B-H dissociation energy and the BH3 and NH3 energies. It is therefore possible to calculate dissociation energy of the B-N bond: Ediss=E(NH3BH3)-[E(NH3)+E(BH3)] =-0.0515966 au
This value can be calculated from arbitrary units to joules, giving:
Ediss=-135.47KJ/mol
Investigating Aromaticity
All the following calculations in this section have been performed on the HPC system.
Benzene
Optimisation
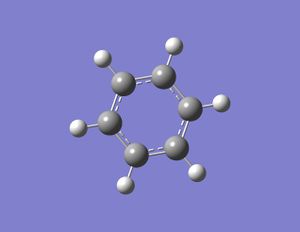
A benzene molecule structure was obtained using the "ring fragment" tool in Gaussview, An optimization was conducted using a DFT, B3LYP method with a 321-G basis set.
| Gaussian Calculation Information | ||
|---|---|---|
 | ||
| File Type | .log | |
| Calculation type | optimization | |
| Calculation Method | B3LYP | |
| Basis Set | 321-G | |
| Final Energy | -230.9757497 au | |
| Gradient | 0.00011813 | |
| Dipole Moment | 0.0001D | |
| Point Group | C1 | |
| Calculation Running Time | 51.6 seconds | |
| C-H Bond length | 0.108 nm | |
| C-C Bond Length | 0.140 nm | |
| H-C-C bond angle | 119.9 degrees | |
| Results, D-space | C5H6 opt 321-g | |
Item               Value     Threshold  Converged?
 Maximum Force            0.000218     0.000450     YES
 RMS     Force            0.000080     0.000300     YES
 Maximum Displacement     0.001064     0.001800     YES
 RMS     Displacement     0.000293     0.001200     YES
 Predicted change in Energy=-5.022124D-07
 Optimization completed.
    -- Stationary point found.
It is seen that the point group assigned is C1, this is due to small deviation in the H-C-C bond angle from an ideal angle of 120 degrees.
A further optimization was conducted with a higher basis set, 6-31G(d,p)
| Gaussian Calculation Information | ||
|---|---|---|
 | ||
| File Type | .log | |
| Calculation type | optimization | |
| Calculation Method | B3LYP | |
| Basis Set | 6-31G(d,p) | |
| Final Energy | -232.2582143 au | |
| Gradient | 0.00003030 au | |
| Dipole Moment | 0D | |
| Point Group | D3H | |
| Calculation Running Time | 30.8 seconds | |
| C-H Bond length | 0.109 nm | |
| C-C Bond Length | 0.140 nm | |
| H-C-C bond angle | 120.0 degrees | |
| Results, D-space | C5H6 opt 6-31g dp | |
 Item               Value     Threshold  Converged?
 Maximum Force            0.000053     0.000450     YES
 RMS     Force            0.000019     0.000300     YES
 Maximum Displacement     0.000113     0.001800     YES
 RMS     Displacement     0.000043     0.001200     YES
 Predicted change in Energy=-2.080119D-08
 Optimization completed.
    -- Stationary point found.
Frequency Analysis
Frequency Analysis was performed on the previously optimized benzene structure. Details of the calculation are given as follows:
| Gaussian Calculation Information | ||
|---|---|---|
| File Type | .log | |
| Calculation type | FREQ | |
| Calculation Method | B3LYP | |
| Basis Set | 6-31G(d,p) | |
| Final Energy | -232.2582143 au | |
| Gradient | 0.00003030 au | |
| Dipole Moment | 0D | |
| Point Group | D3H | |
| Calculation Running Time | 30.8 seconds | |
| C-H Bond length | 0.109 nm | |
| C-C Bond Length | 0.140 nm | |
| H-C-C bond angle | 120.0 degrees | |
| Results, D-space | C6H6 FREQ | |
 Item               Value     Threshold  Converged?
 Maximum Force            0.000071     0.000450     YES
 RMS     Force            0.000030     0.000300     YES
 Maximum Displacement     0.000104     0.001800     YES
 RMS     Displacement     0.000047     0.001200     YES
 Predicted change in Energy=-1.953831D-08
 Optimization completed.
    -- Stationary point found.
 Low frequencies ---   -0.0088   -0.0042   -0.0041   12.1885   12.1885   16.1938
 Low frequencies ---  414.3302  414.3302  621.2669
Boratabenzene
Optimization
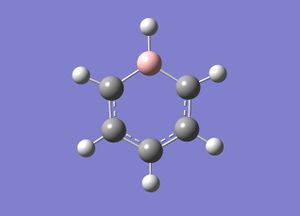
A boratabenzene structure was constructed using Gaussview.An optimization was conducted using a DFT, B3LYP method with a 321-G basis set.
| Gaussian Calculation Information | ||
|---|---|---|
 | ||
| File Type | .log | |
| Calculation type | optimization | |
| Calculation Method | B3LYP | |
| Basis Set | 321-G | |
| Final Energy | -217.8141535 au | |
| Gradient | 0.00011813 | |
| Dipole Moment | 0.00020283D | |
| Point Group | C1 | |
| Calculation Running Time | 1 minute, 25.3 seconds | |
| C-H Bond length | 0.109 nm | |
| C-C Bond Length | 0.141 nm | |
| H-C-C bond angle | 116.3 degrees | |
| B-C Bond length | 0.151 nm | |
| B-H Bond Length | 0.122 nm | |
| H-B-C Bond Angle | 122.2 degrees | |
| Charge | -1 | |
| Results, D-space | BC5H6(-1) opt 321-g | |
Item               Value     Threshold  Converged?
 Maximum Force            0.000345     0.000450     YES
 RMS     Force            0.000086     0.000300     YES
 Maximum Displacement     0.001558     0.001800     YES
 RMS     Displacement     0.000453     0.001200     YES
 Predicted change in Energy=-1.153055D-06
 Optimization completed.
    -- Stationary point found.
A further optimization was conducted with a higher basis set, 6-31G(d,p)
| Gaussian Calculation Information | ||
|---|---|---|
 | ||
| File Type | .log | |
| Calculation type | optimisation | |
| Calculation Method | B3LYP | |
| Basis Set | 6-31G (d,p) | |
| Final Energy | -219.0205305 au | |
| Gradient | 0.00004063 au | |
| Dipole Moment | 2.8455D | |
| Point Group | C1 | |
| Calculation Running Time | 2 minutes, 55.8 seconds | |
| C-H Bond length | 0.110 nm | |
| C-C Bond Length | 0.140 nm | |
| H-C-C bond angle | 116.0 degrees | |
| B-C Bond length | 0.151 nm | |
| B-H Bond Length | 0.122 nm | |
| H-B-C Bond Angle | 122.4 degrees | |
| Charge | -1 | |
| Results, D-space | BC5H6(-1) 6-31G dp | |
 Item               Value     Threshold  Converged?
 Maximum Force            0.000067     0.000450     YES
 RMS     Force            0.000020     0.000300     YES
 Maximum Displacement     0.000304     0.001800     YES
 RMS     Displacement     0.000088     0.001200     YES
 Predicted change in Energy=-4.509495D-08
 Optimization completed.
    -- Stationary point found.
Frequency Analysis
Frequency Analysis was performed on the previously optimized boratabenzene structure. Details of the calculation are given as follows:
| Gaussian Calculation Information | ||
|---|---|---|
 | ||
| File Type | .log | |
| Calculation type | FREQ | |
| Calculation Method | B3LYP | |
| Basis Set | 6-31G (d,p) | |
| Final Energy | -219.0205305 au | |
| Gradient | 0.00004063 au | |
| Dipole Moment | 2.8455D | |
| Point Group | C1 | |
| Calculation Running Time | 5 minutes, 21 seconds | |
| C-H Bond length | 0.110 nm | |
| C-C Bond Length | 0.140 nm | |
| H-C-C bond angle | 116.0 degrees | |
| B-C Bond length | 0.151 nm | |
| B-H Bond Length | 0.122 nm | |
| H-B-C Bond Angle | 122.4 degrees | |
| Charge | -1 | |
| Results, D-space | BC5H6(-1) FREQ | |
 Item               Value     Threshold  Converged?
 Maximum Force            0.000140     0.000450     YES
 RMS     Force            0.000041     0.000300     YES
 Maximum Displacement     0.000338     0.001800     YES
 RMS     Displacement     0.000127     0.001200     YES
 Predicted change in Energy=-5.080038D-08
 Optimization completed.
    -- Stationary point found.
Low frequencies ---  -12.4819   -0.0007   -0.0007    0.0003   14.0025   18.0261
 Low frequencies ---  371.3753  404.1535  565.1953
Pyridinium
Optimization
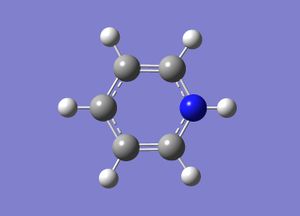
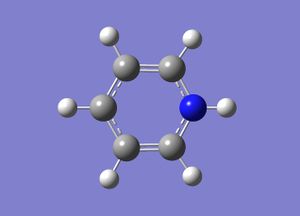
A pyridinium structure was constructed using Gaussview. An optimization was conducted using a DFT, B3LYP method with a 321-G basis set.
| Gaussian Calculation Information | ||
|---|---|---|
 | ||
| File Type | .log | |
| Calculation type | optimization | |
| Calculation Method | B3LYP | |
| Basis Set | 3-21G | |
| Final Energy | -247.2936485 au | |
| Gradient | 0.000052 au | |
| Dipole Moment | 1.9459D | |
| Point Group | C1 | |
| Calculation Running Time | 1 minute, 49.8 seconds | |
| C-H Bond length | 0.108 nm | |
| C-C (ortho-meta) Bond Length | 0.138 nm | |
| C-C (meta-para) Bond Length | 0.140 nm | |
| H-C-C (ortho-meta) bond angle | 123.2 degrees | |
| H-C-C (meta-para) Bond Angle | 120.0 degrees | |
| N-C Bond length | 0.136 nm | |
| N-H Bond Length | 0.102 nm | |
| H-N-C Bond Angle | 118.7 degrees | |
| Charge | +1 | |
| Results, D-space | NC5H6(+1) 321-g | |
Item               Value     Threshold  Converged?
 Maximum Force            0.000110     0.000450     YES
 RMS     Force            0.000030     0.000300     YES
 Maximum Displacement     0.001036     0.001800     YES
 RMS     Displacement     0.000267     0.001200     YES
 Predicted change in Energy=-1.108577D-07
 Optimization completed.
    -- Stationary point found.
A further optimisation was conducted with a higher basis set, 6-31G(d,p)
| Gaussian Calculation Information | ||
|---|---|---|
 | ||
| File Type | .log | |
| Calculation type | optimization | |
| Calculation Method | B3LYP | |
| Basis Set | 6-32G(d,p) | |
| Final Energy | -248.6680739 au | |
| Gradient | 0.00004853 au | |
| Dipole Moment | 1.8719D | |
| Point Group | C1 | |
| Calculation Running Time | 2 minutes, 44.7 seconds | |
| C-H Bond length | 0.108 nm | |
| C-C (ortho-meta) Bond Length | 0.138 nm | |
| C-C (meta-para) Bond Length | 0.140 nm | |
| H-C-C (ortho-meta) bond angle | 123.9 degrees | |
| H-C-C (meta-para) Bond Angle | 120.0 degrees | |
| N-C Bond length | 0.135 nm | |
| N-H Bond Length | 0.102 nm | |
| H-N-C Bond Angle | 118.6 degrees | |
| Charge | +1 | |
| Results, D-space | NC5H6(+1) 6-31g dp | |
Item               Value     Threshold  Converged?
 Maximum Force            0.000085     0.000450     YES
 RMS     Force            0.000028     0.000300     YES
 Maximum Displacement     0.000633     0.001800     YES
 RMS     Displacement     0.000196     0.001200     YES
 Predicted change in Energy=-9.816436D-08
 Optimization completed.
    -- Stationary point found.
Frequency Analysis
Frequency Analysis was performed on the previously optimized pyridinium structure. Details of the calculation are given as follows:
| Gaussian Calculation Information | ||
|---|---|---|
 | ||
| File Type | .log | |
| Calculation type | FREQ | |
| Calculation Method | B3LYP | |
| Basis Set | 6-32G(d,p) | |
| Final Energy | -248.6680739 au | |
| Gradient | 0.00004853 au | |
| Dipole Moment | 1.8719D | |
| Point Group | C1 | |
| Calculation Running Time | 5 minutes, 49 seconds | |
| C-H Bond length | 0.108 nm | |
| C-C (ortho-meta) Bond Length | 0.138 nm | |
| C-C (meta-para) Bond Length | 0.140 nm | |
| H-C-C (ortho-meta) bond angle | 123.9 degrees | |
| H-C-C (meta-para) Bond Angle | 120.0 degrees | |
| N-C Bond length | 0.135 nm | |
| N-H Bond Length | 0.102 nm | |
| H-N-C Bond Angle | 118.6 degrees | |
| Charge | +1 | |
| Results, D-space | NC5H6(+1) FREQ | |
 Item               Value     Threshold  Converged?
 Maximum Force            0.000155     0.000450     YES
 RMS     Force            0.000049     0.000300     YES
 Maximum Displacement     0.000709     0.001800     YES
 RMS     Displacement     0.000263     0.001200     YES
 Predicted change in Energy=-1.019571D-07
 Optimization completed.
    -- Stationary point found.
Low frequencies ---   -6.8925   -0.0009   -0.0008    0.0003   17.3502   18.4482
 Low frequencies ---  392.5081  404.0191  620.5151
Borazine
Optimisation
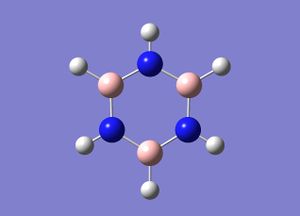
A structure of borazine was constructed using Gaussview. An optimization was conducted using a DFT, B3LYP method with a 321-G basis set.
| Gaussian Calculation Information | ||
|---|---|---|
 | ||
| File Type | .log | |
| Calculation type | Optimization | |
| Calculation Method | B3LYP | |
| Basis Set | 3-21G | |
| Final Energy | -241.3569529 au | |
| Gradient | 0.00005562 au | |
| Dipole Moment | 0 D | |
| Point Group | D3H | |
| Calculation Running Time | 38.9 seconds | |
| N-H Bond length | 0.102 nm | |
| B-H Bond Length | 0.119 nm | |
| N-B Bond Length | 0.145 nm | |
| H-N-B Bond Angle | 118.5 degrees | |
| H-B-N Bond Angle | 121.5 degrees | |
| Results, D-space | B3N3H6 3-21g | |
A further optimization was performed using a 6-31G (d,p) basis set.
| Gaussian Calculation Information | ||
|---|---|---|
 | ||
| File Type | .log | |
| Calculation type | Optimisation | |
| Calculation Method | B3LYP | |
| Basis Set | 6-31G | |
| Final Energy | -242.6845877 au | |
| Gradient | 0.000011159 au | |
| Dipole Moment | 0 D | |
| Point Group | D3H | |
| Calculation Running Time | 1 minute 23.7 seconds | |
| N-H Bond length | 0.101 nm | |
| B-H Bond Length | 0.119 nm | |
| N-B Bond Length | 0.143 nm | |
| H-N-B Bond Angle | 118.5 degrees | |
| H-B-N Bond Angle | 121.5 degrees | |
| Results, D-space | B3N3H6 6-31g dp | |
Frequency Analysis
Frequency Analysis was performed on the previously optimized borazine structure. Details of the calculation are given as follows:
| Gaussian Calculation Information | ||
|---|---|---|
 | ||
| File Type | .log | |
| Calculation type | Optimisation | |
| Calculation Method | B3LYP | |
| Basis Set | FREQ | |
| Final Energy | -242.6845877 au | |
| Gradient | 0.000011159 au | |
| Dipole Moment | 0 D | |
| Point Group | D3H | |
| Calculation Running Time | 1 minute 25.6 seconds | |
| N-H Bond length | 0.101 nm | |
| B-H Bond Length | 0.119 nm | |
| N-B Bond Length | 0.143 nm | |
| H-N-B Bond Angle | 118.5 degrees | |
| H-B-N Bond Angle | 121.5 degrees | |
| Results, D-space | B3N3H6 FREQ | |
Item               Value     Threshold  Converged?
 Maximum Force            0.000273     0.000450     YES
 RMS     Force            0.000112     0.000300     YES
 Maximum Displacement     0.000566     0.001800     YES
 RMS     Displacement     0.000268     0.001200     YES
 Predicted change in Energy=-4.031333D-07
 Optimization completed.
    -- Stationary point found.
 Low frequencies ---   -9.4281   -9.1468   -8.9821   -0.0106    0.0356    0.1129
 Low frequencies ---  289.2508  289.2587  404.1687
Population Analysis
Popultation analysis calculations were conducted on the benzene, boratabenzene, pyridinium and borazine molecules from their previous optimisations (6-31G dp).
| Molecule | D-Space Link | |
|---|---|---|
| Benzene | C6H6 pop | |
| Boratabenzene | BC5H6 pop | |
| Pyridinium | NC5H6 pop | |
| Borazine | N3B3H6 pop |
NBO Analysis
Benzene
Looking at the charge distribution for benzene, the charge is distributed evenly across all the carbon atoms. Each carbon atom has a value of -0.238.
Boratobenzene
For this molecule one C-H of the ring has been replaced with a B-H group. This structure is isoelectronic with benzene, however the molecule carries a negative charge due to the boron atom having one less proton than the carbon. It can be seen clearly that now the charge distribution is not evenly distributed across the ring. The boron caries a relative charge of +0.202, the ortho carbons a value of -0.588, the para carbons -0.250 and the ortho carbon -0.340. Boron is more electropositive than carbon therefore the electron density lies towards the carbons centers, especially the ortho carbons. What is noticeable is that the carbon in the para position carries more electron density than the meta carbons, this could be due to the fact there is only one para carbon accepting electron density from two directions.
Pyridinium
The pyridinium cation is also isoelectronic with bezene, though carries a formal positive charge. Unlike boron, nitrogen is more electronegative than carbon. This means electron density in the molecule will lie more towards the nitrogen atom. This is seen in the charge distribution, with nitrogen have a relative charge of -0.476, the ortho carbons +0.071, the meta carbons -0.241 and para carbon -0.122. As with boratobenzene it is the ortho carbons experiencing the greatest effect and the meta the least.
Borazine
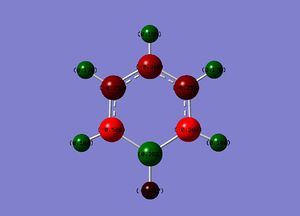
Once again borazine isoelectronic with benzene but unlike boratabenzene and pyridinium it carries no formal charge. As may be expected, when looking at the charge distribution there is not an even spread around the ring. Each nitrogen atom carries a relative charge of -1.102 and each boron +0.747. This can once again be explained by the differences in the electronegativities of boron and nitrogen, with nitrogen being the more electronegative atom.
The charge distributions can be related to the dipole moments in the molecules. Both benzene and borazine don't have a dipole moment, which relates to the point that their charge distributions are highly symmetrical, though benzene's distribution is more symmetric. Boratabenzene and pyridinium both contain dipole moments and this is due to their charge distributions containing only two planes of symmetry, a sigma h and sigma v plane. The dipole moment in boratabenzene is great, this suggests that the substitution of carbon for boron causes a greater distortion in charge distribution than when nitrogen substitutes carbon.
MO Analysis
Benzene MO Diagram
The computed MOs for benzene were studied and from them a series of LCAOs were drawn to match the computed MOs. These are shown in the following MO diagram:
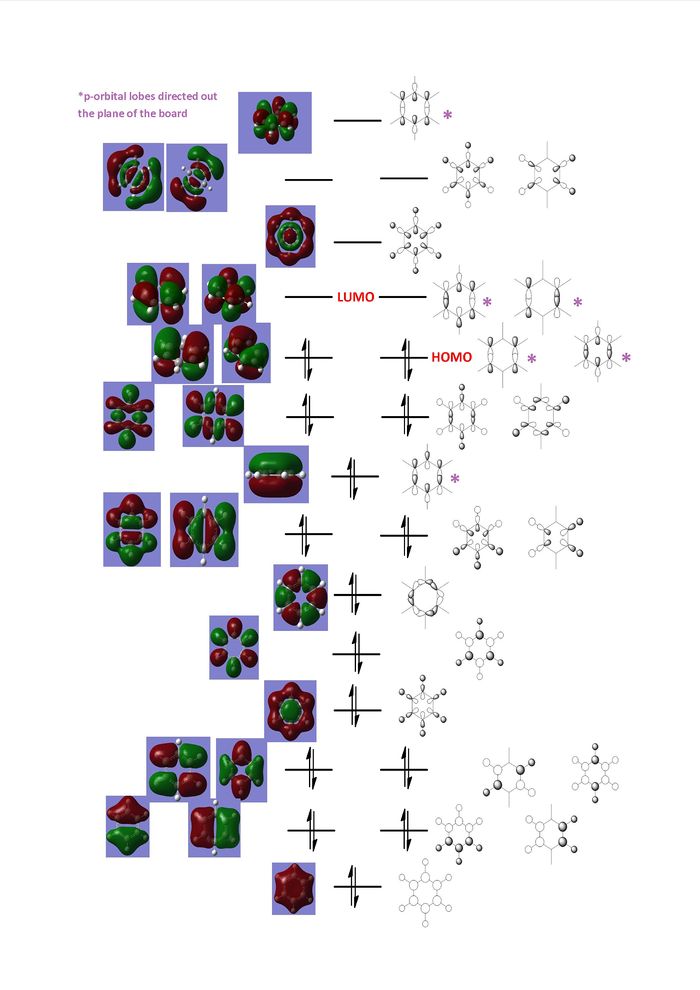
Benzene can be considered a relatively simple molecule containing 6 carbons and 6 hydrogens though the MO diagram shows how complex it can be to qualitatively predict molecular orbitals using LCAO approximation.
In substituting a carbon atom for boron or nitrogen the molecule degree of symmetry decreases. This will cause a loss is the number of degenerate molecular orbitals. Other complications would arise in the LCAO diagrams for these two molecules due to different atomic orbitals sizes and energies of hetero-atoms. This does not occur in benzene where all the carbon atoms have the same orbital size and energies.
Comparisons of Occupied MOs
The table below shows the first three occupied pi orbitals for the four aromatic molecules.
| Benzene | Boratabenzene | Pyridinium | Borazine | |||||||||||||
|---|---|---|---|---|---|---|---|---|---|---|---|---|---|---|---|---|
| 1st Pi orbital |
|
|
|
| ||||||||||||
| Energy | -0.36 | -0.13 | -0.64 | -0.36 | ||||||||||||
| 2nd Pi orbital |
|
|
|
| ||||||||||||
| Energy | -0.25 | -0.03 | -0.51 | -0.28 | ||||||||||||
| 3rd Pi orbital |
|
|
|
| ||||||||||||
| Energy | -.25 | +0.01 | -0.48 | -0.28 |
1st pi orbitals Looking across these four pi orbitals it can be seen that the electrons occupying these orbitals are completely delocalized above and below the ring, with no nodes. Benzene has the highest degree of symmetry of the four molecules and will be used as a point of comparison. For boratabenze, electron density resides slightly away from the boron atom, while in pyridinium the electron density is more towards the nitrogen atom. The nitrogen atom centre, being more electronegative than carbon, is better at stabilising negative charge therefore its is more favourable for electron density to reside towards it. Alongside this pyridinium's 1st pi orbital energy is the lowest of the four, while boron's is the highest. The molecular orbital can be pictured as a combination of pz orbitals from each atom in the ring. Once again nitrogen's greater electronegativity in comparison to carbon and boron make its pz orbital lower in energy than the three and this is echoed in the molecular orbitals.
Borazine's orbital is very similar in shape to benzene's as is its energy. Obersving the computed image of the orbital, slight ripples are seen going around the ring, which peak very slightly over the nitrogen atoms. This occurs for the same reasons as mentioned previously for the non-unity of electron density in boratabenzene and pyridinium, with electron density being more stabilized over nitrogen. Nitrogen and boron lie either side of carbon on the periodic table so their differences in electronegativity to carbon are very similar, for this reason the energy of this molecular orbital is near identical to benzene.
2nd and 3rd pi orbitals In the case of benzene and borazine these two orbitals are degenerate, though for pyridinium and boratabenzene they are not. All these pi orbitals contain two nodal planes perpendicular to the plane of the ring, one that cuts through two opposite bonds and one which cut two opposite atoms. The higher symmetry that exists in both benzene and borazine cause the 2nd and 3rd pi orbitals to be degenerate.
Viewing the two pi orbitals for pyridinium and boratabenzene, the orbitals that contains a nodal plane that runs along the sigma v plane of symmetry has symmetrical orbital lobes. In the case of the other orbital the nodal plane does not follow a plane of symmetry and this causes the orbital lobes to be distorted and unsymmetrical. For borazine the nodal plane that cuts two bonds doesn not run with a plane of symmetry at at can be seen that the orbital lobes are unsymmetrical along the the plane. In the case of the orbital with a nodal plane that follows the sigma v plane of symmetry the lobes are symmetrical across this plane. With this orbital it can be seen that the electron density resides more towards the nitrogen atoms.
For pyridinium the orbital which has its nodal plane cutting two bonds is lower in energy than the orbital with a nodal plane cutting two atoms. This can be explained by the stabilisation occurring when the electron density is able to migrate over the electronegative nitrogen centre. With boron being more electropositive than nitrogen the reverse is seen in the orbital energies.
Comparison of Aromaticity
Huckel's rule is a tool that describes whether a planar ring system is aromatic or anti-aromatic. 4n+2 pi electrons relates to an aromatic system and 4n pi electrons to an anti-aromatic system. An ideal aromatic system will have its 4n+2 pi electrons completely delocalised across the ring. Huckel's rule is effective in recognising aromatic systems but not in describing the degree of aromaticity.
The NBO analysis and the MO analysis performed in this section have shown how boratabenzene, pyridinium and borazine appear to vary from an ideal aromatic, which benzene can be considered as ideal. The charge distributions indicate that electron charge across the borazine molecule is very much localised on top of the nitrogen atoms, an indication of low aromaticity in the molecule. The charge distributions of pyridinium and boratabenzene, when comparing their deviations from benzene's even distribution, would indicate that pyridininium is more aromatic than boratabenzene. These points are echoed in the computed MO images.
An interested method of quantifying aromaticity is Nucleus-Independant Chemical Shifts method. First appearing in literature[5] in 1996 this makes use of the changes in chemical shift an aromatic ring causes. The more the pi electrons in an aromatic ring are, the better the ring is at sustaining a ring current. The effects on chemical shifts outside the ring are small, while inside the ring the changes are large as the aromaticity changes. Inside the ring up-field chemical shifts are seen, such as the protons inside annulene.
For the small aromatic rings, such as the ones that have been used in this project, it is possible to place a "dummy" atom in the center of the ring and then predict an NMR spectrum using Gausssian. By looking at the the chemical shift of the dummy and comparing to the shifts of dummy atoms in other aromatic rings it is possible rank their aromaticity.
An attempt of this method was made. For each of the optimized aromatic rings a dummy atom was placed in the center of the ring. An NMR type calculation was run on each of these molecules and the resulting NMR spectra observed.
| Benzene | Boratabenzene | Pyridinium | Borazine | |
|---|---|---|---|---|
| File Type | LOG | LOG | LOG | LOG |
| Calculation Type | SP | SP | SP | SP |
| Calculation Method | B3LYP | B3LYP | B3LYP | B3LYP |
| Basis Set | 6-31G (dp) | 6-31G (dp) | 6-31G (dp) | 6-31G (dp) |
| Final energy | -232.2582123 au | -219.0205305 au | -248.6680739 | -242.6845979au |
| Dipole Moment | 0D | 2.8455D | 1.8719D | 0D |
| Calculation Time | 1 min 16.2 secs | 1 min 14.9 sec | 1 min 32.1 sec | 59.7 sec |
| Results, D-space | File:Benzene NMR.log | BC5H6(-1) NMR | NC5H6(+1) NMR | B3N3H6 NMR |
| NMR Spectrum | 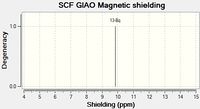 |
 |
 |

|
| Chemical Shift (ppm) | 9.84 | 8.79 | 8.51 | 2.67 |
It can be seen that the chemical shifts for the "dummy" atoms in the four NMRs decrease in the order of benzene, boratabenzene, pyridinium, borazine. This data suggests that pyridininum is more aromatic than boratabenzene which goes against what was previously inferred from the previous data. It should be noted that when looking at the charge distribution it is the whole electronic system of the molecule being observed, yet in NICS it is only effects of the aromatic ring being seen.
Borazine's chemical shift is much nearer to zero than the other molecules. This result, coupled with findings throughout the report suggest that borazine's aromaticity is considerably less than the other three molecules.
References
- ↑ W.M Haynes CRC handbook of Chemistry and Physics 2011 92nd Ed.p9-21
- ↑ University College London. Main Energy Conversion Factors. http://www.ucl.ac.uk/~uccaati/Energy.html
- ↑ J.Glasier, G. Johansson. On the Structures of the Hydrated Thallium (II) Ion and its Bromide Complexes in Aqueous Solution. Acta Chemica Scandinavica. 1982, 36, pp 125-135 http://actachemscand.dk/pdf/acta_vol_36a_p0125-0135.pdf
- ↑ C. Ballhausen, H. Gray, Inorg. Chem. , 1 (1), 1962, pp 111-122
- ↑ P. Schleyer, C. Maerker, A. Dransfeld, H. Jiao, N. J. R. Eikema Hommes,J. Am. Chem. Soc., 1996, 118 (26), pp 6317–6318

