Rep:Mod:db810
Bonding and Molecular Orbitals in Main Group Compounds
Inorganic Module 2
Abstract
Introduction to Computational Chemistry
Computational chemistry is the branch of chemistry that applies mathematical, chemical and computing techniques to solve chemical problems. It is a powerful technique that can be used to great effect when certain properties of molecules are required, ranging from electronic structure determinations to potential energy surface calculations. Acquiring such data enables the chemist to form predictions in relation to their reactions before experiments are run, making them better prepared for making observations.
The underlying foundation to all computational chemistry is the Schrödinger equation which can be greatly simplified by applying the Born-Oppenheimer approximation, allowing a wavefunction to be broken down into both electronic and nuclear vibrational and rotational parts. The electronic part of this equation is then solved for electrons only, assuming nuclei are fixed. This greatly reduces the complexity of the algorithms involved in the computational analysis and hence leads to shorter times for a simulated calculation to be made.
Having a large database of chemical compounds at your fingertips is incredible advantageous, especially when the materials under consideration:
- Are too expensive to purchase
- Impose serious health risks (e.g. toxicity, radioactivity)
- Are difficult to synthesise
- Aren't readily available
Optimising Molecules
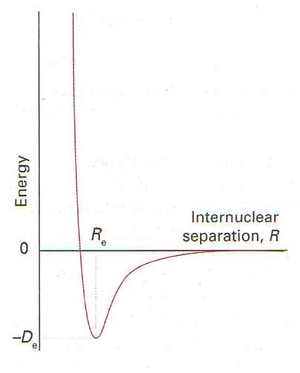
When the Born-Oppenheimer approximation is used on the Schrödinger equation, energy can be obtained as a function of the distance between the fixed nuclei. As the nuclei move closer together, favourable coulombic nuclear-electron interactions result in a decrease in the total energy until a point is reached where the nuclei begin to repel one another, resulting in a rapid increase in energy. This point is known as the equilibrium distance between nuclei and corresponds to a state where there is no force governing which way the nuclei will move relative to each other. For a diatomic, this is summarised in figure 1. This is the potential energy surface (PES) of the molecule and is what is used when carrying out an optimisation in a computational program such as Gaussian™.
From an initial predetermined internuclear distance, Gaussian™ changes this distance and calculates the difference in energy brought about by the change. The gradient at the point is also calculated to determine the force, where the force vector is the negative derivative of potential energy with respect to distance:
When a minimum in energy difference has been determined by sweeping through internuclear distances the gradient will equal zero; indicative of a stationary point and hence equilibrium distance. The length between nuclei in this stable equilibrium state is called the optimised bond distance.
Pseudo-Potentials
For lighter elements, the Schrödinger equation is sufficient to provide reliable results computationally. As the atoms increase in size and mass, relativity starts to affect the calculations which can provide results deviating from expectations.
A way around these relativistic effects is to use a "pseudo-potential" that represents the core electrons in a heavy atom as a function. Although there is an assumption made here that it is the valence electrons alone that determine bonding character, pseudo-potentials are surprisingly accurate.
Basis Sets
A basis set is the linear combination of atomic orbitals needed to define a group of functions to represent molecular orbitals.
When analysing post-second row atoms, where the atomic structure gets more complex, the basis set needs to be improved to describe the electronic structure more accurately. By improving the basis set, the time taken to optimise the molecule increases so there is discrepancy between high accuracy attained and a low CPU times.
Optimising a Molecule of BH3
Borane (BH3) is a trigonal planar molecule with three sp2 hybridised bonds and D3h symmetry. Its vacant p orbital orthogonal to the σh plane gives it high Lewis acidity. Free borane is therefore only found in the gas phase as it can readily dimerise to diborane (B2H6).
3-21G Basis Set
| BH3 Optimisation: 3-21G Basis Set | ||
|---|---|---|
| ||
| Optimised H-B-H bond angles: 120°
Optimised B-H bond lengths: 1.19349Å | ||
| File Type | .log | |
| Calculation Type | FOPT | |
| Calculation Method | RB3LYP | |
| Basis Set | 3-21G | |
| Charge | 0 | |
| E(RB3LYP) | -26.46226338 a.u. | |
| RMS Gradient | 0.00020672 a.u. | |
| Dipole Moment | 0.0000 Debye | |
| Point Group | D3h | |
| Job CPU Time | 13.0 Seconds | |
| link to .log file | ||
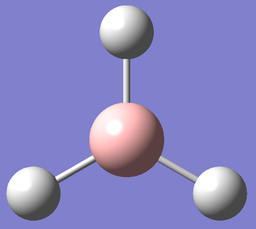
A BH3 molecule was drawn in GaussView™ (a graphical interface of Gaussian™) and an optimisation calculation was run with internuclear B-H distances set to 1.5Å using the low-accuracy 3-21G basis set, coupled with a B3LYP method.
The summary of the calculation and an image of the optimised molecule are displayed in table 1, which also includes the optimised bond lengths and angles.
| Item Table for BH3 Optimisation Using a 3-21G Basis Set |
|---|
          Item               Value     Threshold  Converged?
 Maximum Force            0.000413     0.000450     YES
 RMS     Force            0.000271     0.000300     YES
 Maximum Displacement     0.001610     0.001800     YES
 RMS     Displacement     0.001054     0.001200     YES
 Predicted change in Energy=-1.071764D-06
 Optimization completed.
    -- Stationary point found.
                           ----------------------------
                           !   Optimized Parameters   !
                           ! (Angstroms and Degrees)  !
 --------------------------                            --------------------------
 ! Name  Definition              Value          Derivative Info.                !
 --------------------------------------------------------------------------------
 ! R1    R(1,2)                  1.1935         -DE/DX =    0.0004              !
 ! R2    R(1,3)                  1.1935         -DE/DX =    0.0004              !
 ! R3    R(1,4)                  1.1935         -DE/DX =    0.0004              !
 ! A1    A(2,1,3)              120.0            -DE/DX =    0.0                 !
 ! A2    A(2,1,4)              120.0            -DE/DX =    0.0                 !
 ! A3    A(3,1,4)              120.0            -DE/DX =    0.0                 !
 ! D1    D(2,1,4,3)            180.0            -DE/DX =    0.0                 !
 -------------------------------------------------------------------------------
GradGradGradGradGradGradGradGradGradGradGradGradGradGradGradGradGradGrad
|
Table 2 shows the Item table for the optimisation. It is clear from this that there was convergence within the calculation (note the "YES" characters within the table) and that a stationary point was found (note the -DE/DX values reaching 0.0). The optimised H-B-H angle of 120° (diborane lit 120.29) is consistent with trigonal planar geometry and the optimised bond distance of 1.19349Å in good agreement with literature (diborane terminal B-H distance = 1.1968Å) [2]
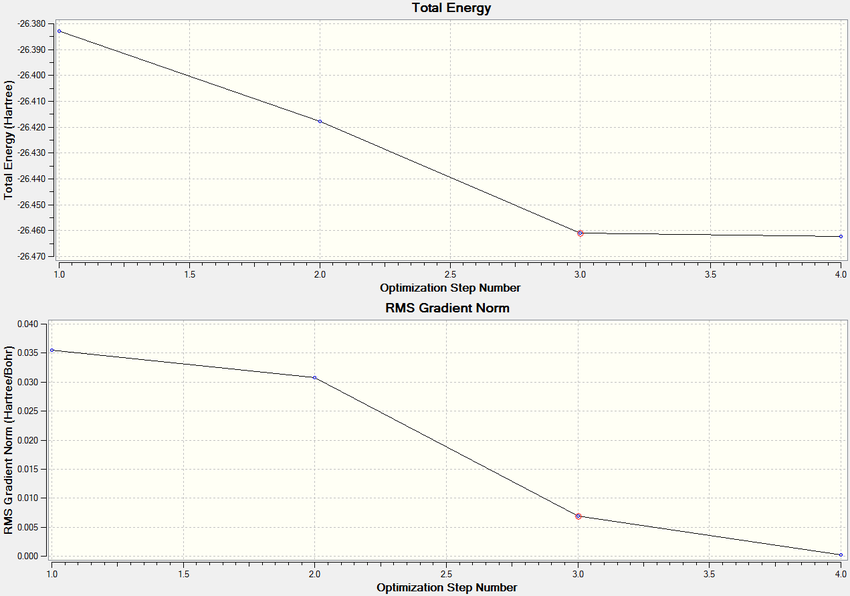
The optimisation is also represented graphically below. It shows how both the total energy and the RMS gradient (force) change with each step of the optimisation before reaching minimum values.
6-31G(d,p) Basis Set
| BH3 Optimisation: 6-31G(d,p) Basis Set | ||
|---|---|---|

| ||
| Optimised H-B-H bond angles: 120°
Optimised B-H bond lengths: 1.19143Å | ||
| File Type | .log | |
| Calculation Type | FOPT | |
| Calculation Method | RB3LYP | |
| Basis Set | 6-31G(d,p) | |
| Charge | 0 | |
| E(RB3LYP) | -26.61532252 a.u. | |
| RMS Gradient | 0.00021672 a.u. | |
| Dipole Moment | 0.0000 Debye | |
| Point Group | D3h | |
| Job CPU Time | 11.0 Seconds | |
| link to .log file | ||
The previously optimised molecule was further optimised using the more complex 6-31G(d,p) basis set. Again, a B3LYP method was used. Table 3 summarises the optimisation, which also includes the optimised bond lengths and angles.
| Item Table for BH3 Optimisation Using a 6-31G(d,p) Basis Set |
|---|
         Item               Value     Threshold  Converged?
 Maximum Force            0.000433     0.000450     YES
 RMS     Force            0.000284     0.000300     YES
 Maximum Displacement     0.001702     0.001800     YES
 RMS     Displacement     0.001114     0.001200     YES
 Predicted change in Energy=-1.189019D-06
 Optimization completed.
    -- Stationary point found.
                           ----------------------------
                           !   Optimized Parameters   !
                           ! (Angstroms and Degrees)  !
 --------------------------                            --------------------------
 ! Name  Definition              Value          Derivative Info.                !
 --------------------------------------------------------------------------------
 ! R1    R(1,2)                  1.1914         -DE/DX =    0.0004              !
 ! R2    R(1,3)                  1.1914         -DE/DX =    0.0004              !
 ! R3    R(1,4)                  1.1914         -DE/DX =    0.0004              !
 ! A1    A(2,1,3)              120.0            -DE/DX =    0.0                 !
 ! A2    A(2,1,4)              120.0            -DE/DX =    0.0                 !
 ! A3    A(3,1,4)              120.0            -DE/DX =    0.0                 !
 ! D1    D(2,1,4,3)            180.0            -DE/DX =    0.0                 !
 --------------------------------------------------------------------------------
 GradGradGradGradGradGradGradGradGradGradGradGradGradGradGradGradGradGrad
|
Table 4 confirms that the series has indeed converged. The RMS gradient is also below 0.001, further indicating a convergence. An optimised H-B-H angle of 120° implies a trigonal planar coordination geometry.
It is not surprising to observe the smaller optimised B-H bond distance when the more complex ("better") basis set is used. The energy is also smaller with the 6-31G(d,p) basis set by a value of 0.15305914 a.u. This corresponds to 401.86 kJ/mol, a very large amount of energy considering the bonds are shortened by 0.00206Å! It is therefore important to note that energies of molecules over different basis sets (or pseudo-potentials) or molecules with different numbers of atoms cannot be compared. Only structures with the same number of atoms run with the same basis sets can directly be compared energetically as these values are highly dependent on basis set quality.
Optimising a Molecule of TlBr3
| TlBr3 Optimisation: LanL2DZ Basis Set | ||
|---|---|---|
| ||
| Optimised Br-Tl-Br bond angles: 120°
Optimised Tl-Br bond lengths: 2.65095Å | ||
| File Type | .log | |
| Calculation Type | FOPT | |
| Calculation Method | RB3LYP | |
| Basis Set | LanL2DZ | |
| Charge | 0 | |
| E(RB3LYP) | -91.21812851 a.u. | |
| RMS Gradient | 0.00000090 a.u. | |
| Dipole Moment | 0.0000 Debye | |
| Point Group | D3h | |
| Job CPU Time | 39.7 Seconds | |
| DOI:10042/22721 | ||
Thallium (III) bromide is a relatively unstable compound that disproportionates to thallium (II) bromide below 40°C.
LanL2DZ Basis Set
Thallium and bromine are both large atoms with many electrons in their structures; 81 and 35 respectively. A pseudo-potential is required to minimise effects arising from relativity. The medium-level LanL2DZ basis set is perfect for this type of calculation; it uses the D95V basis set for first row atoms and the Los Alamos ECP pseudo-potential on heavier elements.
The optimisation was carried out using a B3LYP method after restricting the geometry of the molecule to D3h with a "very tight" tolerance to reduce errors in the calculation. This job was sent to Imperial's D-Space and a DOI link is provided in table 5.
| Item Table for TlBr3 Optimisation Using a LanL2DZ Basis Set |
|---|
         Item               Value     Threshold  Converged?
 Maximum Force            0.000002     0.000450     YES
 RMS     Force            0.000001     0.000300     YES
 Maximum Displacement     0.000022     0.001800     YES
 RMS     Displacement     0.000014     0.001200     YES
 Predicted change in Energy=-6.084036D-11
 Optimization completed.
    -- Stationary point found.
                           ----------------------------
                           !   Optimized Parameters   !
                           ! (Angstroms and Degrees)  !
 --------------------------                            --------------------------
 ! Name  Definition              Value          Derivative Info.                !
 --------------------------------------------------------------------------------
 ! R1    R(1,2)                  2.651          -DE/DX =    0.0                 !
 ! R2    R(1,3)                  2.651          -DE/DX =    0.0                 !
 ! R3    R(1,4)                  2.651          -DE/DX =    0.0                 !
 ! A1    A(2,1,3)              120.0            -DE/DX =    0.0                 !
 ! A2    A(2,1,4)              120.0            -DE/DX =    0.0                 !
 ! A3    A(3,1,4)              120.0            -DE/DX =    0.0                 !
 ! D1    D(2,1,4,3)            180.0            -DE/DX =    0.0                 !
 --------------------------------------------------------------------------------
 GradGradGradGradGradGradGradGradGradGradGradGradGradGradGradGradGradGrad
|
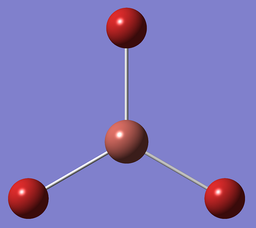
The Item table above shows that there was convergenge in force (-DE/DX). The optimised bond length of 2.65095Å is in agreement with literature (2.52Å)[3] and the Br-Tl-Br optimised angle implies trigonal planar geometry.
Optimising a Molecule of BBr3
| BBr3 Optimisation: Gen Basis Set | ||
|---|---|---|
| ||
| Optimised Br-B-Br bond angles: 120°
Optimised B-Br bond lengths: 1.93396Å | ||
| File Type | .log | |
| Calculation Type | FOPT | |
| Calculation Method | RB3LYP | |
| Basis Set | Gen | |
| Charge | 0 | |
| E(RB3LYP) | -64.43645296a.u. | |
| RMS Gradient | 0.00000382 a.u. | |
| Dipole Moment | 0.0000 Debye | |
| Point Group | D3h | |
| Job CPU Time | 18.3 Seconds | |
| DOI:10042/22805 | ||
Boron tribromide is a highly reactive fuming liquid at room temperature which has strong Lewis acid properties.
Gen Basis Set
In this case, there are both heavy and light atoms in the same molecule. A pseudo-potential would need to be applied for the bromine atoms whereas a full basis set for boron is needed. The Gen basis set allows the user to specify basis sets for individual atoms within a molecule. For this optimisation, a 6-31G(d,p) was used for boron and LanL2DZ for bromine with a RB3LYP method. The molecule was created using Gaussview™ with a modified molecule of optimised BH3 shown in table 3.
| Item Table for BBr3 Optimisation Using a Gen Basis Set |
|---|
         Item               Value     Threshold  Converged?
 Maximum Force            0.000008     0.000450     YES
 RMS     Force            0.000005     0.000300     YES
 Maximum Displacement     0.000036     0.001800     YES
 RMS     Displacement     0.000023     0.001200     YES
 Predicted change in Energy=-4.027671D-10
 Optimization completed.
    -- Stationary point found.
                           ----------------------------
                           !   Optimized Parameters   !
                           ! (Angstroms and Degrees)  !
 --------------------------                            --------------------------
 ! Name  Definition              Value          Derivative Info.                !
 --------------------------------------------------------------------------------
 ! R1    R(1,2)                  1.934          -DE/DX =    0.0                 !
 ! R2    R(1,3)                  1.934          -DE/DX =    0.0                 !
 ! R3    R(1,4)                  1.934          -DE/DX =    0.0                 !
 ! A1    A(2,1,3)              120.0            -DE/DX =    0.0                 !
 ! A2    A(2,1,4)              120.0            -DE/DX =    0.0                 !
 ! A3    A(3,1,4)              120.0            -DE/DX =    0.0                 !
 ! D1    D(2,1,4,3)            180.0            -DE/DX =    0.0                 !
 --------------------------------------------------------------------------------
 GradGradGradGradGradGradGradGradGradGradGradGradGradGradGradGradGradGrad
|
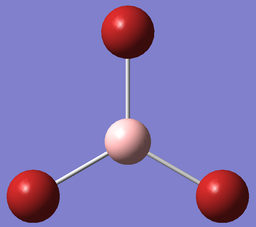
The optimised bond length of 1.93396Å is in good agreement with literature (1.89Å)[4]. The optimised Br-B-Br angle of 120 supports a trigonal planar geometry. The Item Table above indicates convergence, which is confirmed with the RMS gradient of 0.00000382 a.u. being much lower than 0.001 a.u.
Structure Comparison of BH3, BBr3 and TlBr3
| Bond | Bond Length (Å) |
|---|---|
| B-H | 1.19143 |
| B-Br | 1.93396 |
| Tl-Br | 2.65095 |
Differences in Bond Length
Table 9 summarises the key bond distance results acquired from the optimisations discussed in the previous section. The B-H bond distance used here is that of the more complex basis set 6-31G(d,p).
When the ligand is changed from hydrogen to bromine with boron as a central atom, the bond length increases. Both hydrogen and bromine are available to donate electrons to form bonds, but a main difference between the two is that hydrogen donates an electron in its 1s orbital whereas bromine donates an electron from a 4p orbital. Though p orbitals in general are more directional than isotropic s orbitals to provide better overlap for electron sharing, the difference in principal quantum number between 4p and the 2sp2 orbitals of boron is too large to provide efficient overlap. The stronger overlap with 1s hydrogen is more favourable energetically, which corresponds to a shorter bond length; a difference of 0.74253Å when compared with bromine 4p.
The same principle governs the effects of changing the central atom. Though boron and thallium are both in group 3, the sp2 hybridised orbitals of boron used for bonding have a principle quantum number of 2 compared with thallium's 6. Bromine's 4p orbital overlap is much better with 2sp2 bromine compared with 6sp2 thallium due to the less diffuse nature of this hybridised boron orbital.
Bonding: A Definition
A bond is defined as an interaction between two atoms, whether it being an electrostatic attraction between two ions (i.e. an ionic bond) or an interatomic sharing of electrons between orbitals (a covalent bond). A region of high electron density is found between these two atoms. It is rare to observe solely one type of bonding in an interaction between two different atoms due to small changes in electronegativity shifting the electron density towards one atom. 100% covalence implies full electron density precisely half way between two interacting nuclei.
During certain points in the optimisation of a molecule in Gaussian™, Gaussview™ shows that bonds are not drawn between the atoms. Gaussview™ has predefined values as to what a bond is (perhaps referenced average bond lengths ± a certain value). When the interatomic distance falls into this predefined threshold, bonds are drawn.
Frequency Analysis
BH3
| File Type | .log |
| Calculation Type | FOPT |
| Calculation Method | RB3LYP |
| Basis Set | 6-31(d,p) |
| Charge | 0 |
| E(RB3LYP) | -26.61532364 a.u. |
| RMS Gradient Norm | 0.00000162 a.u. |
| Dipole Moment | 0.0000 Debye |
| Point Group | D3h |
| Job CPU Time | 8.0 Seconds |
| link to .log file | |
Frequency analysis is essential to support the idea that the optimised molecule lies at an energy minimum and is the most stable structure.
The 6-31G(d,p) optimised molecule of borane underwent frequency analysis. The same basis set and the same method must be applied here for the results to be meaningful, so the frequency analysis was done under a 6-31G(d,p) basis set and R3LYP method. The command "int=grid=ultrafine" was inputted as an additional keyword to reduce the noise by reducing the range of electron density. A "very tight" D3h point group constraint also needed to be applied to reduce low frequency magnitude to provide more meaningful data. Table 10 summarises the frequency analysis on the optimised borane molecule.
| Item Table for BH3 Frequency Analysis Using a 6-31G(d,p) Basis Set |
|---|
Low frequencies --- -7.0794 -7.0439 -0.0279 0.0004 0.7084 6.6303 Low frequencies --- 1163.0023 1213.1577 1213.1579 |
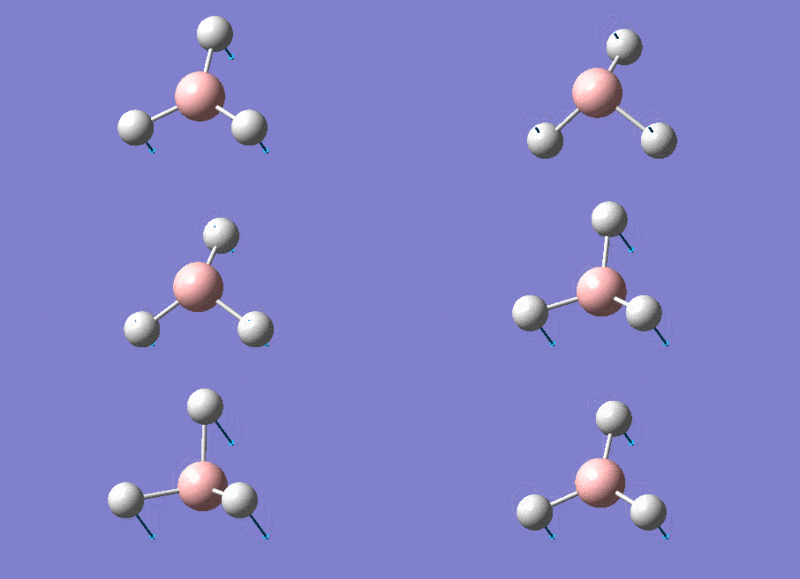
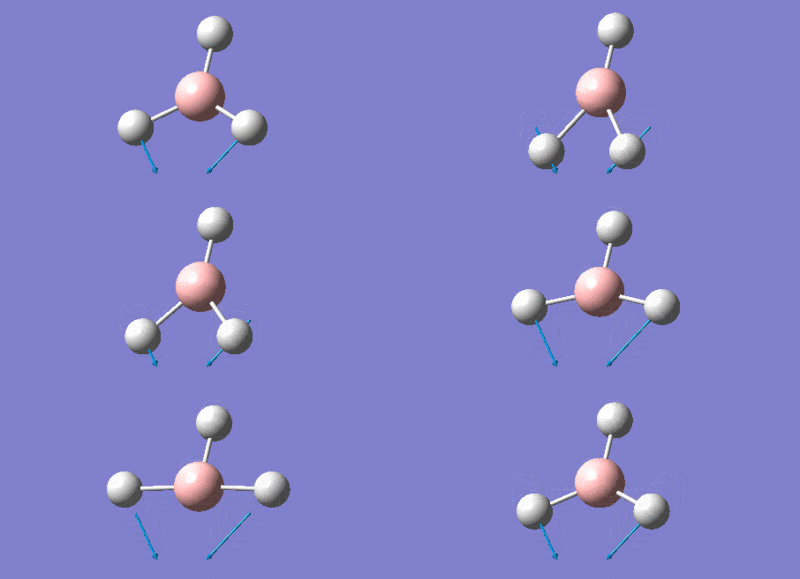
The energy of the molecule after the frequency analysis is similar to that of the optimised borane using the 6-31(d,p) basis set. This indicates that the frequency analysis was a success and that the molecule was minimised. The low frequencies quoted in table 11 are within ±15 cm-1 which indicates that the motions of the molecule's centre of mass do not significantly interfere with the frequencies we wish to analyse; the first vibration has A2" symmetry and a frequency of 1163.0023 cm-1 which is just under 165 times the value of the highest low frequency. These six low vibrational frequencies should be as close to zero as possible for the best result frequency analysis.
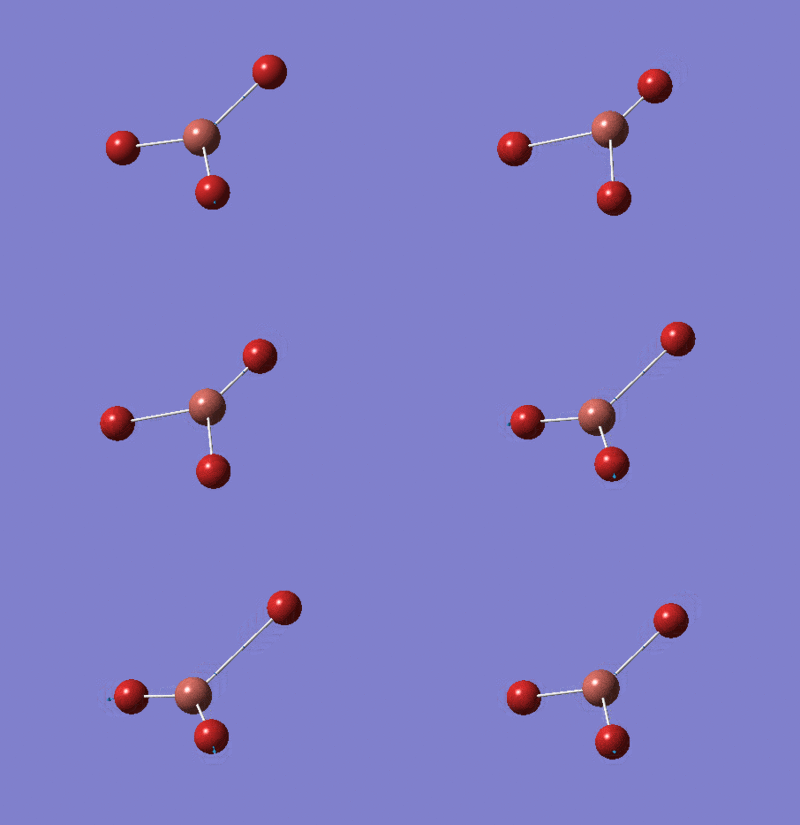
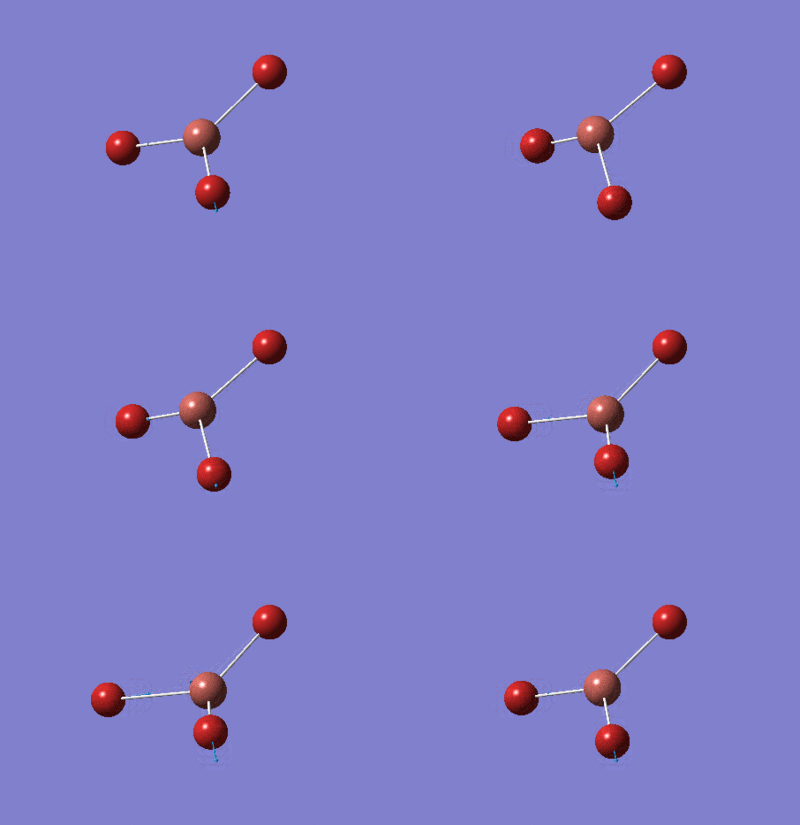
A non-linear molecule has 3N-6 modes of vibration. The low frequencies represent the "-6" part of the equation, so for a 4 atom molecule such as borane there are 6 vibrational modes that can be visualised. These vibrations are represented in table 12.
Infrared Spectrum of BH3
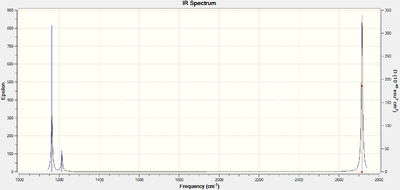
The infrared spectrum of borane can be simulated using the Gaussview™ interface and is shown in figure 3 below.
The spectrum clearly shows three infrared peaks centred around 1163cm-1, 1213cm-1 and 2716cm-1 even though there are six vibrational modes for the molecule. This is because vibrational mode 4 corresponding to a frequency of 2582.48cm-1 is totally symmetric and results in no change in the dipole moment of the molecule, rendering it IR inactive. Modes 5 and 6 are degenerate with E' symmetry, as are 2 and 3. Degeneracy means that both sets of vibrations correspond to one frequency each because equal energy implies equal frequency under the Planck relation.
The final result is an infrared spectrum comprising of peaks at 1163.00cm-1, 1213.16cm-1 and 2715.61cm-1. These values are consistent with literature, where BH3 was successfully trapped by the pyrolysis of BH3CO in Ar matrix to produce infrared peaks at 1125, 1604 and 2808cm-1.[5]
TlBr3
A frequency analysis was also run on the previously optimised TlBr3. The frequency analysis was run with the LanL2DZ basis set, which uses pseudo-potential to model the core electrons as both thallium and bromine are large molecules that experience relativistic effects. Again, a RB3LYP method was used:
| Item Table for TlBr3 Frequency Analysis Using a LANL2DZ Basis Set |
|---|
Low frequencies --- -0.0012 -0.0006 0.0000 1.8732 2.6580 2.6580 Low frequencies --- 46.6999 46.7000 51.9500 |
| File Type | .log |
| Calculation Type | FOPT |
| Calculation Method | RB3LYP |
| Basis Set | LANL2DZ |
| Charge | 0 |
| E(RB3LYP) | -91.21813024 a.u. |
| RMS Gradient Norm | 0.00000000 a.u. |
| Dipole Moment | 0.0000 Debye |
| Point Group | D3h |
| Job CPU Time | 36.7 Seconds |
| DOI:10042/22819 | |
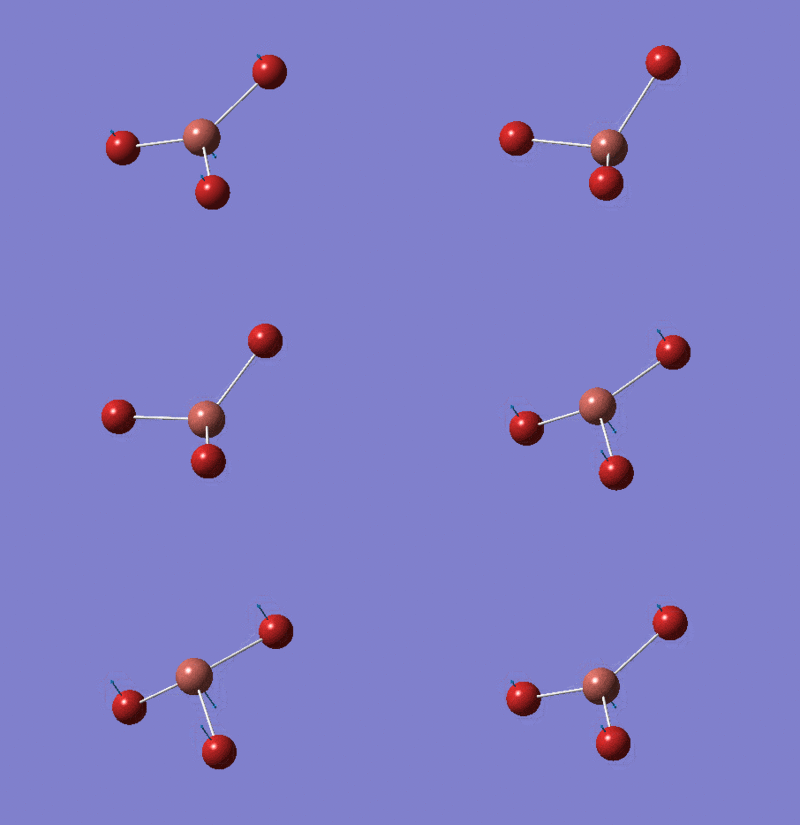
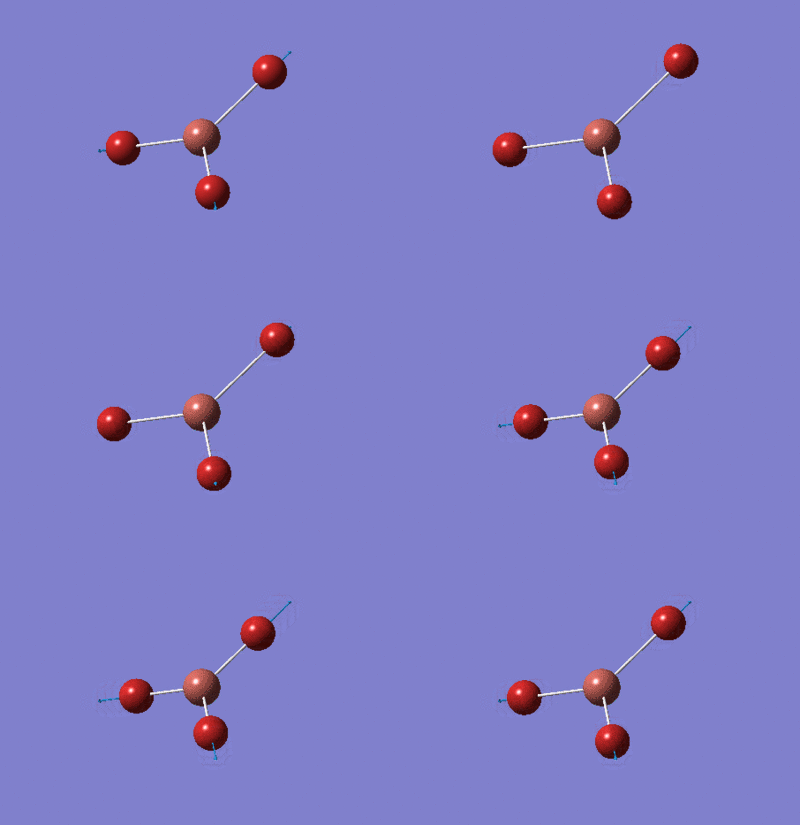
All of the low frequencies are within the range of ±15cm-1. Each frequency is also positive and much larger than the highest low frequency, which indicates that a minimum has been found in the analysis. The table below shows the values of the low frequencies. The simulated infrared graph shows 3 peaks due to one of the TlBr3 vibrational modes being IR inactive due to a totally symmetric stretch resulting in no change in dipole moment and four of the six being two degenerate pairs.
Infrared Spectrum of TlBr3

The simulated infrared graph shows 3 peaks (46.7, 51.95 and 210.75cm-1) because one of the TlBr3 vibrational modes is IR inactive due to a totally symmetric A'1 stretch resulting in no change in dipole moment. Four of the six modes are two degenerate pairs; similar to that of the borane infrared spectrum. Two of these peaks were observed in literature (60cm-1 and 215cm-1)[3]
Differences Between BH3 and TlBr3
One of the most striking differences are the values in stretching frequencies between similar symmetry labels and the ordering of these labels (table X). In TlBr3, two degenerate bending modes of E' symmetry are lowest in energy, 46.70cm-1 compared with borane's 1163.00cm-1 lowest energy A"2 mode. The A"2 symmetry vibrational mode in TlBr3 is much lower at 51.95cm-1. As Thallium and bromine are both large atoms, the reduced mass (μ) of the molecule will be relatively large compared with borane. The issue of comparatively weak overlap within TlBr3 discussed earlier also weakens the force constant (k) within the bond when the vibration is treated as a quantum harmonic oscillator. Using this model, the frequency of the vibrational mode can be calculated using the following equation[6]:
| Symmetry Label | BH3 (cm-1) | TlBr3 (cm-1) |
|---|---|---|
| A"2 | 1163.00 | 51.95 |
| E' | 1213.16 | 46.70 |
| A'1 | 2582.48 | 165.27 |
| E' | 2715.61 | 210.75 |
The reciprocal relationship between the vibrational stretching frequency and the reduced mass of the molecule is consistent with the findings from the simulated infrared spectrum. As the force constant increases (i.e. the bond gets stronger) the frequency of the vibrational mode also increases which is represented by the above equation.
It is also worth noting the differences in frequency between symmetry labels also. The lower energy vibrational modes (A"2 and the first set of degenerate E') are bending modes whereas the higher frequency A'1 and E' modes are stretches. This is the case because stretching affects the potential energy (and hence frequency) by altering internuclear distances in bonds (as figure 1 depicts) to a much larger extent than simply altering geometry through bending.
Population Analysis of BH3
Population analysis was carried out on optimised borane by adding the phrase "pop=full" to the calculation. The below diagram represents the results of the analysis in the form of a molecular orbital diagram. Linear combination of atomic orbitals and the simulated orbitals are shown together. A 6-31G(d,p) basis set was used and the analysis was published to D-space: DOI:10042/22820

NBO Analysis of NH3
An NBO analysis will now be carried out on a molecule of ammonia. Ammonia is a compound containing nitrogen and hydrogen and is a gas at room temperature. It has a characteristic pungent smell and is incredibly versatile amongst all disciplines of chemistry; being the building block of a huge range of pharmaceuticals.
Optimising a molecule of NH3
| NH3 Optimisation: 6-31G(d,p) Basis Set | ||
|---|---|---|

| ||
| Optimised H-N-H bond angles: 105.748°
Optimised N-H bond lengths: 1.01797Å | ||
| File Type | .log | |
| Calculation Type | FOPT | |
| Calculation Method | RB3LYP | |
| Basis Set | 6-31G(d,p) | |
| Charge | 0 | |
| E(RB3LYP) | -56.55776856 a.u. | |
| RMS Gradient | 0.00000885 a.u. | |
| Dipole Moment | 1.8464 Debye | |
| Point Group | C1 | |
| Job CPU Time | 42.0 Seconds | |
| link to .log file | ||
An NH3 molecule was drawn in Gaussview™ and an optimisation carried out directly with the relatively high basis set 6-31G(d,p) as it is a small, simple molecule. A B3LYP method was once again used and no symmetry was applied by using the "nosymm" phrase. Table summarises the results, including a picture of the optimised molecule along with the important optimised bond lengths and angles.
| Item Table for NH3 Optimisation Using a 6-31G(d,p) Basis Set |
|---|
        Item               Value     Threshold  Converged?
 Maximum Force            0.000024     0.000450     YES
 RMS     Force            0.000012     0.000300     YES
 Maximum Displacement     0.000079     0.001800     YES
 RMS     Displacement     0.000053     0.001200     YES
 Predicted change in Energy=-1.629728D-09
 Optimization completed.
    -- Stationary point found.
                           ----------------------------
                           !   Optimized Parameters   !
                           ! (Angstroms and Degrees)  !
 --------------------------                            --------------------------
 ! Name  Definition              Value          Derivative Info.                !
 --------------------------------------------------------------------------------
 ! R1    R(1,2)                  1.018          -DE/DX =    0.0                 !
 ! R2    R(1,3)                  1.018          -DE/DX =    0.0                 !
 ! R3    R(1,4)                  1.018          -DE/DX =    0.0                 !
 ! A1    A(2,1,3)              105.7413         -DE/DX =    0.0                 !
 ! A2    A(2,1,4)              105.7486         -DE/DX =    0.0                 !
 ! A3    A(3,1,4)              105.7479         -DE/DX =    0.0                 !
 ! D1    D(2,1,4,3)           -111.8631         -DE/DX =    0.0                 !
 --------------------------------------------------------------------------------
 GradGradGradGradGradGradGradGradGradGradGradGradGradGradGradGradGradGrad
|
The RMS gradient and derivatives in the tables above are both signs that there is convergence in the optimisation. The optimised bond length is consistent with equilibrium bond length in literature (1.08Å)[7]
Frequency Analysis of NH3
A frequency analysis was then run on the optimised ammonia molecule above. The same method and basis sets were used along with the phrase "int=grid=ultrafine". Table displays the result summary of the frequency analysis.
The item table below shows the low frequencies of the molecule, the first six of which are within the ±15cm-1 threshold. No negative frequencies were found, meaning the frequency analysis was a success in finding a minimum.
| File Type | .log |
| Calculation Type | FOPT |
| Calculation Method | RB3LYP |
| Basis Set | 6-31(d,p) |
| Charge | 0 |
| E(RB3LYP) | -56.55776872 a.u. |
| RMS Gradient Norm | 0.00000823 a.u. |
| Dipole Moment | 1.8464 Debye |
| Point Group | C1 |
| Job CPU Time | 33.0 Seconds |
| link to .log file | |
| Item Table for NH3 Frequency Analysis Using a 6-31G(d,p) Basis Set |
|---|
Low frequencies ---  -10.2450   -0.0017   -0.0009    0.0010    9.1073   14.6705
 Low frequencies --- 1089.3141 1693.9157 1693.9487
 Harmonic frequencies (cm**-1), IR intensities (KM/Mole), Raman scattering
 activities (A**4/AMU), depolarization ratios for plane and unpolarized
 incident light, reduced masses (AMU), force constants (mDyne/A),
 and normal coordinates:
                     1                      2                      3
                     A                      A                      A
 Frequencies --  1089.3141              1693.9157              1693.9487
 Red. masses --     1.1800                 1.0644                 1.0644
 Frc consts  --     0.8250                 1.7995                 1.7996
 IR Inten    --   145.4448                13.5608                13.5561
  Atom  AN      X      Y      Z        X      Y      Z        X      Y      Z
     1   7     0.12   0.00   0.00     0.00   0.05   0.04     0.00   0.04  -0.05
     2   1    -0.53  -0.21   0.00     0.21   0.12  -0.45     0.16   0.09   0.61
     3   1    -0.53   0.11   0.18    -0.24  -0.19   0.27     0.10  -0.63   0.30
     4   1    -0.53   0.11  -0.18     0.03  -0.66  -0.36    -0.26   0.00  -0.17
                     4                      5                      6
                     A                      A                      A
 Frequencies --  3461.2779              3589.7745              3589.9089
 Red. masses --     1.0272                 1.0883                 1.0883
 Frc consts  --     7.2509                 8.2633                 8.2639
 IR Inten    --     1.0589                 0.2691                 0.2699
  Atom  AN      X      Y      Z        X      Y      Z        X      Y      Z
     1   7    -0.04   0.00   0.00     0.00  -0.03   0.07     0.00   0.07   0.03
     2   1     0.18  -0.55   0.00    -0.12   0.30   0.02     0.28  -0.69   0.01
     3   1     0.18   0.27   0.47    -0.18  -0.24  -0.38    -0.25  -0.29  -0.53
     4   1     0.18   0.27  -0.48     0.31   0.38  -0.65    -0.03  -0.02   0.08
|
Population Analysis of NH3
A population analysis was run on ammonia so that the charge distribution of the molecule could be determined, along with molecular orbitals. The population calculation (6-31G(d,p) basis set, RB3LYP method) was uploaded onto D-space and can be accessed here: DOI:1042/22916

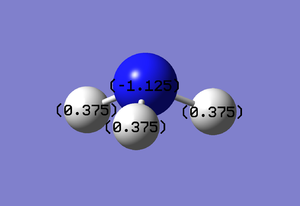

Figure 6 shows the molecular orbitals in order of increasing energy.
The NBO calculations show how charge is distributed within the molecule. In ammonia, the expectation is a formal negative charge based on the nitrogen atom and equal formal positive charges on all three hydrogen atoms. This is due to nitrogen being far more electronegative than hydrogen. Figures 7 and 8 confirm that this is the case in the optimised molecule, with a charge range of -1.0 to +1.0 used in the charge distribution analysis.
Analysis of NH3BH3
Optimising a molecule of NH3BH3
NH3BH3 was optimised using a 6-31G(d,p) basis set and B3LYP method. No symmetry was applied using the "nosymm" phrase. Table 21 presents the summary of the optimisation including key bond lengths and angles, along with an image of the optimised molecule.
| NH3BH3 Optimisation: 6-31G(d,p) Basis Set | ||
|---|---|---|

| ||
| Optimised H-B-H bond angles: 113.88°
Optimised H-N-H bond angles: 107.87° Optimised B-H bond lengths: 1.21004Å Optimised N-H bond lengths: 1.01859Å Optimised B-N bond length: 1.66814Å | ||
| File Type | .log | |
| Calculation Type | FOPT | |
| Calculation Method | RB3LYP | |
| Basis Set | 6-31G(d,p) | |
| Charge | 0 | |
| E(RB3LYP) | -83.22469032 a.u. | |
| RMS Gradient | 0.00005935 a.u. | |
| Dipole Moment | 5.5648 Debye | |
| Point Group | C1 | |
| Job CPU Time | 1 minute 29.0 seconds | |
| link to .log file | ||
| Item Table for NH3BH3 Optimisation Using a 6-31G(d,p) Basis Set |
|---|
        Item               Value     Threshold  Converged?
 Maximum Force            0.000121     0.000450     YES
 RMS     Force            0.000057     0.000300     YES
 Maximum Displacement     0.000508     0.001800     YES
 RMS     Displacement     0.000294     0.001200     YES
 Predicted change in Energy=-1.611643D-07
 Optimization completed.
    -- Stationary point found.
                           ----------------------------
                           !   Optimized Parameters   !
                           ! (Angstroms and Degrees)  !
 --------------------------                            --------------------------
 ! Name  Definition              Value          Derivative Info.                !
 --------------------------------------------------------------------------------
 ! R1    R(1,8)                  1.0186         -DE/DX =   -0.0001              !
 ! R2    R(2,8)                  1.0186         -DE/DX =   -0.0001              !
 ! R3    R(3,8)                  1.0186         -DE/DX =   -0.0001              !
 ! R4    R(4,7)                  1.21           -DE/DX =   -0.0001              !
 ! R5    R(5,7)                  1.21           -DE/DX =   -0.0001              !
 ! R6    R(6,7)                  1.21           -DE/DX =   -0.0001              !
 ! R7    R(7,8)                  1.6681         -DE/DX =   -0.0001              !
 ! A1    A(4,7,5)              113.8796         -DE/DX =    0.0                 !
 ! A2    A(4,7,6)              113.8796         -DE/DX =    0.0                 !
 ! A3    A(4,7,8)              104.5972         -DE/DX =    0.0                 !
 ! A4    A(5,7,6)              113.8728         -DE/DX =    0.0                 !
 ! A5    A(5,7,8)              104.591          -DE/DX =    0.0                 !
 ! A6    A(6,7,8)              104.591          -DE/DX =    0.0                 !
 ! A7    A(1,8,2)              107.873          -DE/DX =    0.0                 !
 ! A8    A(1,8,3)              107.873          -DE/DX =    0.0                 !
 ! A9    A(1,8,7)              111.0212         -DE/DX =    0.0                 !
 ! A10   A(2,8,3)              107.8692         -DE/DX =    0.0                 !
 ! A11   A(2,8,7)              111.0298         -DE/DX =    0.0                 !
 ! A12   A(3,8,7)              111.0297         -DE/DX =    0.0                 !
 ! D1    D(4,7,8,1)            179.9998         -DE/DX =    0.0                 !
 ! D2    D(4,7,8,2)            -60.0005         -DE/DX =    0.0                 !
 ! D3    D(4,7,8,3)             60.0001         -DE/DX =    0.0                 !
 ! D4    D(5,7,8,1)            -59.9967         -DE/DX =    0.0                 !
 ! D5    D(5,7,8,2)             60.003          -DE/DX =    0.0                 !
 ! D6    D(5,7,8,3)           -179.9964         -DE/DX =    0.0                 !
 ! D7    D(6,7,8,1)             59.9963         -DE/DX =    0.0                 !
 ! D8    D(6,7,8,2)            179.996          -DE/DX =    0.0                 !
 ! D9    D(6,7,8,3)            -60.0034         -DE/DX =    0.0                 !
 --------------------------------------------------------------------------------
 GradGradGradGradGradGradGradGradGradGradGradGradGradGradGradGradGradGrad
|
The Item table for the optimisation shows there was convergence in the calculation. This is confirmed by looking at the RMS gradient (0.00005935) which is much lower than the threshold 0.001 value.
The optimised H-B-H and H-N-H angles show that the configurations of the ammonia and borane substituents are only mildly affected by the association and that tetrahedral geometries at the N and B centres are not achieved. The optimised B-N bond length of 1.66814Å is in strong agreement with the literature gas-phase B-N length (1.672Å)[8]
Frequency Analysis of NH3BH3
A minimum structure was confirmed with frequency analysis. All the six lowest frequencies in the Item table below are within 15cm-1 and the main frequency modes are all positive (263,633,638, 638, 1069, 1069, 1196, 1204, 1204, 1329, 1676, 1676, 2472, 2532, 2532, 3464, 3581 and 3581cm-1)
| File Type | .log |
| Calculation Type | FOPT |
| Calculation Method | RB3LYP |
| Basis Set | 6-31(d,p) |
| Charge | 0 |
| E(RB3LYP) | -56.55776872 a.u. |
| RMS Gradient Norm | 0.00000823 a.u. |
| Dipole Moment | 1.8464 Debye |
| Point Group | C1 |
| Job CPU Time | 33.0 Seconds |
| link to .log file | |
| Item Table for NH3BH3 Frequency Analysis Using a 6-31G(d,p) Basis Set |
|---|
Low frequencies --- -3.6746 -3.0944 -0.0010 -0.0007 0.0005 3.4507 Low frequencies --- 263.3378 632.9595 638.4305 |
Energy Comparison: NH3BH3, BH3 and NH3
Optimisations have been carried out on NH3BH3, BH3 and NH3 using the 6-31G(d,p) basis set. This means that each of their energies can be directly compared.
The association energy of NH3BH3 is the difference in the calculated energy of NH3BH3, and the sum of the molecular components; BH3 and NH3.
E(NH3) = -56.55776856 a.u.
E(BH3) = -26.61532252 a.u.
E(NH3BH3)= -83.22469032 a.u.
ΔEassoc (NH3BH3) = E(NH3BH3) - [E(NH3) + E(BH3)] = -0.05159924 a.u.
As 1 a.u. = 2625.50 kJmol-1:
ΔEassoc (NH3BH3) = -135.5 kJmol-1
Bond association is exothermic and hence thermodynamically favoured. The +135.5 kJmol-1 needed to break this B-N bond is relatively a low amount of energy, indicating a weak bond, in direct agreenent with the long bond length of 1.66814A calculated from the optimisation relative to N-H and B-H lengths.
The energy of dissociation calculated here is in direct agreement with literature (+140 kJmol-1)[9]
Mini Project: Ionic Liquids and Designer Solvents
The structures of [N(CH3)4]+, [P(CH3)4]+ and [S(CH3)3]+ were optimised and a frequency, population and NBO calculation was performed on each molecule. The effects of altering the ligands were then investigated by optimisation, frequency and population analysis on [N(CH3)3CH2OH]+ and [N(CH3)3CH2CN]+. All calculations were performed on the HPC and published to D-Space.
[N(CH3)4]+
Optimisation
| [N(CH3)4]+ Optimisation: 6-31G(d,p) Basis Set | ||
|---|---|---|

| ||
| Optimised C-N-C bond angles: 109.455°
Optimised N-C-H bond angles: 108.878° Optimised H-C-H bond angles: 110.054° Optimised C-N bond length: 1.50936Å Optimised C-H bond lengths: 1.09026Å | ||
| File Type | .log | |
| Calculation Type | FOPT | |
| Calculation Method | RB3LYP | |
| Basis Set | 6-31G(d,p) | |
| Charge | 1 | |
| E(RB3LYP) | -214.18127259 a.u. | |
| RMS Gradient | 0.00004416 a.u. | |
| Dipole Moment | 4.4972 Debye | |
| Point Group | C1 | |
| Job CPU Time | 4 minutes 52.7 seconds | |
| DOI:10042/22889 | ||
An [N(CH3)4]+ molecule was drawn in Gaussview™ and an optimisation carried out directly with the relatively high basis set 6-31G(d,p). A B3LYP method was used and no symmetry was applied by using the "nosymm" phrase. Table 25 summarises the results, including a picture of the optimised molecule along with the important optimised bond lengths and angles.
| Item Table for [N(CH3)4]+ Optimisation Using a 6-31G(d,p) Basis Set |
|---|
         Item               Value     Threshold  Converged?
 Maximum Force            0.000068     0.000450     YES
 RMS     Force            0.000027     0.000300     YES
 Maximum Displacement     0.000189     0.001800     YES
 RMS     Displacement     0.000079     0.001200     YES
 Predicted change in Energy=-8.670963D-08
 Optimization completed.
    -- Stationary point found.
|
The RMS gradient is low and the Item table 26 shows a convergence in the calculation.
Frequency Analysis
The 6-31G(d,p) optimised molecule of [N(CH3)4]+ underwent frequency analysis. The same basis set and the same method must be applied here for the results to be meaningful, so the frequency analysis was done under a 6-31G(d,p) basis set and R3LYP method. The command "int=grid=ultrafine" was inputted as an additional keyword to reduce the noise by reducing the range of electron density. Table 27 summarises the frequency analysis on the optimised [N(CH3)4]+ molecule.
| Item Table for [N(CH3)4]+ Frequency Analysis Using a 6-31G(d,p) Basis Set |
|---|
Low frequencies --- -5.4773 -2.3150 -0.0003 -0.0002 0.0008 3.9487 Low frequencies --- 183.7597 288.3964 288.9007 |
The first six low frequencies are low and all the stronger frequencies are positive values, indicative of a minimum [N(CH3)4]+ structure.
| File Type | .log |
| Calculation Type | FOPT |
| Calculation Method | RB3LYP |
| Basis Set | 6-31(d,p) |
| Charge | 1 |
| E(RB3LYP) | -214.18127322 a.u. |
| RMS Gradient Norm | 0.00000104 a.u. |
| Dipole Moment | 4.4972 Debye |
| Point Group | C1 |
| Job CPU Time | 20 minutes 37.8 Seconds |
| DOI:10042/22921 | |
Population Analysis
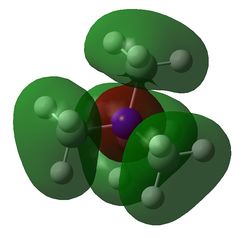
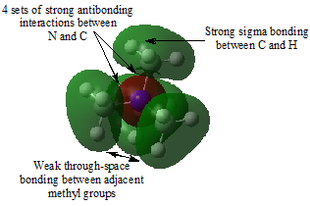
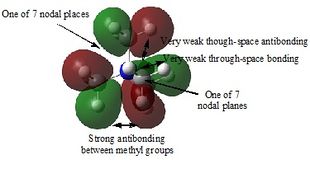
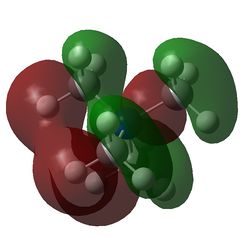
Population analysis was carried out on the optimised molecule of [N(CH3)4]+ and published to D-space:DOI:10042/22924
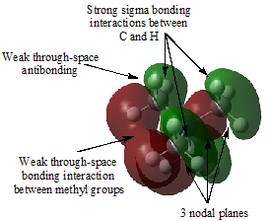
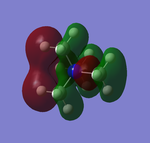
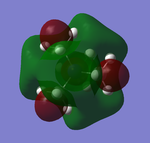
Table 29 shows five different molecular orbitals within the molecule. Some are bonding and others are antibonding. Molecular orbital 21 is the HOMO.
[P(CH3)4]+
Optimisation
| [P(CH3)4]+ Optimisation: 6-31G(d,p) Basis Set | ||
|---|---|---|

| ||
| Optimised C-P-C bond angles: 109.525°
Optimised P-C-H bond angles: 109.969° Optimised H-C-H bond angles: 109.009° Optimised C-P bond length: 1.81637Å Optimised C-H bond lengths: 1.09333Å | ||
| File Type | .log | |
| Calculation Type | FOPT | |
| Calculation Method | RB3LYP | |
| Basis Set | 6-31G(d,p) | |
| Charge | 1 | |
| E(RB3LYP) | -500.82700326 a.u. | |
| RMS Gradient | 0.00001657 a.u. | |
| Dipole Moment | 2.7342 Debye | |
| Point Group | C1 | |
| Job CPU Time | 4 minutes 42.2 seconds | |
| DOI:10042/22890 | ||
A [P(CH3)4]+ molecule was drawn in Gaussview™ and an optimisation carried out directly with the relatively high basis set 6-31G(d,p). A B3LYP method was used and no symmetry was applied by using the "nosymm" phrase. Table X summarises the results, including a picture of the optimised molecule along with the important optimised bond lengths and angles.
| Item Table for [P(CH3)4]+ Optimisation Using a 6-31G(d,p) Basis Set |
|---|
         Item               Value     Threshold  Converged?
 Maximum Force            0.000032     0.000450     YES
 RMS     Force            0.000012     0.000300     YES
 Maximum Displacement     0.001162     0.001800     YES
 RMS     Displacement     0.000296     0.001200     YES
 Predicted change in Energy=-4.016825D-08
 Optimization completed.
    -- Stationary point found.
|
The RMS gradient is low and the Item table above confirms a convergence.
Frequency Analysis
The 6-31G(d,p) optimised molecule of [P(CH3)4]+ underwent frequency analysis. The same basis set and the same method must be applied here for the results to be meaningful, so the frequency analysis was done under a 6-31G(d,p) basis set and R3LYP method. The command "int=grid=ultrafine" was inputted as an additional keyword to reduce the noise by reducing the range of electron density. Table Y summarises the frequency analysis on the optimised [P(CH3)4]+ molecule.
| Item Table for [P(CH3)4]+ Frequency Analysis Using a 6-31G(d,p) Basis Set |
|---|
Low frequencies --- -2.5763 -0.0011 0.0008 0.0021 5.2064 7.5840 Low frequencies --- 156.4501 192.0451 192.2812 |
The first six low frequences are low (between -15 and +15cm-1) and all the larger vibrational modes are positive. This indicates that the minimum structure for [P(CH3)4]+ was obtained.
| File Type | .log |
| Calculation Type | FOPT |
| Calculation Method | RB3LYP |
| Basis Set | 6-31(d,p) |
| Charge | 1 |
| E(RB3LYP) | -500.82701172 a.u. |
| RMS Gradient Norm | 0.00000050 a.u. |
| Dipole Moment | 2.7297 Debye |
| Point Group | C1 |
| Job CPU Time | 19 minutes 18.0 Seconds |
| DOI:10042/22922 | |
Population Analysis
A population analysis was carried out on an optimised structure of [S(CH3)3]+ and published to D-Space: DOI:22925 .
[S(CH3)3]+
Optimisation
| [S(CH3)3]+ Optimisation: 6-31G(d,p) Basis Set | ||
|---|---|---|
| ||
| Optimised C-S-C bond angles: 102.771°
Optimised S-C-H bond angles: 107.252° Optimised H-C-H bond angles: 111.104° Optimised C-S bond length: 1.82259Å Optimised C-H bond lengths: 1.09137Å | ||
| File Type | .log | |
| Calculation Type | FOPT | |
| Calculation Method | RB3LYP | |
| Basis Set | 6-31G(d,p) | |
| Charge | 1 | |
| E(RB3LYP) | -517.68320000 a.u. | |
| RMS Gradient | 0.00000972 a.u. | |
| Dipole Moment | 5.0148 Debye | |
| Point Group | C1 | |
| Job CPU Time | 1 minute 38.5 seconds | |
| DOI:10042/22891 | ||
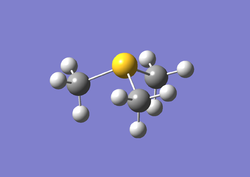
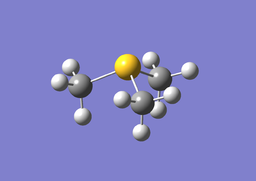
An [S(CH3)3]+ molecule was drawn in Gaussview™ and an optimisation carried out directly with the relatively high basis set 6-31G(d,p). A B3LYP method was used and no symmetry was applied by using the "nosymm" phrase. Table X summarises the results, including a picture of the optimised molecule along with the important optimised bond lengths and angles.
| Item Table for [S(CH3)3]+ Optimisation Using a 6-31G(d,p) Basis Set |
|---|
         Item               Value     Threshold  Converged?
 Maximum Force            0.000008     0.000450     YES
 RMS     Force            0.000003     0.000300     YES
 Maximum Displacement     0.001469     0.001800     YES
 RMS     Displacement     0.000469     0.001200     YES
 Predicted change in Energy=-1.033595D-08
 Optimization completed.
    -- Stationary point found.
|
Frequency Analysis
The 6-31G(d,p) optimised molecule of [S(CH3)3]+ underwent frequency analysis. The same basis set and the same method must be applied here for the results to be meaningful, so the frequency analysis was done under a 6-31G(d,p) basis set and R3LYP method. The command "int=grid=ultrafine" was inputted as an additional keyword to reduce the noise by reducing the range of electron density. Table Y summarises the frequency analysis on the optimised [P(CH3)4]+ molecule.
| Item Table for [S(CH3)3]+ Frequency Analysis Using a 6-31G(d,p) Basis Set |
|---|
Low frequencies --- -3.6594 0.0031 0.0040 0.0040 6.3687 14.5611 Low frequencies --- 162.4884 199.4433 200.7837 |
The first six low frequences are low (between -15 and +15cm-1) and all the larger vibrational modes are positive. This indicates that the minimum structure for [S(CH3)3]+ was obtained.
| File Type | .log |
| Calculation Type | FOPT |
| Calculation Method | RB3LYP |
| Basis Set | 6-31(d,p) |
| Charge | 1 |
| E(RB3LYP) | -517.68327635 a.u. |
| RMS Gradient Norm | 0.00000136 a.u. |
| Dipole Moment | 5.0151 Debye |
| Point Group | C1 |
| Job CPU Time | 9 minutes 16.7 Seconds |
| DOI:10042/22923 | |
Population Analysis
A population analysis was carried out on an optimised structure of [S(CH3)3]+ and published to D-Space: DOI:22926 .
Comparison
Structural Comparison
Table 38 summarises the results obtained from the optimisation calculations for the three molecules.
C-X-C Angles
We shall start by focusing on the central 'X' atom's geometry within each molecule. For both [N(CH3)4]+ and [P(CH3)4]+, the C-X-C angle is 109.5°, corresponding to a tetrahedral geometry. The H-C-H bonds in both molecules are also very close to this value so each atom within each of these molecules is part of a tetrahedral geometry. This is not surprising considering that each centre has eight bonding electrons surrounding it and so each bond wishes to be as far apart from the other bonds resulting in tetrahedral geometry. This also shows that steric effects from methyl groups do not intervene with the geometry of the [N(CH3)4]+ and [P(CH3)4]+ molecules. The [S(CH3)3]+ molecule has a C-X-C angle of 102.8°. By inspecting the image of the optimised molecule and considering this C-X-C value, the molecule is said to have a trigonal pyramidal structure, similar to that of ammonia. The sulphur atom has full valence, but only 3 bonding pairs (six electrons). A lone pair is present to achieve this full valence, taking up much more room around the molecule than a bonding pair of electrons. This reduces the angle of the three bonding methyl groups from the desired tetrahedral angle of 109.5° to 102.8°. Each carbon atom is considered to have near-tetrahedral geometry.
C-X Bond Lengths
The bond lengths for C-H bonds within all molecules are 1.09Å. This is not surprising because there is no opportunity for resonance forms or back bonding onto sp3 carbon. Nitrogen is found in group 15 in the second row of the periodic table. Phosphorous is one row down from nitrogen in the same group and sulphur is one group along from phosphorous in group 16. You would therefore expect the nitrogen-based molecule to have the smallest C-X bond length due to the smaller orbitals overlapping with carbon's atomic orbitals much more effectively than the diffuse orbitals of phosphorous and sulphur. This is in agreement with the computational results. In theory, sulphur-based molecule should have the largest C-X bond length due to the orbitals being larger than the phosphorous molecule's. The computational results found the bond lengths to be the same correct to two decimal places. If a more complex basis set was used then a difference between the two C-X lengths to two decimal places may be observed.
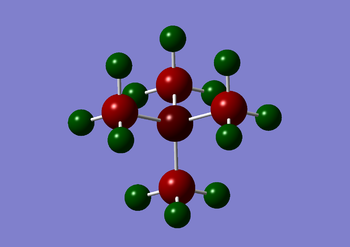
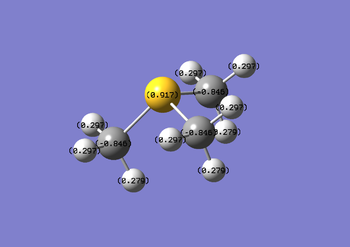
NBO Charges
The charge distributions were compared with one another over a colour range of -1.000 to +1.000. Table 39 shows the results of this analysis, along with the NBO charges assigned to each atom within each molecule.
| [N(CH3)4]+ | [P(CH3)4]+ | [S(CH3)3]+ |
|---|---|---|
 |
 |

|
 |
 |
|
| Atom | Electronegativity (χ) |
|---|---|
| N | 3.04 |
| S | 2.58 |
| C | 2.55 |
| H | 2.20 |
| P | 2.19 |
The differences in charge distribution can be explained by electronegativity. As an atom becomes more electronegative relative to another, the electron density within the bond is shifted towards the more electronegative atom. The greater the extent of electronegativity difference, the greater polarisation of the bond until an extreme is reached where the coloumbic forces between charged atoms dominates the bonding (ionic bonding). Table 40 shows the Pauli negativities for a range of atoms.
Nitrogen is the most electronegative atom compared with carbon, sulphur and phosphorous and so electron density is shifted towards it strongly from carbon resulting in a -0.295 NBO charge. P
Phosphorous is less electronegative than carbon and so the electron density within the P-C bond is shifted towards carbon. A +1.667 NBO charge is therefore assigned to the phosphorous atom.
Sulphur and carbon have similar electronegativities (sulphur being slightly larger) yet there is a significant charge distribution within the molecule. As sulphur is more electronegative than carbon, a slight negative charge placed on the sulphur atom from the three carbons is expected. This is not the case as the sulphur atom has a lone pair which repels electron density away from it, leaving the sulphur atom with a positive NBO charge of +0.917.
Heteroatom Contribution to the C-X Bond
The .log file from the population analysis can help us extract very useful information about the bonds within the cations. The percentage contribution between the two atoms forming a bond can be determined by analysing the "(Occupancy) Bond orbital/ Coefficients/ Hybrids" section of the file. An example is below:
| Cation | X Contribution (%) | C Contribution (%) |
|---|---|---|
| [N(CH3)4]+ | 66.35 | 33.65 |
| [P(CH3)4]+ | 40.43 | 59.57 |
| [S(CH3)3)]+ | 51.33 | 48.67 |
| C-S Heteroatom Bond Contribution in [S(CH3)3]+ |
|---|
     1. (1.98631) BD ( 1) S   1 - C   2
                ( 51.33%)   0.7164* S   1 s( 16.95%)p 4.86( 82.42%)d 0.04(  0.63%)
                                            0.0000  0.0001  0.4117 -0.0076  0.0012
                                            0.0000 -0.3441  0.0151  0.0000  0.7354
                                           -0.0324  0.0000  0.4038  0.0259 -0.0380
                                           -0.0263  0.0562 -0.0317 -0.0051
                ( 48.67%)   0.6976* C   2 s( 19.71%)p 4.07( 80.16%)d 0.01(  0.14%)
                                            0.0003  0.4437  0.0140 -0.0033  0.3467
                                           -0.0027 -0.7410  0.0058 -0.3635 -0.0098
                                           -0.0204 -0.0102  0.0218 -0.0170 -0.0096
|
The table represents an S-C bond in [S(CH3)3]+. 51.33% of the bonding is coming from S whilst 48.67% of the bonding is coming from C. For sulphur, the contribution is roughly 17% s-character and 83% p-character, whereas the carbon contribution is 20% s and 80% p. Using this analysis on all .log files, table B was set up, showing contributions to all C-X heteroatom bonds in the three cations under investigation. There is a direct link between high hetereoatom percentage contribution and low electronegativity, consistent with the NBO charge distribution analysis.
Charge Distribution in [NR4]+
In many pictures, the [NR4]+ cation is depicted with the formal positive charge based on the nitrogen atom, where R is an alkyl group. The "formal" positive charge represents the nitrogen lone pair donating electron density away from the nitrogen atom and onto another. Our NBO analysis on [NR4]+ (R=Me) showed that both nitrogen and the directly bonded carbon atoms both have negative NBO charges associated with them. Inductive effects therefore distribute the formal positive charges onto all hydrogen atoms connected to carbon in the alkyl chain.
Functional Group Effects
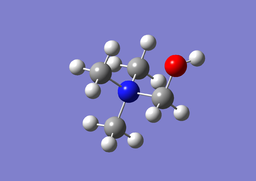
| [N(CH3)3(CH2OH)]+ Optimisation | ||
|---|---|---|
| ||
| Optimised C-N-C bond angles: 109.594°
Optimised H-C-N bond angles: 108.724° Optimised C-O-H bond angle: 111.424° Optimised N-C-O bond angle: 110.550° Optimised C-N1 bond lengths: 1.50377Å Optimised C-N2 bond length: 1.5528Å Optimised C-O bond length: 1.37361Å Optimised O-H bond length: 0.96677Å | ||
| File Type | .log | |
| Calculation Type | FOPT | |
| Calculation Method | RB3LYP | |
| Basis Set | 6-31G(d,p) | |
| Charge | 1 | |
| E(RB3LYP) | -289.39470078 a.u. | |
| RMS Gradient | 0.00000901 a.u. | |
| Dipole Moment | 6.9227 Debye | |
| Point Group | C1 | |
| Job CPU Time | 38 minutes 13.2 seconds | |
| DOI:10042/22937 | ||
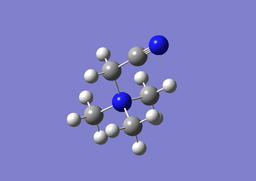
The effects of changing a functional group were analysed by adding both electron withdrawing and electron donating groups to the [N(CH3)3R]+ molecule. Comparison of the charge distributions of the two molecules were carried out and compared to the [N(CH3)4]+ cation from previous optimisations.
[N(CH3)3(CH2OH)]+
Optimisation
The molecule was optimised using a 6-31G(d,p) basis set and B3LYP method. The Item table below shows convergence in the optimisation, further confirmed by the low RMS gradient.
| Item Table for [N(CH3)3(CH2OH)]+ Optimisation Using a 6-31G(d,p) Basis Set |
|---|
         Item               Value     Threshold  Converged?
 Maximum Force            0.000014     0.000450     YES
 RMS     Force            0.000004     0.000300     YES
 Maximum Displacement     0.001449     0.001800     YES
 RMS     Displacement     0.000452     0.001200     YES
 Predicted change in Energy=-2.599295D-08
 Optimization completed.
    -- Stationary point found.
|
Frequency Analysis
Frequency analysis was performed to ensure the optimised structure was a minimum. The low frequencies table below shows that this is the case. All of the higher energetic vibrational modes were positive.
| Item Table for [N(CH3)3(CH2OH)]+ Frequency Analysis Using a 6-31G(d,p) Basis Set |
|---|
Low frequencies --- -10.0510 -1.5946 -0.0012 -0.0010 -0.0010 4.8565 Low frequencies --- 130.9961 213.8988 255.5318 |
| File Type | .log |
| Calculation Type | FOPT |
| Calculation Method | RB3LYP |
| Basis Set | 6-31(d,p) |
| Charge | 1 |
| E(RB3LYP) | -289.39470723 a.u. |
| RMS Gradient Norm | 0.0000080 a.u. |
| Dipole Moment | 6.9207 Debye |
| Point Group | C1 |
| Job CPU Time | 26 minutes 15.5 Seconds |
| DOI:10042/22942 | |
Population Analysis
Population analysis was performed and uploaded onto D-space: DOI:10042/22968
[N(CH3)3(CH2CN)]+
| [N(CH3)3(CH2CN)]+ Optimisation | ||
|---|---|---|
| ||
| Optimised C-N-C bond angles: 109.594°
Optimised H-C-N bond angles: 108.263° Optimised C-C≡N bond angle: 178.844° Optimised N-C-C bond angle: 111.751° Optimised C-N bond length: 1.51427Å Optimised C≡N bond length: 1.15962Å Optimised C-C bond length: 1.45992Å Optimised C-N bond length: 1.52577Å | ||
| File Type | .log | |
| Calculation Type | FOPT | |
| Calculation Method | RB3LYP | |
| Basis Set | 6-31G(d,p) | |
| Charge | 1 | |
| E(RB3LYP) | -306.39375724 a.u. | |
| RMS Gradient | 0.00008979 a.u. | |
| Dipole Moment | 11.7066 Debye | |
| Point Group | C1 | |
| Job CPU Time | 12 minutes 26.6 seconds | |
| DOI:10042/22941 | ||
Optimisation
The molecule was optimised using a 6-31G(d,p) basis set and B3LYP method. The Item table below shows convergence in the optimisation, further confirmed by the low RMS gradient.
| Item Table for [N(CH3)3(CH2OH)]+ Optimisation Using a 6-31G(d,p) Basis Set |
|---|
         Item               Value     Threshold  Converged?
 Maximum Force            0.000202     0.000450     YES
 RMS     Force            0.000043     0.000300     YES
 Maximum Displacement     0.001045     0.001800     YES
 RMS     Displacement     0.000284     0.001200     YES
 Predicted change in Energy=-3.112857D-07
 Optimization completed.
    -- Stationary point found.
|
Frequency Analysis
Frequency analysis was performed to ensure the optimised structure was a minimum. The low frequencies table below shows that this is the case. All of the higher energetic vibrational modes were positive.
| Item Table for [N(CH3)3(CH2CN)]+ Frequency Analysis Using a 6-31G(d,p) Basis Set |
|---|
Low frequencies --- -6.3669 -3.6911 -3.3354 -0.0005 0.0005 0.0013 Low frequencies --- 91.5842 153.8171 211.5424 |
| File Type | .log |
| Calculation Type | FOPT |
| Calculation Method | RB3LYP |
| Basis Set | 6-31(d,p) |
| Charge | 1 |
| E(RB3LYP) | -306.39375724 a.u. |
| RMS Gradient Norm | 0.0000050 a.u. |
| Dipole Moment | 11.7066 Debye |
| Point Group | C1 |
| Job CPU Time | 12 minutes 26.6 Seconds |
| DOI:10042/22948 | |
Population Analysis
Population analysis was performed and uploaded onto D-space: DOI:10042/22969
df
Comparison of [N(CH3)4]+, [N(CH3)3(CH2OH)]+ and [N(CH3)3(CH2CN)]+
NBO Charges
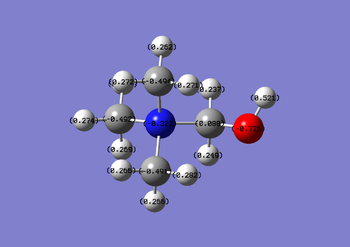
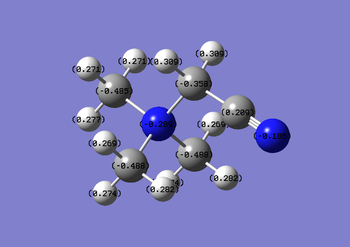
| [N(CH3)4]+ | [N(CH3)3(CH2OH)]+ | [N(CH3)3(CH2CN)]+ |
|---|---|---|
 |
 |

|
 |
 |
|
Nitrile groups are electron withdrawing, whereas hydroxyl groups are electron donating. It is expected that the inductive effects brought about by these groups will affect the charges of atoms nearby. Increased charge is found on the central N atoms for the OH functionalised cation, the extent of this charge gain is much greater than the extent of the charge loss in the CN functionalised cation (0.027 compared with 0.005). The NBO table spans a colour range of -1.000 to 1.000.
HOMO
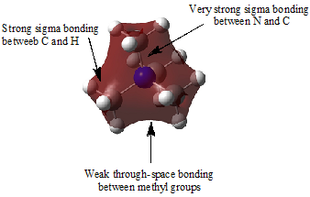
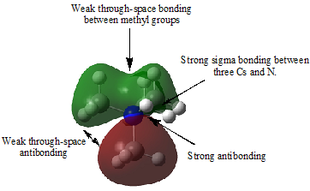
From the population analysis results for the three cations it is clear that the OH and CN functional groups both contribute strongly to the HOMO, with little contribution from nitrogen and some methyl groups. For [N(CH3)4]+, the HOMO is more delocalised over the whole molecule.
Energetically, the HOMOs for both functionalised cations are higher than that of the corresponding methylated cation due to changing atomic orbital energies resulting in a different degree of stabilisation/destabilisation of the molecular orbitals produced.
LUMO
From the population analysis for the three cations, it can be shown that all three LUMOs are delocalised over the whole molecule.
Energetically, the LUMO for [N(CH3)3(CH2OH)]+ is higher in energy relative to [N(CH3)4]+ whereas [N(CH3)3(CH2CN)]+ is higher. This is due to different degrees of bonding/antibonding interactions within the changed cations.
HOMO-LUMO Gap
For both functionalised cations, the HOMO-LUMO gap is smaller than that of [N(CH3)4]+, with [N(CH3)3(CH2CN)]+ being the lowest in energy. This would alter the reactivity of the cations. For example, the HOMO controls the energy of an electron loss (oxidation). The larger in energy the LUMO, the less likely reduction will take place. Higher energy HOMOs also correspond to reactive lewis bases, with lower energy LUMOs corresponding to highly reactive lewis acids (e.g. BH3).
References
- ↑ Atkins, Physical Chemistry, 9e, 2009
- ↑ Huebschle, Christian B.; Messerschmidt, Marc; Lentz, Dieter; Luger, Peter Zeitschrift fuer Anorganische und Allgemeine Chemie, 2004 , 630, p. 1313 - 1316
- ↑ 3.0 3.1 Blixt, Johan; Glaser, Julius; Mink, Janos; Persson, Ingmar; Persson, Per; Sandstroem, Magnus J. Am. Chem. Soc., vol. 117, 18, 1995 p. 5089 - 5104
- ↑ CRC Handbook of Chemistry and Physics, 93e, 2012, 9, p20
- ↑ S.H.Bauer; G. Herzberg; J.W.C. Johns, J. Mol. Spectrosc., 13, 1964, p256
- ↑ Ball, Physical Chemistry, 1e, 2003, p485
- ↑ J.F.Stanton; N.S.Kadagathur J. Chem. Phys. 102, 1995, p1096
- ↑ L. R. Thorne, R. D. Suenrum and F. J. Lovas, J. Chem. Phys., 78, 1983, p167
- ↑ Int. J. Hydrogen Energy, 34, 2009, pp2616-2621
- ↑ Shriver and Atkins, Inorganic Chemistry, 5e, 2010, p30

