Rep:Mod:dariomong01351899MO
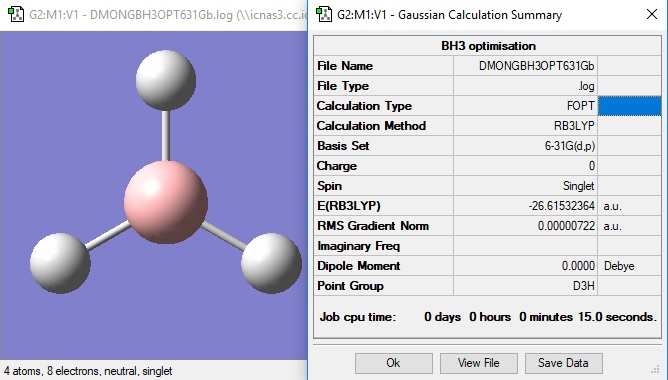
BH3 molecule
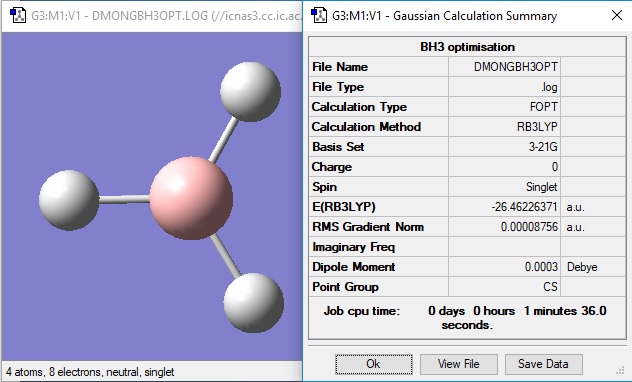
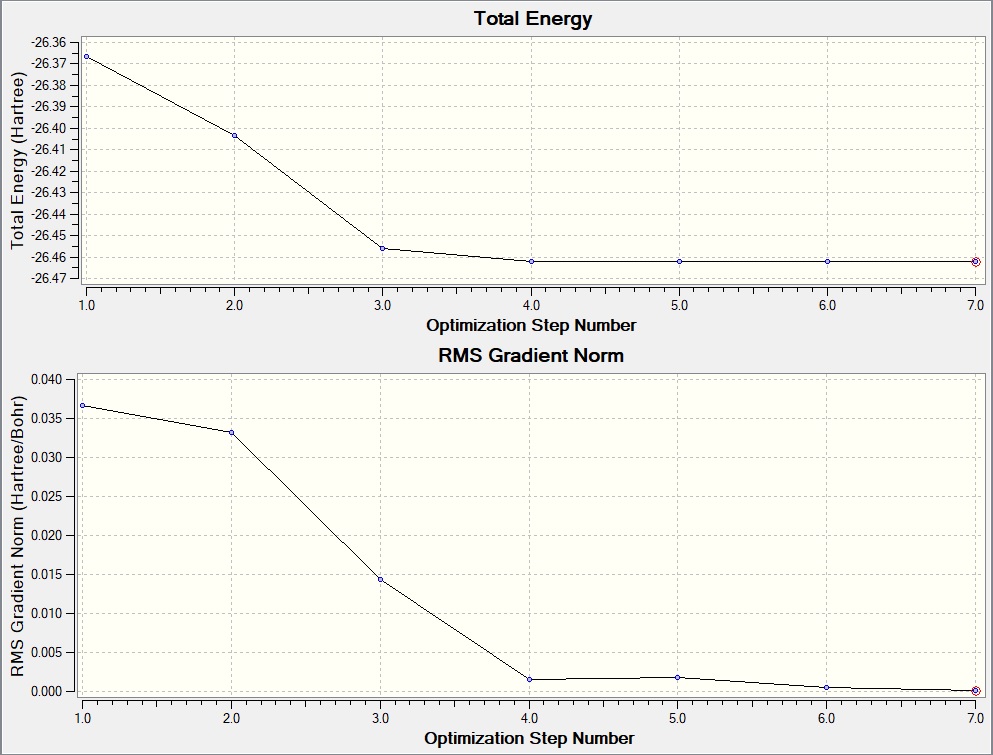
3-21G optimisation
Item               Value     Threshold  Converged?
Maximum Force            0.000217     0.000450     YES
RMS     Force            0.000105     0.000300     YES
Maximum Displacement     0.000900     0.001800     YES
RMS     Displacement     0.000441     0.001200     YES
Predicted change in Energy=-1.635268D-07
Optimization completed.
   -- Stationary point found.
The optimisation file is linked here.
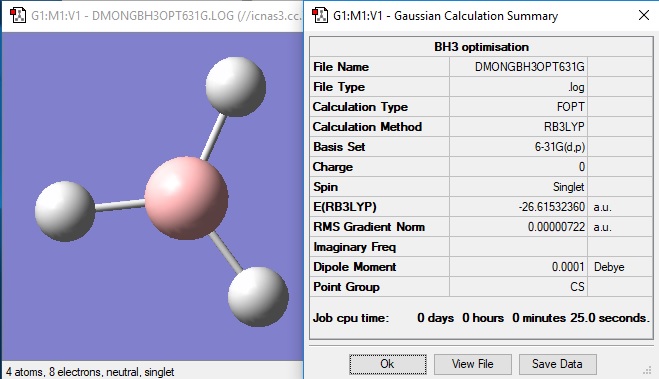
6-21G optimisation
        Item               Value     Threshold  Converged?
Maximum Force            0.000012     0.000450     YES
RMS     Force            0.000008     0.000300     YES
Maximum Displacement     0.000064     0.001800     YES
RMS     Displacement     0.000039     0.001200     YES
Predicted change in Energy=-1.128957D-09
Optimization completed.
   -- Stationary point found.
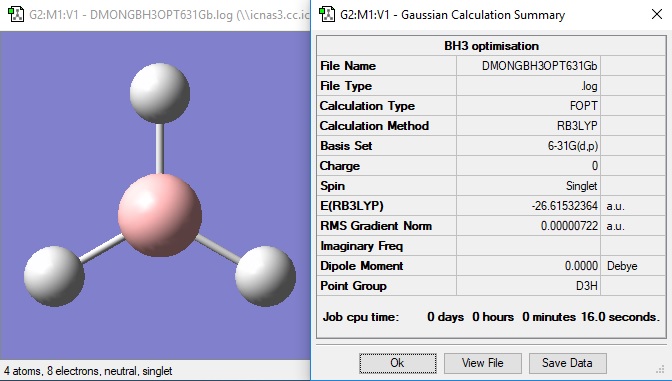
The molecule was then constrained to a D3h symmetry and then optimised again by 6-21G.
        Item               Value     Threshold  Converged?
Maximum Force            0.000014     0.000450     YES
RMS     Force            0.000009     0.000300     YES
Maximum Displacement     0.000057     0.001800     YES
RMS     Displacement     0.000037     0.001200     YES
Predicted change in Energy=-1.240669D-09
Optimization completed.
   -- Stationary point found.
In terms of presentation, while it’s good that you’ve documented the early stages of the lab they were for revision and in terms of content aren’t relevant to the report, it would have been better to at least see some comment/discussion around them saying why these calculations were done to make them relevant. Smf115 (talk) 18:42, 31 May 2019 (BST)
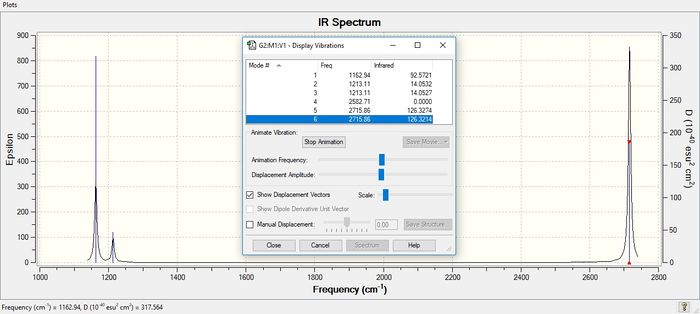
Frequency analysis of BH3
Low frequencies ---  -15.9849  -15.9818  -12.7207    0.0007    0.0143    0.3137
Low frequencies --- 1162.9365 1213.1134 1213.1136
Diagonal vibrational polarizability:
       0.7178921       0.7178603       1.8420487
Harmonic frequencies (cm**-1), IR intensities (KM/Mole), Raman scattering
activities (A**4/AMU), depolarization ratios for plane and unpolarized
incident light, reduced masses (AMU), force constants (mDyne/A),
and normal coordinates:
                     1                      2                      3
                    A2"                    E'                     E'
Frequencies --   1162.9365              1213.1134              1213.1136
Red. masses --      1.2531                 1.1072                 1.1072
Frc consts  --      0.9985                 0.9600                 0.9600
IR Inten    --     92.5721                14.0532                14.0527
 Atom  AN      X      Y      Z        X      Y      Z        X      Y      Z
    1   5     0.00   0.00   0.16    -0.10   0.00   0.00     0.00   0.10   0.00
    2   1     0.00   0.00  -0.57     0.81   0.00   0.00     0.00   0.08   0.00
    3   1     0.00   0.00  -0.57     0.14  -0.39   0.00     0.39  -0.59   0.00
    4   1     0.00   0.00  -0.57     0.14   0.39   0.00    -0.39  -0.59   0.00
                     4                      5                      6
                    A1'                    E'                     E'
Frequencies --   2582.7141              2715.8636              2715.8645
Red. masses --      1.0078                 1.1273                 1.1273
Frc consts  --      3.9608                 4.8992                 4.8992
IR Inten    --      0.0000               126.3274               126.3214
 Atom  AN      X      Y      Z        X      Y      Z        X      Y      Z
    1   5     0.00   0.00   0.00     0.11   0.00   0.00     0.00   0.11   0.00
    2   1     0.00   0.58   0.00     0.02   0.00   0.00     0.00  -0.81   0.00
    3   1    -0.50  -0.29   0.00    -0.60  -0.36   0.00    -0.36  -0.19   0.00
    4   1     0.50  -0.29   0.00    -0.60   0.36   0.00     0.36  -0.19   0.00
The optimised molecule can be found here
Jmol of optimised BH3 molecule
test molecule |
| Vibrational frequency (cm-1) | Intensity (dimensionless) | Symmetry | IR Active | Type ! |
|---|---|---|---|---|
| 1163 | 93 | A2" | Yes | symmetric bend (wagging) |
| 1213 | 14 | E' | Yes | antisymmetric bend (rocking) |
| 1213 | 14 | E' | Yes | symmetric bend (scissoring) |
| 2583 | 0 | A1' | No | symmetric stretch |
| 2716 | 126 | E' | Yes | antisymmetric stretch |
| 2716 | 126 | E' | Yes | antisymmetric stretch |
Despite showing 6 vibrational modes, only 3 appear in the actual spectrum. There are two sets of degenerate vibrational modes at 1213cm-1 and 2716cm-1 respectively, which only appear in the spectrum as one peak respectively.In addition to this, the vibration at 2583cm-1 is not IR active as its vibrational mode does not incur a change in dipole moment as each H atom stretches out from the central B atom in a symmetrical fashion, as seen below.
Good explanation of why only three peaks are visible. To improve, it would have been better to picture the IR spectrum without the window in the middle of it. Smf115 (talk) 18:42, 31 May 2019 (BST)
Molecular Orbital diagram of BH3
 T.Hunt, 2018,Figure 5,Problem class 1: the MO diagram of BH3,
Molecular Orbitals in Inorganic Chemistry, Imperial College London, delivered November 2018.
There are no significant differences between the computed MOs and the LCAO derived MOs. For the most part LCAO is a reliable model for showing the MOs of a molecule, however there are certain aspects it fails to capture, such as the overlap of orbitals from the same fragment (see a1'). Electronic distribution is key to understanding reactivity of molecules, which is why LCAO is good for MO diagrams but less effective for more complex cases.
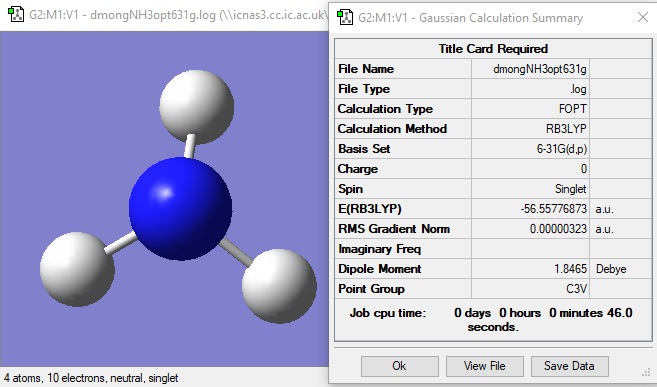
NH3 molecule
        Item               Value     Threshold  Converged?
Maximum Force            0.000006     0.000450     YES
RMS     Force            0.000004     0.000300     YES
Maximum Displacement     0.000012     0.001800     YES
RMS     Displacement     0.000008     0.001200     YES
Predicted change in Energy=-9.843977D-11
Optimization completed.
   -- Stationary point found.
                          ----------------------------
                          !   Optimized Parameters   !
                          ! (Angstroms and Degrees)  !
--------------------------                            --------------------------
! Name  Definition              Value          Derivative Info.                !
--------------------------------------------------------------------------------
! R1    R(1,2)                  1.018          -DE/DX =    0.0                 !
! R2    R(1,3)                  1.018          -DE/DX =    0.0                 !
! R3    R(1,4)                  1.018          -DE/DX =    0.0                 !
! A1    A(2,1,3)              105.7446         -DE/DX =    0.0                 !
! A2    A(2,1,4)              105.7446         -DE/DX =    0.0                 !
! A3    A(3,1,4)              105.7446         -DE/DX =    0.0                 !
! D1    D(2,1,4,3)           -111.8637         -DE/DX =    0.0                 !
Low frequencies ---   -0.0137   -0.0027    0.0007    7.0783    8.0932    8.0937
Low frequencies --- 1089.3840 1693.9368 1693.9368
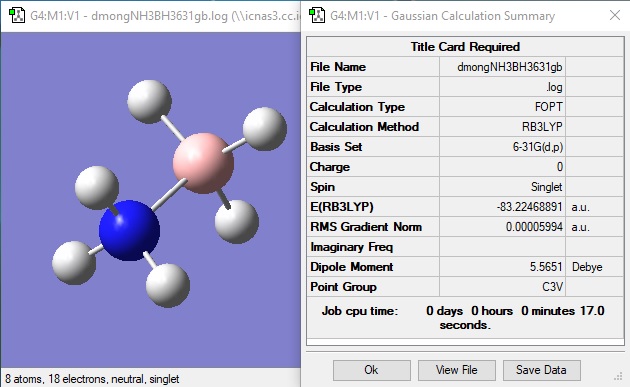
NH3BH3
        Item               Value     Threshold  Converged?
Maximum Force            0.000122     0.000450     YES
RMS     Force            0.000058     0.000300     YES
Maximum Displacement     0.000531     0.001800     YES
RMS     Displacement     0.000296     0.001200     YES
Predicted change in Energy=-1.656419D-07
Optimization completed.
   -- Stationary point found.
                          ----------------------------
                          !   Optimized Parameters   !
                          ! (Angstroms and Degrees)  !
--------------------------                            --------------------------
! Name  Definition              Value          Derivative Info.                !
--------------------------------------------------------------------------------
! R1    R(1,8)                  1.0186         -DE/DX =   -0.0001              !
! R2    R(2,8)                  1.0186         -DE/DX =   -0.0001              !
! R3    R(3,8)                  1.0186         -DE/DX =   -0.0001              !
! R4    R(4,7)                  1.21           -DE/DX =   -0.0001              !
! R5    R(5,7)                  1.21           -DE/DX =   -0.0001              !
! R6    R(6,7)                  1.21           -DE/DX =   -0.0001              !
! R7    R(7,8)                  1.6681         -DE/DX =   -0.0001              !
! A1    A(4,7,5)              113.8746         -DE/DX =    0.0                 !
! A2    A(4,7,6)              113.8746         -DE/DX =    0.0                 !
! A3    A(4,7,8)              104.5965         -DE/DX =    0.0                 !
! A4    A(5,7,6)              113.8746         -DE/DX =    0.0                 !
! A5    A(5,7,8)              104.5965         -DE/DX =    0.0                 !
! A6    A(6,7,8)              104.5965         -DE/DX =    0.0                 !
! A7    A(1,8,2)              107.8683         -DE/DX =    0.0                 !
! A8    A(1,8,3)              107.8683         -DE/DX =    0.0                 !
! A9    A(1,8,7)              111.0301         -DE/DX =    0.0                 !
! A10   A(2,8,3)              107.8683         -DE/DX =    0.0                 !
! A11   A(2,8,7)              111.0301         -DE/DX =    0.0                 !
! A12   A(3,8,7)              111.0301         -DE/DX =    0.0                 !
! D1    D(4,7,8,1)            180.0            -DE/DX =    0.0                 !
! D2    D(4,7,8,2)            -60.0            -DE/DX =    0.0                 !
! D3    D(4,7,8,3)             60.0            -DE/DX =    0.0                 !
! D4    D(5,7,8,1)            -60.0            -DE/DX =    0.0                 !
! D5    D(5,7,8,2)             60.0            -DE/DX =    0.0                 !
! D6    D(5,7,8,3)            180.0            -DE/DX =    0.0                 !
! D7    D(6,7,8,1)             60.0            -DE/DX =    0.0                 !
! D8    D(6,7,8,2)            180.0            -DE/DX =    0.0                 !
! D9    D(6,7,8,3)            -60.0            -DE/DX =    0.0                 !
Low frequencies ---   -0.0251   -0.0029    0.0014   17.1170   17.1195   37.1145
Low frequencies ---  265.7734  632.2034  639.3448
NH3BH3 bond energy
| Molecule | Energy (atomic units) |
|---|---|
| NH3 | -56.56 |
| BH3 | -26.62 |
| NH3BH3 | -83.22 |
(error associated with energy is 5 kjmol-1, which corresponds to 0.002 au, so calculations are given to 2dp)
ΔE=E(NH3BH3)-[E(NH3)+E(BH3)]
 =-83.22-(-56.56-26.62)
 =-83.22 + 83.18
 =-0.04 au
 =-105.02 kjmol-1
A value of -105.02 kjmol-1 indicates an exothermic process as the overall energy change is negative, meaning that the process gives products which are more thermodynamically stable than the reactants. Comparing to a C-C bond in ethane which has an energy of formation of 346 kjmol-1, and the C-N bond in methylamine which has an energy of formation of 360 kjmol-1, we can ascertain that the dative covalent bond formed is quite weak relative to commonplace bonds in chemistry.
You have the right energies for your calculations, however, full energy values should be used for calculations as truncating them too early has resulted in an incorrect result. Only the final energy value should be the one rounded to the appropriate degree of accuracy (nearest 1 for kJmol-1 and 5 d.p. for a.u.). Also, note that any literature values should be referenced! Smf115 (talk) 18:43, 31 May 2019 (BST)
NI3 molecule
The optimised molecule can be found here
Jmol
NI3 |
Low frequencies ---  -12.3845  -12.3781   -5.6129   -0.0040    0.0194    0.0711
Low frequencies ---  100.9307  100.9314  147.2332
        Item               Value     Threshold  Converged?
Maximum Force            0.000102     0.000450     YES
RMS     Force            0.000075     0.000300     YES
Maximum Displacement     0.000858     0.001800     YES
RMS     Displacement     0.000630     0.001200     YES
Predicted change in Energy=-1.193062D-07
Optimization completed.
   -- Stationary point found.
                          ----------------------------
                          !   Optimized Parameters   !
                          ! (Angstroms and Degrees)  !
--------------------------                            --------------------------
! Name  Definition              Value          Derivative Info.                !
--------------------------------------------------------------------------------
! R1    R(1,2)                  2.1842         -DE/DX =   -0.0001              !
! R2    R(1,3)                  2.1842         -DE/DX =   -0.0001              !
! R3    R(1,4)                  2.1842         -DE/DX =   -0.0001              !
! A1    A(2,1,3)              110.8579         -DE/DX =    0.0                 !
! A2    A(2,1,4)              110.8579         -DE/DX =   -0.0001              !
! A3    A(3,1,4)              110.8579         -DE/DX =   -0.0001              !
! D1    D(2,1,4,3)           -123.5674         -DE/DX =    0.0001              !
N-I bond lengthː 2.184 angstroms
Good implementation of the pseudo potential! Your calculations throughout are ok but you are missing the frequency log files and jmols for NH3 and BH3NH3, the summary tables should have also been from the frequency calculations. Smf115 (talk) 18:45, 31 May 2019 (BST)
Mini-project: Metal Carbonyls
In this mini-project I will be comparing the vibrational frequencies and bond lengths in three metal carbonyl complexesː [Ti(CO)6]2-, [V(CO)6]- and [Cr(CO)6]. I will run optimisations on each of the structures and determine the bond lengths, and then will run frequency analysis on each of these optimised structures to give the vibrational frequencies.
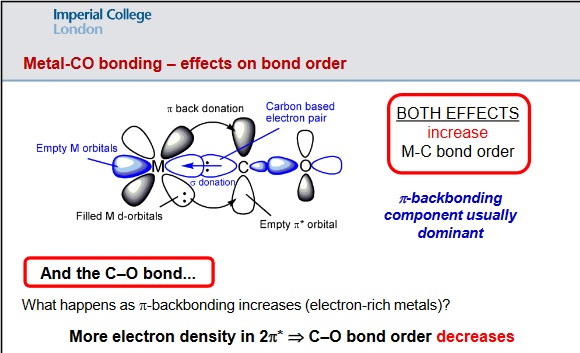
The strength of the C=O is related to the extent of backbonding from the metal to the pi* star orbital of C=O - "increased electron density in the 2pi* orbital of the C=O molecule leads to a lower C-O bond order (and hence longer & weaker bond)" - see diagram below.
N.Long, 2019, Lecture 5: Transition Metal Carbonyls - structure, bonding and reactivity, Transition Metal, Coordination and Organometallic Chemistry, Imperial College London, delivered May 2019.
Theory allows for prediction of the extent of backbonding, which will then be compared to the vibrational frequencies given from frequency analysis - the stretching frequencies of the C=O bond can be correlated to the bond strength, as given by the equation w = h/2pi x (kf/meff)^0.5, which shows that the fundamental frequency w is directly proportional to the spring constant kf which is effectively the bond strength. My prediction of which complex has the highest vibrational frequencies for C=O will be compared to the actual values from the frequency analysis and analysed for any discrepancies.
As shown above, theory predicts that the increased backbonding will incur a decrease in bond order of the C=O bond, and hence a longer bond. My prediction of which complex has the longest C=O bond will be compared to the actual bond lengths from the optimised molecule.
Predictions
The complexes I will be analysing are very similiar - they are all isoelectronic with d6 occupancy of the metal, have identical ligands (carbonyl - strong field) and are all low spin complexes with 18 electrons total. This means the only parameter which is different across the three is the charge on the metal, which since we're using neutral ligands is simply its oxidation state.
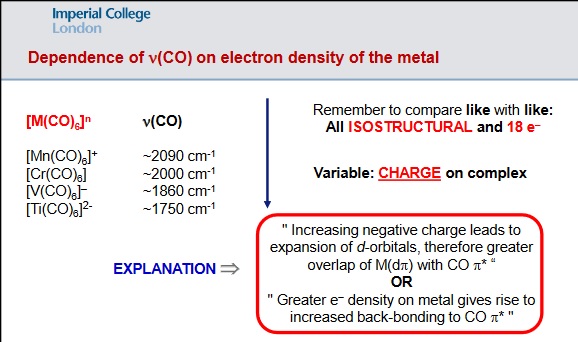
Theory provides a relationship between charge on a metal and the extent of backbonding; "Increasing negative charge leads to the expansion of d-orbitals, therefore greater overlap of M(dpi) with CO pi* / increased backbonding" - see diagram below.
N.Long, 2019, Lecture 5: Transition Metal Carbonyls - structure, bonding and reactivity, Transition Metal, Coordination and Organometallic Chemistry, Imperial College London, delivered May 2019.
In the three complexes I will be analysing ([Ti(CO)6]2-, [V(CO)6]- and [Cr(CO)6]), the charges are as follows: Ti(2-), V(-1) and Cr(0). Given the order of magnitude of charge being Ti > V > Cr, and the theory stated previously, the predictions for vibrational frequencies and bond lengths are as follows:
Vibrational frequencies: Cr > V > Ti Bond length of C=O: Ti > V > Cr
Each of the following optimisations were performed using Method: B3LYP, Basis Set: 6-31G (d,p) for C and O, and LanL2DZ was used for the metal orbitals.
[Ti(CO)6]2- analysis
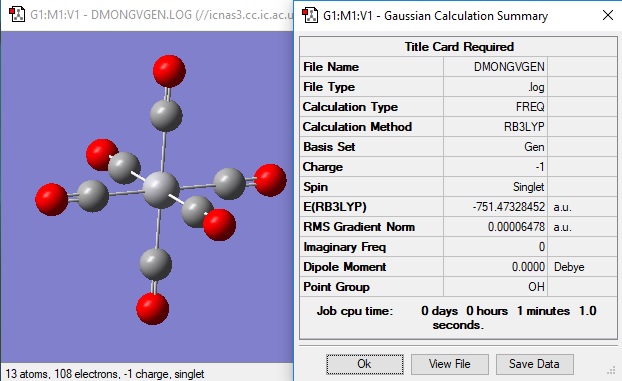
The molecule was first optimised and then frequency analysis was performed.
The link to the frequency file can be found here.
Low frequencies ---   -0.0010   -0.0004    0.0002   13.1492   13.1492   13.1492
Low frequencies ---   29.8870   29.8870   29.8870
        Item               Value     Threshold  Converged?
Maximum Force            0.000247     0.000450     YES
RMS     Force            0.000086     0.000300     YES
Maximum Displacement     0.000128     0.001800     YES
RMS     Displacement     0.000061     0.001200     YES
Predicted change in Energy=-1.882613D-07
Optimization completed.
   -- Stationary point found.
                          ----------------------------
                          !   Optimized Parameters   !
                          ! (Angstroms and Degrees)  !
--------------------------                            --------------------------
! Name  Definition              Value          Derivative Info.                !
--------------------------------------------------------------------------------
! R1    R(1,2)                  1.1833         -DE/DX =    0.0002              !
! R2    R(1,13)                 2.0467         -DE/DX =    0.0                 !
! R3    R(3,4)                  1.1833         -DE/DX =    0.0002              !
! R4    R(3,13)                 2.0467         -DE/DX =    0.0                 !
! R5    R(5,6)                  1.1833         -DE/DX =    0.0002              !
! R6    R(5,13)                 2.0467         -DE/DX =    0.0                 !
! R7    R(7,8)                  1.1833         -DE/DX =    0.0002              !
! R8    R(7,13)                 2.0467         -DE/DX =    0.0                 !
! R9    R(9,10)                 1.1833         -DE/DX =    0.0002              !
! R10   R(9,13)                 2.0467         -DE/DX =    0.0                 !
! R11   R(11,12)                1.1833         -DE/DX =    0.0002              !
! R12   R(11,13)                2.0467         -DE/DX =    0.0                 !
! A1    A(1,13,3)              90.0            -DE/DX =    0.0                 !
! A2    A(1,13,7)              90.0            -DE/DX =    0.0                 !
! A3    A(1,13,9)              90.0            -DE/DX =    0.0                 !
! A4    A(1,13,11)             90.0            -DE/DX =    0.0                 !
! A5    A(3,13,5)              90.0            -DE/DX =    0.0                 !
! A6    A(3,13,7)              90.0            -DE/DX =    0.0                 !
! A7    A(3,13,9)              90.0            -DE/DX =    0.0                 !
! A8    A(5,13,7)              90.0            -DE/DX =    0.0                 !
! A9    A(5,13,9)              90.0            -DE/DX =    0.0                 !
! A10   A(5,13,11)             90.0            -DE/DX =    0.0                 !
! A11   A(7,13,11)             90.0            -DE/DX =    0.0                 !
! A12   A(9,13,11)             90.0            -DE/DX =    0.0                 !
! A13   L(2,1,13,4,-1)        180.0            -DE/DX =    0.0                 !
! A14   L(4,3,13,2,-1)        180.0            -DE/DX =    0.0                 !
! A15   L(6,5,13,4,-1)        180.0            -DE/DX =    0.0                 !
! A16   L(8,7,13,2,-1)        180.0            -DE/DX =    0.0                 !
! A17   L(10,9,13,2,-1)       180.0            -DE/DX =    0.0                 !
! A18   L(12,11,13,2,-1)      180.0            -DE/DX =    0.0                 !
! A19   L(1,13,5,3,-1)        180.0            -DE/DX =    0.0                 !
! A20   L(3,13,11,1,-1)       180.0            -DE/DX =    0.0                 !
! A21   L(7,13,9,1,-1)        180.0            -DE/DX =    0.0                 !
! A22   L(2,1,13,4,-2)        180.0            -DE/DX =    0.0                 !
! A23   L(4,3,13,2,-2)        180.0            -DE/DX =    0.0                 !
! A24   L(6,5,13,4,-2)        180.0            -DE/DX =    0.0                 !
! A25   L(8,7,13,2,-2)        180.0            -DE/DX =    0.0                 !
! A26   L(10,9,13,2,-2)       180.0            -DE/DX =    0.0                 !
! A27   L(12,11,13,2,-2)      180.0            -DE/DX =    0.0                 !
! A28   L(1,13,5,3,-2)        180.0            -DE/DX =    0.0                 !
! A29   L(3,13,11,1,-2)       180.0            -DE/DX =    0.0                 !
! A30   L(7,13,9,1,-2)        180.0            -DE/DX =    0.0                 !
! D1    D(1,13,7,3)            90.0            -DE/DX =    0.0                 !
! D2    D(1,13,9,3)           -90.0            -DE/DX =    0.0                 !
! D3    D(1,13,11,7)           90.0            -DE/DX =    0.0                 !
! D4    D(1,13,11,9)          -90.0            -DE/DX =    0.0                 !
! D5    D(3,13,7,5)            90.0            -DE/DX =    0.0                 !
! D6    D(3,13,9,5)           -90.0            -DE/DX =    0.0                 !
! D7    D(5,13,11,7)          -90.0            -DE/DX =    0.0                 !
! D8    D(5,13,11,9)           90.0            -DE/DX =    0.0                 !
Bond length
The bond length for the C=O bond in this complex was found to be 1.183 angstroms.
Vibrational Analysis
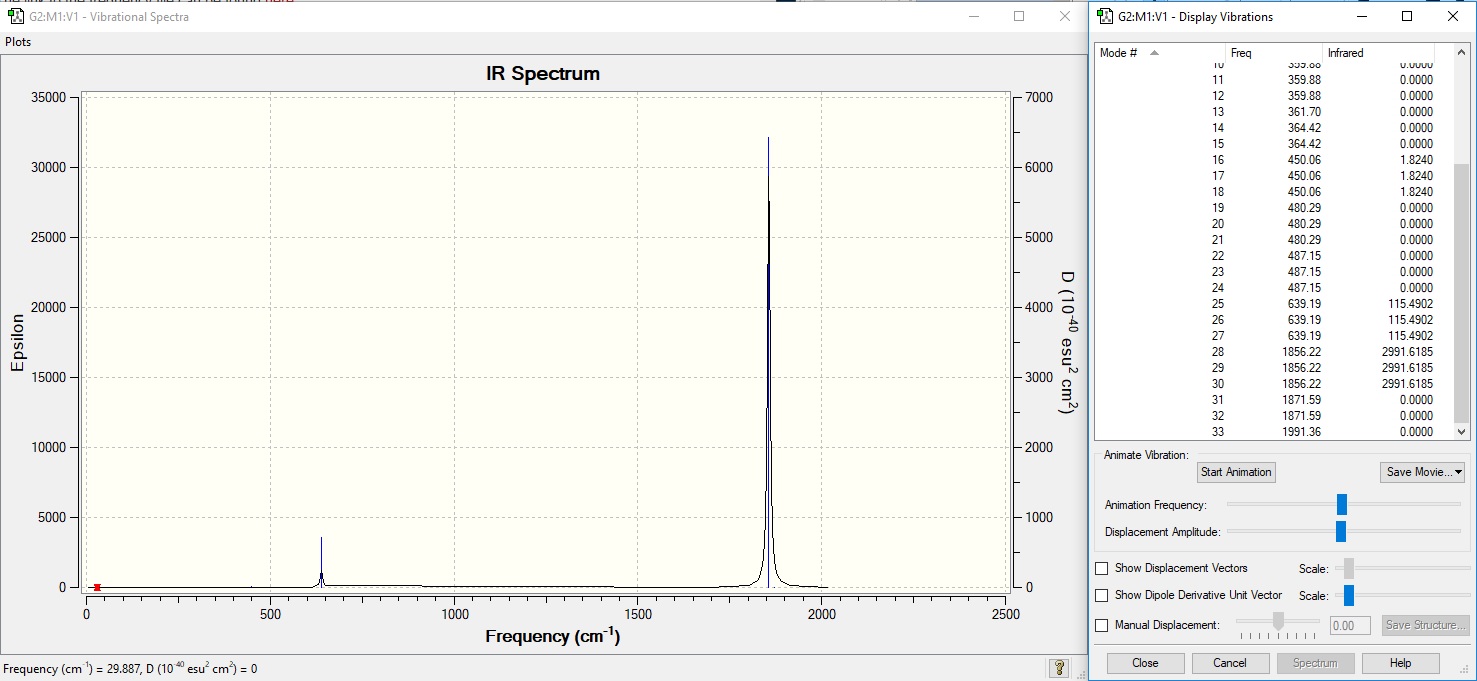
Here we can see two distinct peaks in the IR spectrum despite there being 33 unique vibrational modes. The vast majority of these peaks do not have a large enough intensity to be visible in IR. The two peaks lie at 639cm-1 and 1856cm-1. The peak at 639cm-1 represents the bending modes of the IR spectrum - there are 3 degenerate modes which have equal intensity and incur a change in dipole moment. At 1856cm-1 there is a peak for stretching mode of the molecule, which has three degenerate modes of equal intensity. This indicates the extent of pi backbonding as discussed previously and will be compared against the other molecules.
[V(CO)6]- analysis
After optimisation, frequency analysis was performed. A link to the molecule can be found here.
Low frequencies ---    0.0006    0.0006    0.0011   14.1311   14.1311   14.1311
Low frequencies ---   52.8916   52.8916   52.8916
        Item               Value     Threshold  Converged?
Maximum Force            0.000198     0.000450     YES
RMS     Force            0.000070     0.000300     YES
Maximum Displacement     0.001210     0.001800     YES
RMS     Displacement     0.000591     0.001200     YES
Predicted change in Energy=-7.154807D-07
Optimization completed.
   -- Stationary point found.
                          ----------------------------
                          !   Optimized Parameters   !
                          ! (Angstroms and Degrees)  !
--------------------------                            --------------------------
! Name  Definition              Value          Derivative Info.                !
--------------------------------------------------------------------------------
! R1    R(1,2)                  1.9542         -DE/DX =   -0.0002              !
! R2    R(1,4)                  1.9542         -DE/DX =   -0.0002              !
! R3    R(1,6)                  1.9542         -DE/DX =   -0.0002              !
! R4    R(1,8)                  1.9542         -DE/DX =   -0.0002              !
! R5    R(1,10)                 1.9542         -DE/DX =   -0.0002              !
! R6    R(1,12)                 1.9542         -DE/DX =   -0.0002              !
! R7    R(2,3)                  1.166          -DE/DX =    0.0                 !
! R8    R(4,5)                  1.166          -DE/DX =    0.0                 !
! R9    R(6,7)                  1.166          -DE/DX =    0.0                 !
! R10   R(8,9)                  1.166          -DE/DX =    0.0                 !
! R11   R(10,11)                1.166          -DE/DX =    0.0                 !
! R12   R(12,13)                1.166          -DE/DX =    0.0                 !
! A1    A(2,1,4)               90.0            -DE/DX =    0.0                 !
! A2    A(2,1,8)               90.0            -DE/DX =    0.0                 !
! A3    A(2,1,10)              90.0            -DE/DX =    0.0                 !
! A4    A(2,1,12)              90.0            -DE/DX =    0.0                 !
! A5    A(4,1,6)               90.0            -DE/DX =    0.0                 !
! A6    A(4,1,8)               90.0            -DE/DX =    0.0                 !
! A7    A(4,1,10)              90.0            -DE/DX =    0.0                 !
! A8    A(6,1,8)               90.0            -DE/DX =    0.0                 !
! A9    A(6,1,10)              90.0            -DE/DX =    0.0                 !
! A10   A(6,1,12)              90.0            -DE/DX =    0.0                 !
! A11   A(8,1,12)              90.0            -DE/DX =    0.0                 !
! A12   A(10,1,12)             90.0            -DE/DX =    0.0                 !
! A13   L(2,1,6,4,-1)         180.0            -DE/DX =    0.0                 !
! A14   L(4,1,12,2,-1)        180.0            -DE/DX =    0.0                 !
! A15   L(8,1,10,2,-1)        180.0            -DE/DX =    0.0                 !
! A16   L(1,2,3,5,-1)         180.0            -DE/DX =    0.0                 !
! A17   L(1,4,5,3,-1)         180.0            -DE/DX =    0.0                 !
! A18   L(1,6,7,5,-1)         180.0            -DE/DX =    0.0                 !
! A19   L(1,8,9,3,-1)         180.0            -DE/DX =    0.0                 !
! A20   L(1,10,11,3,-1)       180.0            -DE/DX =    0.0                 !
! A21   L(1,12,13,3,-1)       180.0            -DE/DX =    0.0                 !
! A22   L(2,1,6,4,-2)         180.0            -DE/DX =    0.0                 !
! A23   L(4,1,12,2,-2)        180.0            -DE/DX =    0.0                 !
! A24   L(8,1,10,2,-2)        180.0            -DE/DX =    0.0                 !
! A25   L(1,2,3,5,-2)         180.0            -DE/DX =    0.0                 !
! A26   L(1,4,5,3,-2)         180.0            -DE/DX =    0.0                 !
! A27   L(1,6,7,5,-2)         180.0            -DE/DX =    0.0                 !
! A28   L(1,8,9,3,-2)         180.0            -DE/DX =    0.0                 !
! A29   L(1,10,11,3,-2)       180.0            -DE/DX =    0.0                 !
! A30   L(1,12,13,3,-2)       180.0            -DE/DX =    0.0                 !
! D1    D(2,1,8,4)             90.0            -DE/DX =    0.0                 !
! D2    D(2,1,10,4)           -90.0            -DE/DX =    0.0                 !
! D3    D(2,1,12,8)            90.0            -DE/DX =    0.0                 !
! D4    D(2,1,12,10)          -90.0            -DE/DX =    0.0                 !
! D5    D(4,1,8,6)             90.0            -DE/DX =    0.0                 !
! D6    D(4,1,10,6)           -90.0            -DE/DX =    0.0                 !
! D7    D(6,1,12,8)           -90.0            -DE/DX =    0.0                 !
! D8    D(6,1,12,10)           90.0            -DE/DX =    0.0                 !
Bond length
The C=O bond length in this complex was found to be 1.166angstroms.
Vibrational Analysis
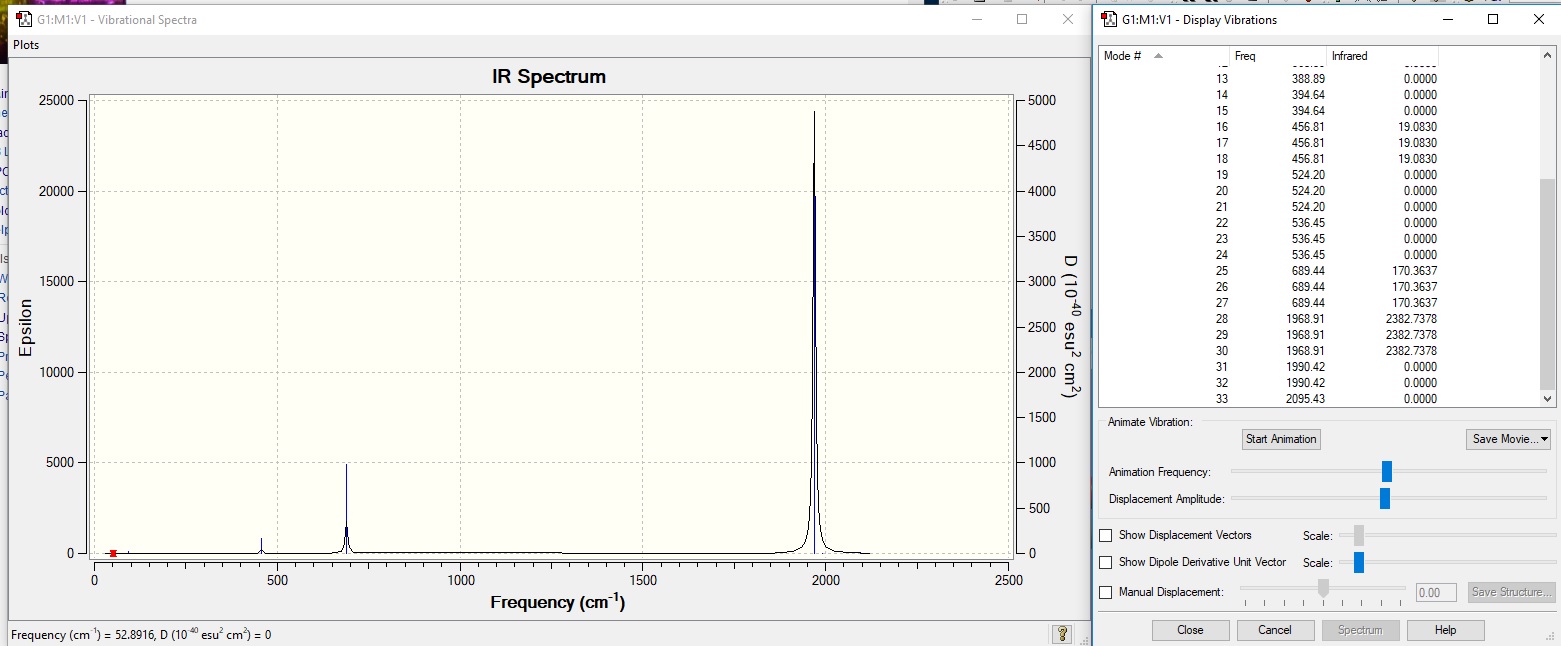
There are 2 distinct peaks in the IR spcetrum, similarly to the Ti complex. The larger peak is at 1969cm-1, and represents the C=O stretching mode. The lesser peak is at 689cm-1, and represents the bending mode of the complex. The other modes present are not intense enough to be visible on an IR spectrum.
[Cr(CO)6] analysis
After optimisation, frequency analysis was performed. A link to the molecule can be found here.
Low frequencies ---   -0.0012   -0.0011   -0.0011   10.3820   10.3820   10.3820
Low frequencies ---   66.4094   66.4094   66.4094
        Item               Value     Threshold  Converged?
Maximum Force            0.000154     0.000450     YES
RMS     Force            0.000055     0.000300     YES
Maximum Displacement     0.000386     0.001800     YES
RMS     Displacement     0.000162     0.001200     YES
Predicted change in Energy=-9.123831D-08
Optimization completed.
   -- Stationary point found.
                          ----------------------------
                          !   Optimized Parameters   !
                          ! (Angstroms and Degrees)  !
--------------------------                            --------------------------
! Name  Definition              Value          Derivative Info.                !
--------------------------------------------------------------------------------
! R1    R(1,2)                  1.1494         -DE/DX =    0.0002              !
! R2    R(1,13)                 1.9149         -DE/DX =    0.0                 !
! R3    R(3,4)                  1.1494         -DE/DX =    0.0002              !
! R4    R(3,13)                 1.9149         -DE/DX =    0.0                 !
! R5    R(5,6)                  1.1494         -DE/DX =    0.0002              !
! R6    R(5,13)                 1.9149         -DE/DX =    0.0                 !
! R7    R(7,8)                  1.1494         -DE/DX =    0.0002              !
! R8    R(7,13)                 1.9149         -DE/DX =    0.0                 !
! R9    R(9,10)                 1.1494         -DE/DX =    0.0002              !
! R10   R(9,13)                 1.9149         -DE/DX =    0.0                 !
! R11   R(11,12)                1.1494         -DE/DX =    0.0002              !
! R12   R(11,13)                1.9149         -DE/DX =    0.0                 !
! A1    A(1,13,3)              90.0            -DE/DX =    0.0                 !
! A2    A(1,13,7)              90.0            -DE/DX =    0.0                 !
! A3    A(1,13,9)              90.0            -DE/DX =    0.0                 !
! A4    A(1,13,11)             90.0            -DE/DX =    0.0                 !
! A5    A(3,13,5)              90.0            -DE/DX =    0.0                 !
! A6    A(3,13,7)              90.0            -DE/DX =    0.0                 !
! A7    A(3,13,9)              90.0            -DE/DX =    0.0                 !
! A8    A(5,13,7)              90.0            -DE/DX =    0.0                 !
! A9    A(5,13,9)              90.0            -DE/DX =    0.0                 !
! A10   A(5,13,11)             90.0            -DE/DX =    0.0                 !
! A11   A(7,13,11)             90.0            -DE/DX =    0.0                 !
! A12   A(9,13,11)             90.0            -DE/DX =    0.0                 !
! A13   L(2,1,13,4,-1)        180.0            -DE/DX =    0.0                 !
! A14   L(4,3,13,2,-1)        180.0            -DE/DX =    0.0                 !
! A15   L(6,5,13,4,-1)        180.0            -DE/DX =    0.0                 !
! A16   L(8,7,13,2,-1)        180.0            -DE/DX =    0.0                 !
! A17   L(10,9,13,2,-1)       180.0            -DE/DX =    0.0                 !
! A18   L(12,11,13,2,-1)      180.0            -DE/DX =    0.0                 !
! A19   L(1,13,5,3,-1)        180.0            -DE/DX =    0.0                 !
! A20   L(3,13,11,1,-1)       180.0            -DE/DX =    0.0                 !
! A21   L(7,13,9,1,-1)        180.0            -DE/DX =    0.0                 !
! A22   L(2,1,13,4,-2)        180.0            -DE/DX =    0.0                 !
! A23   L(4,3,13,2,-2)        180.0            -DE/DX =    0.0                 !
! A24   L(6,5,13,4,-2)        180.0            -DE/DX =    0.0                 !
! A25   L(8,7,13,2,-2)        180.0            -DE/DX =    0.0                 !
! A26   L(10,9,13,2,-2)       180.0            -DE/DX =    0.0                 !
! A27   L(12,11,13,2,-2)      180.0            -DE/DX =    0.0                 !
! A28   L(1,13,5,3,-2)        180.0            -DE/DX =    0.0                 !
! A29   L(3,13,11,1,-2)       180.0            -DE/DX =    0.0                 !
! A30   L(7,13,9,1,-2)        180.0            -DE/DX =    0.0                 !
! D1    D(1,13,7,3)            90.0            -DE/DX =    0.0                 !
! D2    D(1,13,9,3)           -90.0            -DE/DX =    0.0                 !
! D3    D(1,13,11,7)           90.0            -DE/DX =    0.0                 !
! D4    D(1,13,11,9)          -90.0            -DE/DX =    0.0                 !
! D5    D(3,13,7,5)            90.0            -DE/DX =    0.0                 !
! D6    D(3,13,9,5)           -90.0            -DE/DX =    0.0                 !
! D7    D(5,13,11,7)          -90.0            -DE/DX =    0.0                 !
! D8    D(5,13,11,9)           90.0            -DE/DX =    0.0                 !
Bond length
The bond length for C=O in this complex was found to be 1.149 angstroms.
Vibrational Analysis
There are three distinct peaks in this IR spectrum, the most intense of which at 2087cm-1, which represents the stretching mode of the C=O bond. The two lesser peaks at 692cm-1 and 430cm-1 both represent bending modes of the molecule and are far less intense.
MO analysis
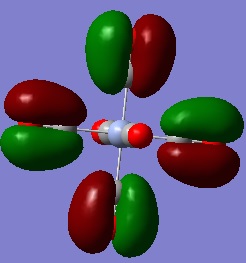
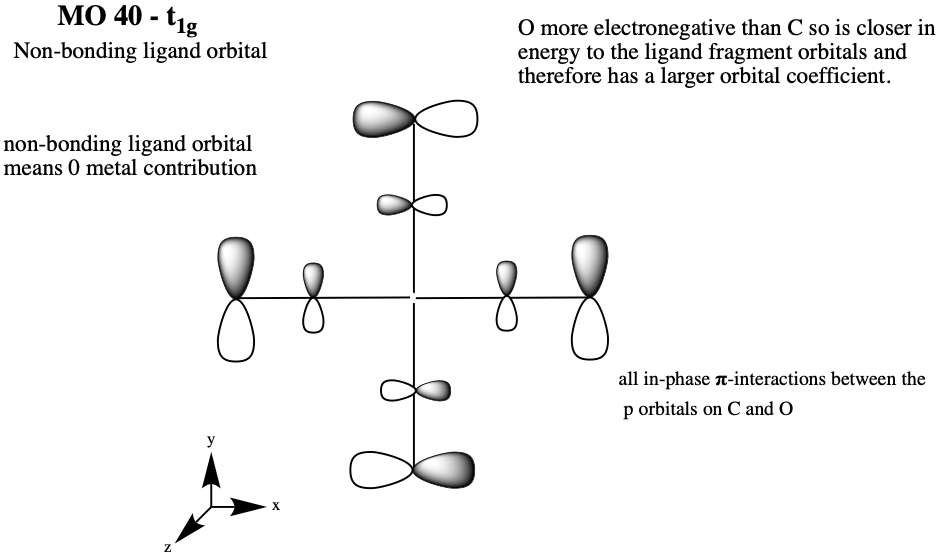
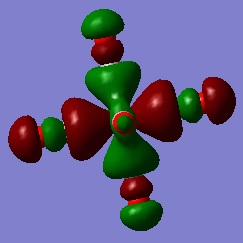
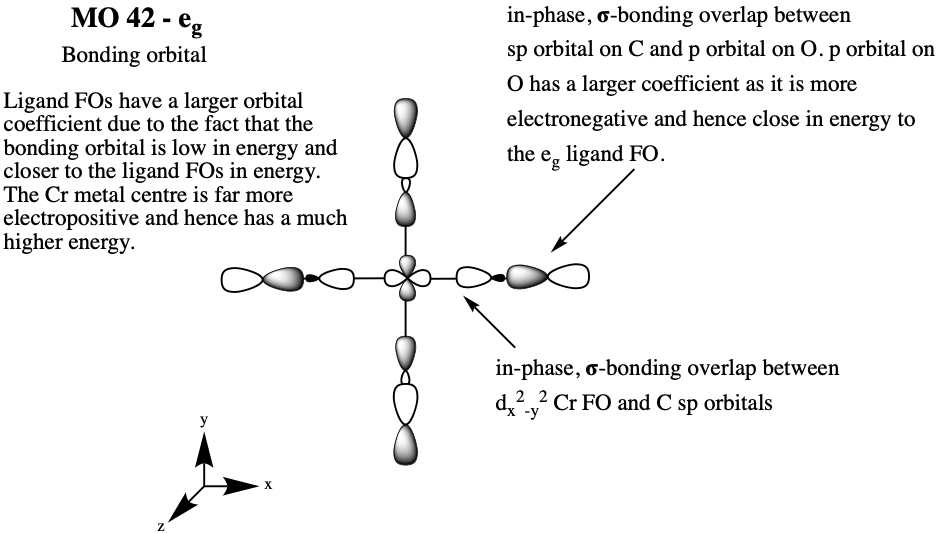
Good MO analysis, you've identified the main interactions and constructed the LCAOs well. To improve, further details such as the nodal planes and the dengeneracy of the orbitals could have been considered. Also note, your axes on your LCAO diagrams don't actually correspond to the view which you are representing. Smf115 (talk) 13:21, 31 May 2019 (BST)
Comparing the predictions for bond length and vibrational frequency to the computed values
| Metal carbonyl complex | Vibrational frequency (cm-1) | Intensity (dimensionless) | CO bond length (angstroms) ! |
|---|---|---|---|
| [Ti(CO)6]2- | 1856 | 2992 | 1.183 |
| [V(CO)6]- | 1969 | 2383 | 1.166 |
| [Cr(CO)6] | 2087 | 1637 | 1.149 |
Based on this, we can conclude that the findings from the optimised molecules match the predictions made at the beginning of this investigation; Vibrational frequencies: Cr > V > Ti Bond length of C=O: Ti > V > Cr. This shows that the theory of the effect of pi-backbonding on the vibrational frequency and bond lengths are accurate according to these optimisations.
Very good predictions at the start and you have clearly (and correctly!) explained them using the background theory. The data you've calculated is correct and to improve, you could have considered the presentation a bit more. For example, plotting the data against the oxidation state of the metal would have helped visualise it, the IR spectra could have been positioned by your final presented data and the large table of optimised parameters aren't necessary and don't add anything to the discussion. Smf115 (talk) 12:49, 31 May 2019 (BST)
Overall a decent report which was let down largely by poor presentation, to improve, consider how your structrure your information and only include what is relevant. Smf115 (talk) 18:48, 31 May 2019 (BST)

