
Rep:Mod:cw2
Inorganic Computational Experiment
Using computational analysis is a significant tool for predicting the properties of molecules, their spectra, and how they behave during chemical reactions. This investigation shows how molecules are modelled on a computer, manipulated and how this can be applied to Lewis acid-base adducts.
Optimisation of BH3

A molecule of BH3 was created using the software GaussView, specifying trigonal planar geometry, an image is shown to the right. The structure was distorted, in order to break the symmetry, by elongating each of the B-H bonds to one of 1.53, 1.54 or 1.55 Å bond lengths. BH3 was then optimised according to the calculation type and method, and basis set, shown in Table 1. The 3-21G basis set used is a rudimentary one, hence the calculation was quick but with a lower degree of accuracy.
| File Type | .log |
| Calculation Type | FOPT |
| Calculation Method | RB3LYP |
| Basis Set | 3-21G |
| Energy (a.u.) | -26.4626429 |
| Gradient (a.u.) | 0.00008851 |
| Dipole Moment (Debye) | 0.00 |
| Point Group | Cs |
| Calculation Time (s) | 27 |
The optimised molecule had bond length 1.19 Å for the distances B-2H, B-3H and B-4H, they differed in further decimal places but the calculation is not accurate to this degree (see picture, all of the molecules discussed in the first section have the same orientation of atoms, labelled in the same order). Bond angles were measured at 120.0° for ∠2-1-3, ∠3-1-4 and ∠4-1-2. We would expect these all to be identical in an optimised molecule, and they are close enough. Below is conformation that the stationary point has been found (that the molecule is indeed optimised to its equilibrium structure), with all the forces and placements converged. The output file from the Gaussian calculation can be found here
 Item               Value     Threshold  Converged?
 Maximum Force            0.000220     0.000450     YES
 RMS     Force            0.000106     0.000300     YES
 Maximum Displacement     0.000919     0.001800     YES
 RMS     Displacement     0.000447     0.001200     YES
 Predicted change in Energy=-1.672479D-07
 Optimization completed.
    -- Stationary point found.
                           ----------------------------
                           !   Optimized Parameters   !
                           ! (Angstroms and Degrees)  !
 --------------------------                            --------------------------
 ! Name  Definition              Value          Derivative Info.                !
 --------------------------------------------------------------------------------
 ! R1    R(1,2)                  1.1944         -DE/DX =   -0.0001              !
 ! R2    R(1,3)                  1.1947         -DE/DX =   -0.0002              !
 ! R3    R(1,4)                  1.1948         -DE/DX =   -0.0002              !
 ! A1    A(2,1,3)              119.9983         -DE/DX =    0.0                 !
 ! A2    A(2,1,4)              119.986          -DE/DX =    0.0                 !
 ! A3    A(3,1,4)              120.0157         -DE/DX =    0.0                 !
 ! D1    D(2,1,4,3)            180.0            -DE/DX =    0.0                 !
 --------------------------------------------------------------------------------
 GradGradGradGradGradGradGradGradGradGradGradGradGradGradGradGradGradGrad
Using a better basis set
| File Type | .log |
| Calculation Type | FOPT |
| Calculation Method | RB3LYP |
| Basis Set | 6-31G(d,p) |
| Energy (a.u.) | -26.61532358 |
| Gradient (a.u.) | 0.00008206 |
| Dipole Moment (Debye) | 0.00 |
| Point Group | Cs |
| Calculation Time (s) | 16 |
The calculation was re-run using a more advanced basis set for the orbitals, 6-31G(d,p), resulting in a better approximation of the bond lengths and angles. Unfortunately, the energy and other input information, shown in Table 2 cannot be compared to the previous experiment due to the differing basis sets. The output file can be viewed here. The bond lengths have all decreased slightly with the new optimisation - 1.19 Å for B-2H, B-3H and B-4H, and the disparity between them in further decimal paces has shrunk making all the bond lengths marginally more uniform. A similar effect is seen for the bond angles; 120.0°.
 Item               Value     Threshold  Converged?
 Maximum Force            0.000204     0.000450     YES
 RMS     Force            0.000099     0.000300     YES
 Maximum Displacement     0.000875     0.001800     YES
 RMS     Displacement     0.000418     0.001200     YES
 Predicted change in Energy=-1.452109D-07
 Optimization completed.
    -- Stationary point found.
                           ----------------------------
                           !   Optimized Parameters   !
                           ! (Angstroms and Degrees)  !
 --------------------------                            --------------------------
 ! Name  Definition              Value          Derivative Info.                !
 --------------------------------------------------------------------------------
 ! R1    R(1,2)                  1.1924         -DE/DX =    0.0                 !
 ! R2    R(1,3)                  1.1926         -DE/DX =   -0.0002              !
 ! R3    R(1,4)                  1.1928         -DE/DX =   -0.0002              !
 ! A1    A(2,1,3)              119.9988         -DE/DX =    0.0                 !
 ! A2    A(2,1,4)              119.9866         -DE/DX =    0.0                 !
 ! A3    A(3,1,4)              120.0146         -DE/DX =    0.0                 !
 ! D1    D(2,1,4,3)            180.0            -DE/DX =    0.0                 !
 --------------------------------------------------------------------------------
 GradGradGradGradGradGradGradGradGradGradGradGradGradGradGradGradGradGrad
GaBr3 - Using pseudo potentials and larger basis sets
| File Type | .log |
| Calculation Type | FOPT |
| Calculation Method | RB3LYP |
| Basis Set | LANL2DZ |
| Energy (a.u.) | -41.70082283 |
| Gradient (a.u.) | 0.00000016 |
| Dipole Moment (Debye) | 0.00 |
| Point Group | D3H |
| Calculation Time (s) | 7 |
In the same manner, a molecule of GaBr3 was constructed, although the point group was restricted to D3H to ensure the optimised molecule had a high degree of symmetry, with all bond lengths and bond angles identical. These were determined to be 2.35 Å and 120.0° A different basis set was used here to shorten the calculation time, which is often lengthened when looking at heavier atoms; a LANL2DZ basis set uses D95V (medium level) for first row atoms, and a pseudo potential for anything heavier. A pseudo potential models the core electrons, as only valence ones are used for bonding and account for the chemistry seen. The output file can be viewed here, and summarised in Table 3.
Item               Value     Threshold  Converged?
 Maximum Force            0.000000     0.000450     YES
 RMS     Force            0.000000     0.000300     YES
 Maximum Displacement     0.000003     0.001800     YES
 RMS     Displacement     0.000002     0.001200     YES
 Predicted change in Energy=-1.282682D-12
 Optimization completed.
    -- Stationary point found.
                           ----------------------------
                           !   Optimized Parameters   !
                           ! (Angstroms and Degrees)  !
 --------------------------                            --------------------------
 ! Name  Definition              Value          Derivative Info.                !
 --------------------------------------------------------------------------------
 ! R1    R(1,2)                  2.3502         -DE/DX =    0.0                 !
 ! R2    R(1,3)                  2.3502         -DE/DX =    0.0                 !
 ! R3    R(1,4)                  2.3502         -DE/DX =    0.0                 !
 ! A1    A(2,1,3)              120.0            -DE/DX =    0.0                 !
 ! A2    A(2,1,4)              120.0            -DE/DX =    0.0                 !
 ! A3    A(3,1,4)              120.0            -DE/DX =    0.0                 !
 ! D1    D(2,1,4,3)            180.0            -DE/DX =    0.0                 !
 --------------------------------------------------------------------------------
 GradGradGradGradGradGradGradGradGradGradGradGradGradGradGradGradGradGrad
The 2.35 Å calculated bond length is within reasonable closeness to reported literature values of 2.239 ± 0.007 Å[1]; the differences between them due to even the better-basis-set not being entirely accurate and although the literature is measuring the geometry of gaseous atoms, which more closely resemble computationally modelled ones than solution or solid-phase molecules do, the specified temperature (357 K) also creates a difference between the calculated and measured bond lengths.
BBr3 - Using a mixture of basis sets and pseudo potentials
| File Type | .log |
| Calculation Type | FOPT |
| Calculation Method | RB3LYP |
| Basis Set | GEN |
| Energy (a.u.) | -64.43644960 |
| Gradient (a.u.) | 0.00000486 |
| Dipole Moment (Debye) | 0.00 |
| Point Group | Cs |
| Calculation Time (s) | 31 |
A molecule of BBr3 was also created and optimised using a 'GEN' basis set, within this the Boron atom used the more accurate 6-31G basis set, while the heavy Bromine atoms were treated as in GaBr3 with a pseudo potential. The output file can be viewed here. For this optimised molecule the bond lengths are all incredibly close, at 1.93 Å, the bond angles measured at 120.0°.
 Item               Value     Threshold  Converged?
 Maximum Force            0.000008     0.000015     YES
 RMS     Force            0.000005     0.000010     YES
 Maximum Displacement     0.000049     0.000060     YES
 RMS     Displacement     0.000030     0.000040     YES
 Predicted change in Energy=-2.970808D-10
 Optimization completed.
    -- Stationary point found.
                           ----------------------------
                           !   Optimized Parameters   !
                           ! (Angstroms and Degrees)  !
 --------------------------                            --------------------------
 ! Name  Definition              Value          Derivative Info.                !
 --------------------------------------------------------------------------------
 ! R1    R(1,2)                  1.9339         -DE/DX =    0.0                 !
 ! R2    R(1,3)                  1.934          -DE/DX =    0.0                 !
 ! R3    R(1,4)                  1.9339         -DE/DX =    0.0                 !
 ! A1    A(2,1,3)              119.9981         -DE/DX =    0.0                 !
 ! A2    A(2,1,4)              120.0012         -DE/DX =    0.0                 !
 ! A3    A(3,1,4)              120.0007         -DE/DX =    0.0                 !
 ! D1    D(2,1,4,3)            180.0            -DE/DX =    0.0                 !
 --------------------------------------------------------------------------------
 GradGradGradGradGradGradGradGradGradGradGradGradGradGradGradGradGradGrad
Comparisons
| BH3 | GaBr3 | BBr3 |
|---|---|---|
| 1.19 | 2.35 | 1.93 |
Changing the ligand from H to Br has increased the bond length from 1.19 Å in BH3 by over 0.7 Å to BBr3. This is mainly due to bromine being a much larger atom, because of more full/partially filled electron shells occupying space further from the nucleus, giving a greater van der Waals radius. The optimal bond distance between a central atom and Br ligand is going to be longer because the two atoms cannot approach so closely before repulsive interactions stop them, an H atom, being so much smaller can get much closer. The higher electronegativity difference between bromine and boron would suggest that attractive interactions between the atoms would pull them closer together, but this is outweighed by the repulsion, which is dominant at short range. Comparison of GaBr3 and BBr3, as their ligand is unchanged, shows the effect of replacing the central atom. GaBr3 has the longest bond length of all three molecules as gallium has the largest radius of all the atoms modelled, using the same rationale as before explains why the GaBr3 bond distance is greater than for BBr3. Larger atoms also have more diffuse valence orbitals as they are screened from nuclear charge by the core electrons; this results in poorer overlap between orbitals on bonding and thus a longer, weaker bond. BBr3 has very large ligands and a very small central atom meaning there is a size mis-match between the orbitals whereas gallium and bromine are both in period 4 of the periodic table; the similar diffusivity of the latter meaning a slightly better orbital overlap, therefore the bond length increase upon going from BBr3 to GaBr3 is not as large as it could be.
BH3 frequency analysis
| File Type | .log |
| Calculation Type | FOPT |
| Calculation Method | RB3LYP |
| Basis Set | 6-31G(d,p) |
| Energy (a.u.) | -26.61532363 |
| Gradient (a.u.) | 0.00000296 |
| Dipole Moment (Debye) | 0.00 |
| Point Group | D3H |
| Calculation Time (s) | 8 |
Carrying out a frequency analysis ensures that the stationary point we have found through optimisation of the molecule is in fact a minimum, and therefore the lowest energy state of the structure. An output where all of the vibration frequencies are positive confirms this, as shown in the calculations below, these frequencies can then be used to create a computationally predicted infrared spectrum of the compound. The first time the calculation was run the 'low frequencies', representing movements of the centre of mass of the molecule, had a range much too large (up to 45 cm-1, showing the calculation was not accurate enough. This is because the symmetry group of the molecule had not been fixed to D3H symmetry; the molecule was re-drawn (without distorting the bond lengths as in part 1.1) and re-optimised, using the 6-31G(d,p) better basis set, as before for this molecule. The gaussian output file for the re-optimisation can be viewed here.
Item               Value     Threshold  Converged?
 Maximum Force            0.000006     0.000450     YES
 RMS     Force            0.000004     0.000300     YES
 Maximum Displacement     0.000023     0.001800     YES
 RMS     Displacement     0.000015     0.001200     YES
 Predicted change in Energy=-2.008834D-10
 Optimization completed.
    -- Stationary point found.
| File Type | .log |
| Calculation Type | FREQ |
| Calculation Method | RB3LYP |
| Basis Set | 6-31G(d,p) |
| Energy (a.u.) | -26.61532363 |
| Gradient (a.u.) | 0.00000291 |
| Dipole Moment (Debye) | 0.00 |
| Point Group | D3H |
| Calculation Time (s) | 7 |
The successful frequency calculation was run according to Table 7, the low frequencies and confirmation of completed procudure are shown below. The output file from the Gaussian calculation can be found here.
Item               Value     Threshold  Converged?
 Maximum Force            0.000006     0.000450     YES
 RMS     Force            0.000003     0.000300     YES
 Maximum Displacement     0.000023     0.001800     YES
 RMS     Displacement     0.000011     0.001200     YES
 Predicted change in Energy=-1.996524D-10
 Optimization completed.
    -- Stationary point found.
 GradGradGradGradGradGradGradGradGradGradGradGradGradGradGradGradGradGrad
Low frequencies ---   -0.9432   -0.8611   -0.0055    5.7455   11.7246   11.7625
 Low frequencies --- 1162.9963 1213.1826 1213.1853
The vibrational motions at each of the frequencies given by the calculation are described in Table 8.
| Description | Frequency (cm-1) | Intensity | Symmetry (Point group D3H) | |
|---|---|---|---|---|
1 
|
Concerted wagging of all three hydrogen ligands above and below the plane of the original molecule. | 1163 | 93 | A2" |
2 
|
Scissoring of hydrogen atoms 3 and 4, towards and away from each other, in the plane of the molecule. | 1213 | 14 | E' |
3 
|
Rocking of hydrogen atoms 3 and 4, hydrogen atom 2 scissoring with respect to the previous motion, moving first towards 4 and then 3, while they move in the same direction, never changining the distance between them. | 1213 | 14 | E' |
4 
|
All hydrogen atoms symmetrically stretching away from the boron atom and then compressing in to it. | 2582 | 0 | A1' |
5 
|
Asymmetric stretching of hydrogen atoms 3 and 4, one moving towards the boron while the other moves away, again all in the plane of the original molecule. | 2715 | 126 | E' |
6 
|
Hydrogen atoms 3 and 4 symmetrically stretching, the third hydrogen atom asymmetrically stretching (compressing the B-H bond when the other two are lengthening) with respect to the first motion. | 2715 | 126 | E' |

This information is also represented by the infrared spectrum, Figure 1. Despite there being six different vibrational modes of BH3 only three peaks appear on the predicted IR spectrum; an intense peak at 1163 cm-1, a weaker absorption at 1213 cm-1 and a very strong signal at 2715 cm-1. This is because vibrations 2 and 3, and 5 and 6, are degenerate as shown by the doubly degenerate symmetry designation, E'. Each of these pairs of vibrational modes are caused by the almost identical vibration frequencies and thus appear as one peak on the spectrum. Mode 4 is a totally symmetrical stretch which does not change the dipole moment of the molecule and is therefore IR inactive, as proved by zero intensity predicted by the calculations.
GaBr3 frequency analysis
The same frequency analysis was conducted on the previously optimised molecule of GaBr3, for continuity the same basis set as used in the optimisation was employed. The results would not be valid otherwise because modelled molecules are seen as different molecules by the computer when different basis sets are used, the electrons have been considered in different ways, with varying levels of accuracy.
| File Type | .log |
| Calculation Type | FREQ |
| Calculation Method | RB3LYP |
| Basis Set | LANL2DZ |
| Energy (a.u.) | -41.70082783 |
| Gradient (a.u.) | 0.00000011 |
| Dipole Moment (Debye) | 0.00 |
| Point Group | D3H |
| Calculation Time (s) | 14 |
The frequency analysis was run according to, and gave outputs shown in, Table 9, the low frequencies and confirmation of completed procudure are shown below, the lowest 'real' vibrational mode at 76 cm-1. The output file from the Gaussian calculation can be found here, and the D-space link[2].
Item               Value     Threshold  Converged?
 Maximum Force            0.000000     0.000450     YES
 RMS     Force            0.000000     0.000300     YES
 Maximum Displacement     0.000002     0.001800     YES
 RMS     Displacement     0.000001     0.001200     YES
 Predicted change in Energy=-6.142862D-13
 Optimization completed.
    -- Stationary point found.
 GradGradGradGradGradGradGradGradGradGradGradGradGradGradGradGradGradGrad
Low frequencies ---   -0.5252   -0.5247   -0.0024   -0.0010    0.0235    1.2010
 Low frequencies ---   76.3744   76.3753   99.6982
The vibrational motions at each of the frequencies given by the calculation are described in Table 10.
| Description | Frequency (cm-1) | Intensity | Symmetry (Point group D3H) | |
|---|---|---|---|---|
1 
|
Ga atom moving left to right in plane of the molecule, creating a rocking motion on bromine atoms 3 and 4, atom 2 is scissoring between these two, moving towards bromine 3, then 4, while the latter move concertedly, never getting closer to further from each other. | 76 | 3 | E' |
2 
|
Scissoring of bromine atoms 3 and 4 towards and away from each other, in the plane of the molecule. The remaining bromine atom does not move with respect to the central gallium, but together they move up and down. | 76 | 3 | E' |
3 
|
The gallium atom is moving in and out of the plane of the original molecule, all of the bromine atoms concertedly wagging in the opposite direction, with a smaller displacement. | 99 | 9 | A2" |
4 
|
Symmetric stretch of all bromine atoms towards and away from the gallium centre. | 197 | 0 | A1' |
5 
|
Asymmetric stretching of bromine atoms 3 and 4, Ga-Br bond stretching as the other compresses, combined with motion of the gallium atom left to right in the plane of the molecule. | 316 | 57 | E' |
6 
|
A very small symmetric stretching of 3 and 4, with a much larger Ga-Br2 stretch. Stretch of Ga-Br2 coinciding with compression of Ga-Br3/4. | 316 | 57 | E' |

This information is also represented by the infrared spectrum, Figure 2, which similarly shows only 3 peaks. Again, vibrational mode 4 is IR inactive due to the symmetrical nature of the stretching, and also repeating is two pairs of degenerate vibration modes. leaving only weaker peaks at 76 and 9 cm-1, and a much more intense one at 316 cm-1.
Comparisons
| BH3 (cm-1) | GaBr3 (cm-1) |
|---|---|
| 1163 | 76 |
| 1213 | 76 |
| 1213 | 99 |
| 2582 | 197 |
| 2715 | 316 |
| 2715 | 316 |
There is a large disparity between the vibration frequencies predicted for BH3 and GaBr3, BH3 having much higher frequency vibrational modes. If each bond is modelled as a harmonic oscillator Equation 1 shows how the vibration frequency depends on the reduced mass of the compound.
 Equation 1
This shows an inversely proportional dependency, hence the heavier the atoms (as in GaBr3) the lower the vibrational frequency, accounting for the difference.
Each spectrum shows modes of the same symmetry, as expected because both molecules are trigonal planar therefore the same type of stretch or bend will have the same associated symmetry element under their shared point group D3H. Going from the modes of BH3 to GaBr3 there is a re-ordering in that the A2" comes after the first double degenerate vibration, possibly because it is the motion of the heavy gallium which comprises the most of the motion, as opposed to that of the light hydrogen atoms in the first mode of BH3.
The spectra are similar in that both show three frequencies, two of lower intensity at lower wavenumbers, with one much more intense peak to the right of the spectra. For both molecules this intense peak is due to a doubly degenerate vibration frequency, constituting an asymmetric and symmetric stretch of ligands 3 and 4. Both spectra also show the A2" mode (moved by the re-ordering) as the more intense of the signals on the left hand side. These first two peaks at lower frequencies correspond to 'bending' modes of the molecule, involving wagging, scissoring and rocking of the ligands around the central atom, while the higher frequency modes are purely stretching modes, recording higher frequencies as more energy is required to stretch/compress bonds than to distort the bond angles of the molecule.
After some calculations in GaussView the image of the structure did not have anything to represent the bonds. This is not indicative that any bonds have been broken, only that GaussView is not recognising them due to it's bond identification criteria; the programme classifies 'a bond' as an interaction within a certain distance, based on the two atoms involved. This can show the strength of a bond, as bond length correlates with bond strength, but in reality a bond is not defined by its distance but as a net attractive interaction between the atoms. The attractive force is electrostatic as electrons are 'donated' are 'shared' between the atoms, leading to a higher electron density between the atoms.
Molecular Orbitals of BH3
| File Type | .log |
| Calculation Type | SP |
| Calculation Method | RB3LYP |
| Basis Set | 6-31G(d,p) |
| Energy (a.u.) | -26.61532362 |
| Gradient (a.u.) | 0.00003482 |
| Dipole Moment (Debye) | 0.00 |
| Point Group | D3H |
| Calculation Time (s) | 16 |
In order to analyse the molecular orbitals of BH3 a calculation as shown in Table 12 was performed. The output .log file can be viewed here, and the D-space link[3].
A Linear Combination of Atomic Orbitals (LCAO) provides the image of how we usually visualise molecular orbitals; they have been worked out and added to the molecular orbital diagram of BH3 shown below, as have images of the computed molecular orbitals as visualised by GausView for comparison.

Comparison of the LCAO and computed MO images show the techniques to produce very similar MO shapes, in particular for the orbitals up to, and including, A2". The antibonding orbitals are still in agreement but the shapes more complex. The main difference between the LCAO and computed images is that the gaussian calculation has smeared out the MO's across more of the molecule, joining up areas of the same phase, while in the LCAO the shape of each original AO can still be seen. They also show how the MO's extend, much further than the ball and stick representation of the molecule, and filling more space than shown by an LCAO image. This analysis validates the usefulness of LCAO theory, which is qualitative but can still give a representation similar to what is accurately predicted by computational chemistry. Although less exact LCAO can still be useful, especially when the molecules under consideration are simple.
NH3 - Complete analysis
Optimisation
| File Type | .log |
| Calculation Type | FOPT |
| Calculation Method | RB3LYP |
| Basis Set | 6-31G(d,p) |
| Energy (a.u.) | -56.5577682 |
| Gradient (a.u.) | 0.00000095 |
| Dipole Moment (Debye) | 1.85 |
| Point Group | C1 |
| Calculation Time (s) | 18 |
The investigation was then broadened to look at a molecule of NH3, which was created in a similar manner to the other trigonal planar molecules, although this time the structure is tetrahedral. Optimisation was performed according to, and providing results, shown in Table 13. For this molecule a noticeable dipole moment is seen due to the non-planar structure, and the point group a low symmetry C1. Below is confirmation of the finished calculation, the gaussian output file can be found here.
Item               Value     Threshold  Converged?
 Maximum Force            0.000002     0.000015     YES
 RMS     Force            0.000001     0.000010     YES
 Maximum Displacement     0.000005     0.000060     YES
 RMS     Displacement     0.000003     0.000040     YES
 Predicted change in Energy=-9.687935D-12
 Optimization completed.
    -- Stationary point found.
 GradGradGradGradGradGradGradGradGradGradGradGradGradGradGradGradGradGrad
Frequency analysis
| File Type | .log |
| Calculation Type | FREQ |
| Calculation Method | RB3LYP |
| Basis Set | 6-31G(d,p) |
| Energy (a.u.) | -56.5577682 |
| Gradient (a.u.) | 0.00000097 |
| Dipole Moment (Debye) | 1.85 |
| Point Group | C1 |
| Calculation Time (s) | 11 |
A frequency calculation was then conducted to ensure that the optimisation had found the minimum energy of the molecule, lack of negative frequencies in the send line reported verify this. The gaussian output file can be found here.
Item               Value     Threshold  Converged?
 Maximum Force            0.000002     0.000450     YES
 RMS     Force            0.000001     0.000300     YES
 Maximum Displacement     0.000006     0.001800     YES
 RMS     Displacement     0.000003     0.001200     YES
 Predicted change in Energy=-1.151601D-11
 Optimization completed.
    -- Stationary point found.
 GradGradGradGradGradGradGradGradGradGradGradGradGradGradGradGradGradGrad
Low frequencies ---   -6.6677   -4.9224   -0.0019   -0.0015   -0.0012    1.0696
 Low frequencies --- 1089.3492 1693.9253 1693.9297
Molecular orbitals
| File Type | .log |
| Calculation Type | FOPT |
| Calculation Method | RB3LYP |
| Basis Set | 6-31G(d,p) |
| Energy (a.u.) | -56.5577687 |
| Gradient (a.u.) | 0.00000098 |
| Dipole Moment (Debye) | 1.85 |
| Point Group | C1 |
| Calculation Time (s) | 41 |
A population analysis (same as that which produced the molecular orbitals of BH3) was conducted on NH3, this time in order to analyse the Natural Bond Orbitals (NBOs. The output .log file from the HPC can be found here, along with the D-space link[4].
Item               Value     Threshold  Converged?
 Maximum Force            0.000002     0.000015     YES
 RMS     Force            0.000001     0.000010     YES
 Maximum Displacement     0.000006     0.000060     YES
 RMS     Displacement     0.000004     0.000040     YES
 Predicted change in Energy=-1.248893D-11
 Optimization completed.
    -- Stationary point found.
-
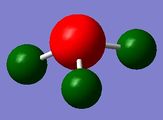 Figure 3. NH3 Charge distribution
 -
 Specific NH3 NBO charges


Figure 3 shows the NBO charge distribution of the NH3 molecule, bright green indicates highly positive charge and bright red highly negative charge. As expected the electronegative nitrogen atom is highly negatively charged, the hydrogen atoms the oposite. Colour charge range -1.125 - 1.125. The numerical charges; -1.125 on the nitrogen atom and 0.375 on each of the three hydrogen atoms totals to zero, as expected for a simple neutral molecule.
Ammonia-borane
The adduct of two of the molecules previously investigated (NH3 and BH3) is interesting in terms of its bonding. The B-N bond is very short and strong at 1.67 Å and is referred to as a dative bond; conventionally this means that the bond comprises two electrons donated from the nitrogen to the boron atom. In fact the electrons are shared. A molecule of ammonia-borane (H3BNH3)was created on GaussView as before.
Optimisation
| File Type | .log |
| Calculation Type | FOPT |
| Calculation Method | RB3LYP |
| Basis Set | 6-31G(d,p) |
| Energy (a.u.) | -83.22468999 |
| Gradient (a.u.) | 0.00006050 |
| Dipole Moment (Debye) | 5.57 |
| Point Group | C1 |
| Calculation Time (s) | 29 |
This molecule was optimised in exactly the same way as each of the component molecules had, using the 6-31G(d,p) basis set, and the same calculation methods and types. The gaussian output file can be found here.
Item               Value     Threshold  Converged?
 Maximum Force            0.000128     0.000450     YES
 RMS     Force            0.000057     0.000300     YES
 Maximum Displacement     0.000631     0.001800     YES
 RMS     Displacement     0.000304     0.001200     YES
 Predicted change in Energy=-1.626466D-07
 Optimization completed.
    -- Stationary point found.
                           ----------------------------
                           !   Optimized Parameters   !
                           ! (Angstroms and Degrees)  !
 --------------------------                            --------------------------
 ! Name  Definition              Value          Derivative Info.                !
 --------------------------------------------------------------------------------
 ! R1    R(1,8)                  1.21           -DE/DX =   -0.0001              !
 ! R2    R(2,8)                  1.21           -DE/DX =   -0.0001              !
 ! R3    R(3,8)                  1.21           -DE/DX =   -0.0001              !
 ! R4    R(4,7)                  1.0186         -DE/DX =   -0.0001              !
 ! R5    R(5,7)                  1.0186         -DE/DX =   -0.0001              !
 ! R6    R(6,7)                  1.0186         -DE/DX =   -0.0001              !
 ! R7    R(7,8)                  1.6681         -DE/DX =   -0.0001              !
 ! A1    A(4,7,5)              107.8712         -DE/DX =    0.0                 !
 ! A2    A(4,7,6)              107.8685         -DE/DX =    0.0                 !
 ! A3    A(4,7,8)              111.0263         -DE/DX =    0.0                 !
 ! A4    A(5,7,6)              107.8697         -DE/DX =    0.0                 !
 ! A5    A(5,7,8)              111.0312         -DE/DX =    0.0                 !
 ! A6    A(6,7,8)              111.0287         -DE/DX =    0.0                 !
 ! A7    A(1,8,2)              113.8757         -DE/DX =    0.0                 !
 ! A8    A(1,8,3)              113.876          -DE/DX =    0.0                 !
 ! A9    A(1,8,7)              104.5924         -DE/DX =    0.0                 !
 ! A10   A(2,8,3)              113.8743         -DE/DX =    0.0                 !
 ! A11   A(2,8,7)              104.5957         -DE/DX =    0.0                 !
 ! A12   A(3,8,7)              104.5987         -DE/DX =    0.0                 !
 ! D1    D(4,7,8,1)           -179.9994         -DE/DX =    0.0                 !
 ! D2    D(4,7,8,2)            -60.0003         -DE/DX =    0.0                 !
 ! D3    D(4,7,8,3)             60.0            -DE/DX =    0.0                 !
 ! D4    D(5,7,8,1)            -59.9975         -DE/DX =    0.0                 !
 ! D5    D(5,7,8,2)             60.0015         -DE/DX =    0.0                 !
 ! D6    D(5,7,8,3)           -179.9982         -DE/DX =    0.0                 !
 ! D7    D(6,7,8,1)             60.004          -DE/DX =    0.0                 !
 ! D8    D(6,7,8,2)           -179.997          -DE/DX =    0.0                 !
 ! D9    D(6,7,8,3)            -59.9967         -DE/DX =    0.0                 !
 --------------------------------------------------------------------------------
 GradGradGradGradGradGradGradGradGradGradGradGradGradGradGradGradGradGrad
Frequency
| File Type | .log |
| Calculation Type | FREQ |
| Calculation Method | RB3LYP |
| Basis Set | 6-31G(d,p) |
| Energy (a.u.) | -83.22468905 |
| Gradient (a.u.) | 0.00000151 |
| Dipole Moment (Debye) | 5.57 |
| Point Group | C1 |
| Calculation Time (s) | 25 |
A frequency analysis was conducted to confirm that the stationary point found is a minimum; shown by the lack of negative vibration frequencies. The low frequencies proved to be very low, well within the 15 cm-1 range, showing this calculation method to be suitable for this slightly more complex molecule. The gaussian output file can be found here.
Item               Value     Threshold  Converged?
 Maximum Force            0.000002     0.000015     YES
 RMS     Force            0.000001     0.000010     YES
 Maximum Displacement     0.000015     0.000060     YES
 RMS     Displacement     0.000005     0.000040     YES
 Predicted change in Energy=-8.036148D-11
 Optimization completed.
    -- Stationary point found
Low frequencies ---   -5.3049   -2.7818   -0.4932   -0.0009    0.0005    0.0005
 Low frequencies ---  263.3889  632.9484  638.4065
Dative bond energy
| E(NH3) | E(BH3) | E(H3NBH3) |
|---|---|---|
| -26.61532358 | -56.55776822 | -83.22468999 |
The dative bond energy corresponds to the association or dissociation energy of ammonia-borane from its constituent NH3 and BH3 parts, it can be simply calculated as the difference between the energies of the two precursors, and the adduct, using Equation 2.
Failed to parse (syntax error): {\displaystyle ΔE=E(H_3NBH_3)-[E(NH_3)+E(BH_3)]} Equation 2
This gives the dissociation energy as -0.05159821 a.u., converted to -135 kJmol-1. Although not incredibly close, this compares well to literature values of 111 kJmol-1 [5] showing the calculated value to be in the right 'ballpark'.
Main Group Halides - Part 2
The second part of this investigation, entitled main group halides, follows on from part one by investigating further compounds from the same group 13 of the periodic table, specifically aluminium centres with mixed halide ligands. They are predicted to behave similarly: AlCl2Br dimerising as BH3 does, to relieve the electron deficiency of 3-coordinated group 13 metals. The energies of the Al2Cl4Br2 dimer isomers are compared below, along with analysis as to whether dimerisation is energetically favourable, examination of the computationally generated IR spectra and molecular orbitals of the adduct. The better-basis-set was used to model the lighter Al and Cl atoms, while once again the LanL2DZ (using Los ALamos pseudo potential) was utilised for the heavier bromine atoms. For every calculation in the following section (for continuity and to ensure comparability) the keywords 'pseudo=read', 'gfinput' and opt(maxcycle=50) were added so that the pseudo-potential could be added for specific atoms, and to prevent calculations from taking too long (being limited to 50 cycles only).
Firstly, 4 possible isomers of Al2Cl4Br2 were identified, and their energies compared, relative to the lowest in energy. Calculations are shown below, with Summary Tables 19-22 providing input information and results, all were comleted using the exact same method to ensure comparisons would be valid.
Optimisation
Isomer 1
| File Type | .log |
| Calculation Type | FOPT |
| Calculation Method | RB3LYP |
| Basis Set | Gen |
| Energy (a.u.) | -2352.40630798 |
| Gradient (a.u.) | 0.00000182 |
| Dipole Moment (Debye) | 0.00 |
| Point Group | C1 |
| Calculation Time (min, s) | 9, 16 |
The output file from the Gaussian calculation can be found here, and the D-space link[6].
Item               Value     Threshold  Converged?
 Maximum Force            0.000003     0.000450     YES
 RMS     Force            0.000001     0.000300     YES
 Maximum Displacement     0.000038     0.001800     YES
 RMS     Displacement     0.000014     0.001200     YES
 Predicted change in Energy=-2.660926D-10
 Optimization completed.
    -- Stationary point found.
Isomer 2
| File Type | .log |
| Calculation Type | FOPT |
| Calculation Method | RB3LYP |
| Basis Set | Gen |
| Energy (a.u.) | -2352.41109930 |
| Gradient (a.u.) | 0.00003323 |
| Dipole Moment (Debye) | 0.14 |
| Point Group | C1 |
| Calculation Time (min, s) | 14, 47 |
The output file from the Gaussian calculation can be found here, and the D-space link[7].
 Item               Value     Threshold  Converged?
 Maximum Force            0.000105     0.000450     YES
 RMS     Force            0.000026     0.000300     YES
 Maximum Displacement     0.001369     0.001800     YES
 RMS     Displacement     0.000597     0.001200     YES
 Predicted change in Energy=-1.135021D-07
 Optimization completed.
    -- Stationary point found.
Isomer 3
| File Type | .log |
| Calculation Type | FOPT |
| Calculation Method | RB3LYP |
| Basis Set | Gen |
| Energy (a.u.) | -2352.41626575 |
| Gradient (a.u.) | 0.00001256 |
| Dipole Moment (Debye) | 0.19 |
| Point Group | C1 |
| Calculation Time (min, s) | 9, 54 |
The output file from the Gaussian calculation can be found here, and the D-space link[8].
Item               Value     Threshold  Converged?
 Maximum Force            0.000023     0.000450     YES
 RMS     Force            0.000012     0.000300     YES
 Maximum Displacement     0.000632     0.001800     YES
 RMS     Displacement     0.000315     0.001200     YES
 Predicted change in Energy=-2.512179D-08
 Optimization completed.
    -- Stationary point found.
Isomer 4
| File Type | .log |
| Calculation Type | FOPT |
| Calculation Method | RB3LYP |
| Basis Set | Gen |
| Energy (a.u.) | -2352.41629861 |
| Gradient (a.u.) | 0.00000413 |
| Dipole Moment (Debye) | 0.00 |
| Point Group | C1 |
| Calculation Time (min, s) | 9, 53 |
The output file from the Gaussian calculation can be found here, and the D-space link[9].
Item               Value     Threshold  Converged?
 Maximum Force            0.000005     0.000450     YES
 RMS     Force            0.000003     0.000300     YES
 Maximum Displacement     0.000053     0.001800     YES
 RMS     Displacement     0.000023     0.001200     YES
 Predicted change in Energy=-6.046442D-10
 Optimization completed.
    -- Stationary point found.
An enantiomer of Isomer 2 also exists, although all the predicted properties of the two enantiomers should in theory be identical, so it was excluded from the investigation. Also found were further isomers as a result of the schlenk equilibrium; this scheme would lead to isomeric dimers with both of the bromine atoms connected to the same aluminium centre, which could not be formed from a direct reaction of two ALCl2Br monomers.
Symmetry and Energy Comparisons
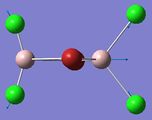
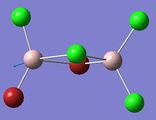
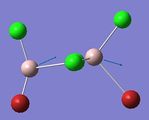
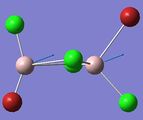
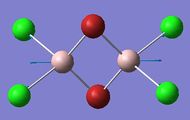
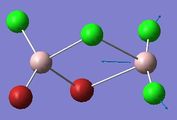
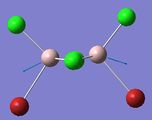
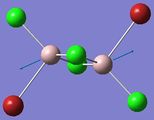
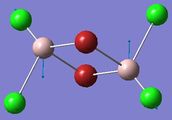
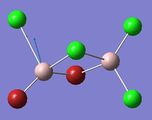
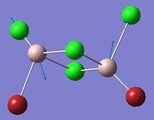
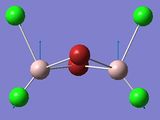
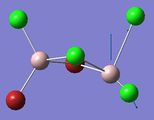
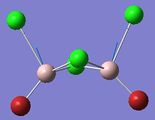
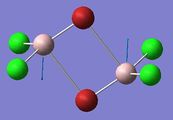
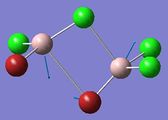
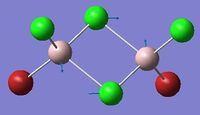
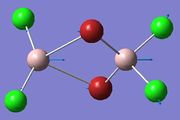
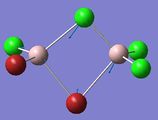
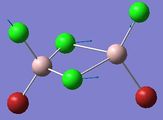
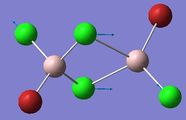
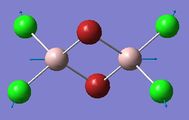
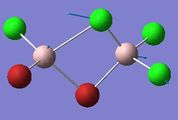
Although the results of the calculations show the symmetry of each isomer to have to low-symmetry point group, C1, all of them have different point groups. Isomer 1 has the highest symmetry, point group D2h, with C2 rotational symmetry axes perpendicular to the principle axis. Isomers 3 & 4 also have many symmetry elements, giving C2v and C2h point groups due to the presence of reflection planes either parallel or perpendicular to the principle axis. Only Isomer 2 is actually C1 symmetry, with no rotational symmetry at all.
Isomer 1 
|
Isomer 2 
|
Isomer 3 
|
Isomer 4 
| |
|---|---|---|---|---|
| a.u. | 0.00999063 | 0.00519931 | 0.00003286 | 0 |
| kJmol-1 | 26.230 | 13.651 | 0.086 | 0 |
The lowest energy isomer proved to be Isomer 4, with -6176268.992 kJmol-1, the difference between the energies of the other isomers and this are tabulated in Table 23. As apparent from the pictures above the further apart within the molecules the bromine atoms are, the more stable the isomer. Bromine being a much larger atom means that in isomers 1 and 2 at least, the size and proximity of the bromine atoms means that their van der Waals radii are clashing; in isomer 1 the inter-bromine distance is 3.57 Å, shorter than twice the van der waals radius of 1.95 Å[10], hence a repulsive interaction is destabilising the molecule. Isomers 3 & 4 are both much more stable, and themselves very close in energy. Here the two large bromine atoms are far enough apart for the distance between them to no longer have an effect on the molecule's stability; a tiny energy difference between cis- and trans- arrangements of bromine terminal ligands. As chlorine and aluminium are in the same period of the periodic table, with similarly diffuse orbitals and well-matched orbitals size-wise, bonds between these atoms will have better orbital overlap, therefore be much stronger, than between aluminium and bromine. Thus having weaker Al-Br bonds forming the bridge of the structure accounts for further destabilisation of the first two isomers, and explains why isomer 1 is so much higher in energy than isomer 2. As seen in Summary tables 19-22 the dipole moment of the molecule also varies with the placement of the bromine atoms; a lower dipole moment means incresed stability of the molecule. Both isomers 1 & 4 have a zero dipole moment, although this is outweighed by the proximity of the bromine atoms for isomer 1, it also explains why isomer 4 is lower in energy than isomer 3, with a 0.19 Debye dipole moment.
Dissocation Energy

| File Type | .log |
| Calculation Type | FOPT |
| Calculation Method | RB3LYP |
| Basis Set | Gen |
| Energy (a.u.) | -1176.19013679 |
| Gradient (a.u.) | 0.00004196 |
| Dipole Moment (Debye) | 0.12 |
| Point Group | C2V |
| Calculation Time (min, s) | 1, 13 |
In order to investigate whether the Al2Cl4Br2 adduct does indeed form to alleviate electron deficiency a molecule of the monomer was optimised, to determine the energy change upon dimerisation. The output logfile for the monomer optimisation can be viewed here, and d-space link[11], the table below showing a stationary point in energy found, the frequency calculation below confirming that this is in fact the energy minimum. The output logfile for this caculation can be viewed here, and d-space link[12]
Item               Value     Threshold  Converged?
 Maximum Force            0.000136     0.000450     YES
 RMS     Force            0.000073     0.000300     YES
 Maximum Displacement     0.000760     0.001800     YES
 RMS     Displacement     0.000497     0.001200     YES
 Predicted change in Energy=-7.984449D-08
 Optimization completed.
    -- Stationary point found.
| File Type | .log |
| Calculation Type | FREQ |
| Calculation Method | RB3LYP |
| Basis Set | Gen |
| Energy (a.u.) | -1176.19013679 |
| Gradient (a.u.) | 0.00004196 |
| Dipole Moment (Debye) | 0.12 |
| Point Group | C2V |
| Calculation Time (min, s) | 0, 42 |
Item               Value     Threshold  Converged?
 Maximum Force            0.000081     0.000450     YES
 RMS     Force            0.000042     0.000300     YES
 Maximum Displacement     0.001588     0.001800     YES
 RMS     Displacement     0.000974     0.001200     YES
 Predicted change in Energy=-1.810813D-07
 Optimization completed.
    -- Stationary point found.
Low frequencies ---    0.0021    0.0028    0.0041    1.3569    3.6367    4.2604
 Low frequencies ---  120.5042  133.9178  185.8950
Using Equation 2 the same method was used to calculate the dissociation energy from the adduct into two monomers. This gave the result -94.584 kJmol-1, showing the adduct to more stable by 94 kJ per mole, as expected. Relief of the electron deficiency of the aluminium centres, despite the increase in steric hindrance, means that dimerisation is favourable in comparison to two isolated monomers.
IR spectra - frequency analysis
The IR spectra of all of the isomers were then predicted, using frequency calculations from Gaussian, Summary Tables 26-29 show the calculation parameters, and outputs. This was in order to examine the differing shapes of the spectra with respect to the different symmetries of each molecule.
Isomer 1
| File Type | .log |
| Calculation Type | FREQ |
| Calculation Method | RB3LYP |
| Basis Set | Gen |
| Energy (a.u.) | -2352.40630798 |
| Gradient (a.u.) | 0.00000182 |
| Dipole Moment (Debye) | 0.00 |
| Point Group | C1 |
| Calculation Time (min, s) | 3, 52 |
The output file from the Gaussian calculation can be found here, and the D-space link[13].
Item               Value     Threshold  Converged?
 Maximum Force            0.000003     0.000450     YES
 RMS     Force            0.000001     0.000300     YES
 Maximum Displacement     0.000241     0.001800     YES
 RMS     Displacement     0.000114     0.001200     YES
 Predicted change in Energy=-4.312851D-10
 Optimization completed.
    -- Stationary point found.
 Low frequencies ---   -5.1754   -5.0372   -3.1487   -0.0034   -0.0020   -0.0017
 Low frequencies ---   14.8256   63.2702   86.0770
Isomer 2
| File Type | .log |
| Calculation Type | FREQ |
| Calculation Method | RB3LYP |
| Basis Set | Gen |
| Energy (a.u.) | -2352.41109930 |
| Gradient (a.u.) | 0.00003323 |
| Dipole Moment (Debye) | 0.14 |
| Point Group | C1 |
| Calculation Time (min, s) | 4, 6 |
The output file from the Gaussian calculation can be found here, and the D-space link[14].
Item               Value     Threshold  Converged?
 Maximum Force            0.000105     0.000450     YES
 RMS     Force            0.000026     0.000300     YES
 Maximum Displacement     0.001664     0.001800     YES
 RMS     Displacement     0.000695     0.001200     YES
 Predicted change in Energy=-1.848599D-07
 Optimization completed.
    -- Stationary point found.
 Low frequencies ---   -2.9957   -1.4861   -0.0032   -0.0025   -0.0021    3.0881
 Low frequencies ---   17.0181   55.9577   80.0483
Isomer 3
| File Type | .log |
| Calculation Type | FREQ |
| Calculation Method | RB3LYP |
| Basis Set | Gen |
| Energy (a.u.) | -2352.41626680 |
| Gradient (a.u.) | 0.00000691 |
| Dipole Moment (Debye) | 0.17 |
| Point Group | C1 |
| Calculation Time (min, s) | 4, 13 |
The output file from the Gaussian calculation can be found here, and the D-space link[15].
Item               Value     Threshold  Converged?
 Maximum Force            0.000011     0.000450     YES
 RMS     Force            0.000006     0.000300     YES
 Maximum Displacement     0.001466     0.001800     YES
 RMS     Displacement     0.000548     0.001200     YES
 Predicted change in Energy=-1.125435D-08
 Optimization completed.
    -- Stationary point found.
Low frequencies ---   -4.2535   -2.3935   -0.0021   -0.0020   -0.0007    1.2837
 Low frequencies ---   17.1621   50.9093   78.5490
Isomer 4
| File Type | .log |
| Calculation Type | FREQ |
| Calculation Method | RB3LYP |
| Basis Set | Gen |
| Energy (a.u.) | -2352.41629861 |
| Gradient (a.u.) | 0.00000413 |
| Dipole Moment (Debye) | 0.00 |
| Point Group | C1 |
| Calculation Time (min, s) | 4, 12 |
The output file from the Gaussian calculation can be found here, and the D-space link[16].
Item               Value     Threshold  Converged?
 Maximum Force            0.000005     0.000450     YES
 RMS     Force            0.000003     0.000300     YES
 Maximum Displacement     0.000305     0.001800     YES
 RMS     Displacement     0.000126     0.001200     YES
 Predicted change in Energy=-3.413559D-09
 Optimization completed.
    -- Stationary point found.
Low frequencies ---   -5.1502   -0.0038   -0.0030   -0.0019    1.4134    2.0502
 Low frequencies ---   18.1470   49.1065   73.0086
IR spectra Comparison

|

|

|

|
 |
 |
 |
 |
| Frequency / cm-1 (intensity) | ||||
|---|---|---|---|---|
| Isomer 1 | Isomer 2 | Isomer 3 | Isomer 4 | |
| 1 | 15 (0) | 17 (0) | 17 (0) | 18 (0) |
| 2 | 63 (0) | 56 (0) | 51 (0) | 49 (0) |
| 3 | 86 (0) | 80 (0) | 79 (0) | 73 (0) |
| 4 | 87 (0) | 92 (0) | 99 (0) | 105 (0) |
| 5 | 108 (5) | 107 (0) | 103 (3) | 109 (0) |
| 6 | 111 (0) | 110 (5) | 121 (13) | 117 (9) |
| 7 | 126 (8) | 121 (8) | 123 (6) | 120 (13) |
| 8 | 135 (0) | 145 (5) | 157 (0) | 157 (0) |
| 9 | 138 (7) | 154 (6) | 158 (5) | 160 (6) |
| 10 | 163 (0) | 186 (1) | 194 (2) | 192 (0) |
| 11 | 197 (0) | 211 (21) | 264 (0) | 264 (0) |
| 12 | 241 (100) | 257 (10) | 279 (25) | 280 (29) |
| 13 | 247 (0) | 289 (48) | 309 (2) | 308 (0) |
| 14 | 341 (161) | 384 (154) | 413 (149) | 413 (149) |
| 15 | 467 (347) | 424 (247) | 420 (411) | 421 (439) |
| 16 | 494 (0) | 493 (107) | 461 (35) | 459 (0) |
| 17 | 608 (0) | 574 (122) | 570 (32) | 574 (0) |
| 18 | 616 (332) | 615 (197) | 582 (278) | 579 (316) |
Isomers 3 & 4 have produced very similar spectra, which can be rationalised by their very similar structures, with bromine atoms only in terminal positions. With point groups C2v and C2h respectively, they differ only in the orientation of symmetry planes, with respect to the principle rotation axis. We would expect every isomer to produce 18 peak spectra as a result of the 3N-6 rule governing the number of absorptions, dependent on the number of atoms in the molecule (N). However, both have many bands reported with zero intensity, representing vibrations which are experimentally IR-inactive, these bands are a consequence of symmetry. Any stretch or deformation which does not result in a change in dipole moment of the molecule does not appear on an experimental spectrum, leading to an incomplete picture of the vibrations present in the molecule. For all of the spectra the first four modes are zero intensity - all are bending modes in which the aluminium atoms are relatively stationary, the halides (all more electronegative) wagging, rocking or twisting around them, each balancing out the motion of the atom through the centre of inversion, hence the dipole moment is not affected, resulting in very few low-frequency peaks seen in any of the spectra. The spectra of the two isomers mentioned are both dominated by a very intense peak at ~420 cm-1; due to concerted movement of the two aluminium centres towards one pair of terminal atoms then the other, the large change in dipole moment created by movement of the molecule's electropositive atoms with respect to all of the others, leads to a very intense absorption. 3 & 4 also have corresponding signals 6, 9, 12, 14, and 18 (14 is masked by the intensity of 15) leading to a very similar overall shape. 9 and 12 both represent bending modes of the structure; wagging or scissoring of the bridging chlorine atoms with respect to the aluminium centres, 14 the same motion as 15 but in a perpendicular plane, and 18, again very intense as it is a result of the electropositive aluminium atoms' motion, moving concertedly generating an asymmetric stretch between the terminal halides bonded to each centre, which remain almost stationary. Things brings to light another interesting observation, the bromine atoms always have a much lesser displacement than chlorine atoms. As they are heavier more energy is required to move the bromine atoms so at each frequency recorded, which establishes a displacement in all the other atoms, the bromine atoms move less. The difference between these two spectra is in the extra peaks seen in for isomer 3. This isomer is marginally less symmetrical and therefore vibrations which are completely IR-inactive in the trans-isomer 4 have some intensity in the cis-isomer, as the same vibrational motion creates a change in dipole moment.
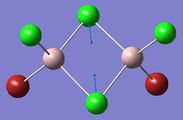
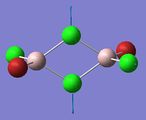
The spectrum of isomer 1 has a very different overall shape; although also highly symmetric, moving the bromine ligands from terminal to bridging positions has shifted many of the peaks. It also has the most peaks shown in Table 31 which are unseen in the spectrum; as the molecule is so symmetrical, with a centre of inversion, any motions which move around this origin do not change the dipole moment and are thus absent from the predicted spectrum. The spectrum of isomer 2 can almost be said to be the shapes of isomer 1's spectrum, and that of isomer 3/4, superimposed. Thirteen of the eighteen vibrations are seen as peaks because the terminal and bridging locations of the bromine atoms mean that all of them are towards one side of the structure, resulting in an unsymmetrical molecule. The same ~420 cm-1 stretch is also seen in the spectrum of isomer 2, from the same motion this time of only the aluminium atom directly connected to terminal bromine, again intense. This peak appears in all the spectra bar that of isomer 1, evidence itself indicating that the deformation relates specifically to the presence of at least one terminal Al-Br bond, the images below of mode 15 confirm this. In isomer 1 visualisation of the movement seems to show a similar motion, although the bromine atoms being in bridging locations means the Al-Br length is unchanged, thus vibration at ~420 cm-1 is an Al-Br stretch, specific to terminal Al-Br bonds.
Vibrational modes 15-18 can all be seen in the images to be stretching modes for terminal Al-Br bonds. Across the isomers the motions are the same; 15 - movement of the two aluminium centres towards one pair of terminal atoms then the other; 16 - symmetric stretching of the aluminium atoms towards and away from the centre of the molecule; 17 - wagging of the aluminium centres around the molecule centre; 18 - the same atoms moving concertedly above and below the original plane of the molecule, generating an asymmetric stretch between the terminal halides bonded to each centre. The nature of the these movements, all involving displacement of the aluminium (lightest atom of the molecule) relative to fairly stationary halides represents stretching of the Al-(terminal halide) bonds; an Al-Br stretch should the bromine atoms be terminal as in every isomer except isomer 1. This could be used to justify why stretches 16 and 17 of isomer 1 have zero intensity, however the same pattern of only two peaks is also seen in the spectrum of isomer 4. A lack of peak intensity is a result of symmetry only, isomers 1 & 4 being symmetrical with respect to these motions. It does however explain why the spectrum of isomer 1 shows no peak at 420 cm-1, the peak corresponding to the same vibrational mode at 467 cm-1 has both a higher frequency and lower intensity. As the terminal atoms of isomer 1 are all chlorine atoms it represents Al-Cl bond stretching, these stronger bonds requiring more energy to vibrate, thus the higher peak frequency, the lower intensity because all of the terminal atoms are chlorine as opposed to a mixture of bromine and chlorine atoms, thus the dipole moment is less affected.
- Terminal Al-Br stretching vibrations (isomer.vibration mode)
-
 Isomer 1.15
 -
 Isomer 2.15
 -
 Isomer 3.15
 -
 Isomer 4.15
 -
 Isomer 1.16
 -
 Isomer 2.16
 -
 Isomer 3.16
 -
 Isomer 4.16
 -
 Isomer 1.17
 -
 Isomer 2.17
 -
 Isomer 3.17
 -
 Isomer 4.17
 -
 Isomer 1.18
 -
 Isomer 2.18
 -
 Isomer 3.18
 -
 Isomer 4.18


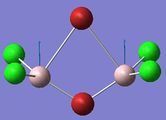
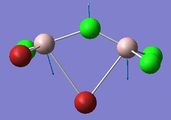
In contrast the modes 11-14 show stretching modes of bridging Al-Br bonds. The first of these comprises oscillation of the aluminium atoms towards and away from each bridging atom, creating an asymmetric stretch in the bonds from each of these halide atoms. For isomers 1, 3 & 4 this peak is not seen on the spectra because it is IR-inactive. The frequency of the stretch increases (from 197, to 211, to 264 cm-1) with isomer number as the amount of bridging-bromine atoms decreases; more energy being necessary to stretch the stronger Al-Cl bonds. The frequency being exactly the same for isomers 3 & 4 confirms that the stretch is related to the bridging atoms, as the only difference between these two isomers is in the positioning of terminal bromine atoms. Within the stretching of the bridging bonds we see a re-ordering for isomer 2, this isomer has modes 12 and 13 reversed so that the motion of vibration 13 corresponds with the motion of vibration 12 in the other isomers, and vice versa. Isomer 2 is the only one to have different bridging atoms, thus this must be the cause. The motion of mode 12 has a larger contribution from stretching of Al-Br bonds (as opposed to Al-Cl) than mode 13, and thus comes lower in energy. Vibration 14, as the images below show quite nicely, again has the same atom displacements in each isomer. Again, the nature of this motion up and down from the original plane of the molecule results in a bend of bonds to the terminal halides, and a stretch/compression. This stretch should appear strongly in each spectrum as all have relatively similar reported intensities, however in the spectra of isomers 3 & 4 the peak is masked by the aforementioned 420 cm-1 stretch. For these two, the stretch is reported at the exact same frequency (412 cm-1), yet again indicating that this stretch is related to the bridging atoms, or a difference would have been noted; isomers 1 &2 which do involve bridging bromine atoms are reported at frequencies lower than 400 cm-1 as the stretching of these bonds requires less energy.
- Bridging Al-Br stretching vibrations (isomer.vibration mode)
-
 Isomer 1.11
 -
 Isomer 2.11
 -
 Isomer 3.11
 -
 Isomer 4.11
 -
 Isomer 1.12
 -
 Isomer 2.12
 -
 Isomer 3.12
 -
 Isomer 4.12
 -
 Isomer 1.13
 -
 Isomer 2.13
 -
 Isomer 3.13
 -
 Isomer 4.13
 -
 Isomer 1.14
 -
 Isomer 2.14
 -
 Isomer 3.14
 -
 Isomer 4.14


MO analysis
| File Type | .log |
| Calculation Type | FREQ |
| Calculation Method | RB3LYP |
| Basis Set | Gen |
| Energy (a.u.) | -2352.41629861 |
| Gradient (a.u.) | 0.00000413 |
| Dipole Moment (Debye) | 0.00 |
| Point Group | C1 |
| Calculation Time (min, s) | 1, 14 |
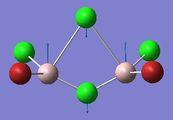
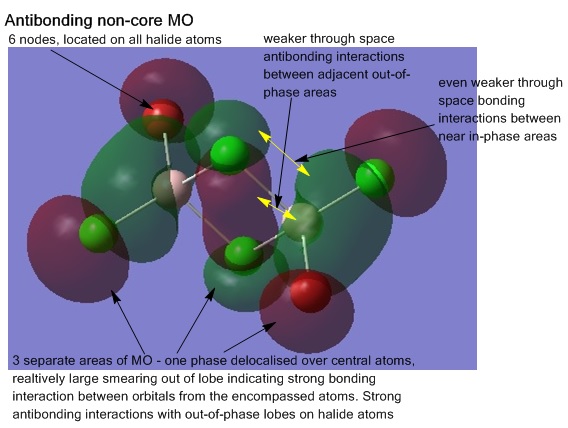
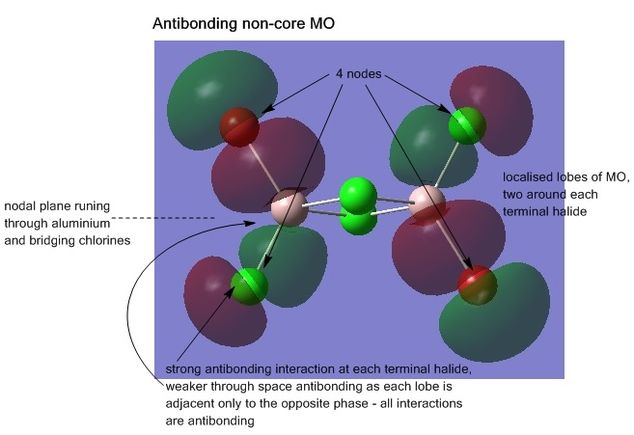
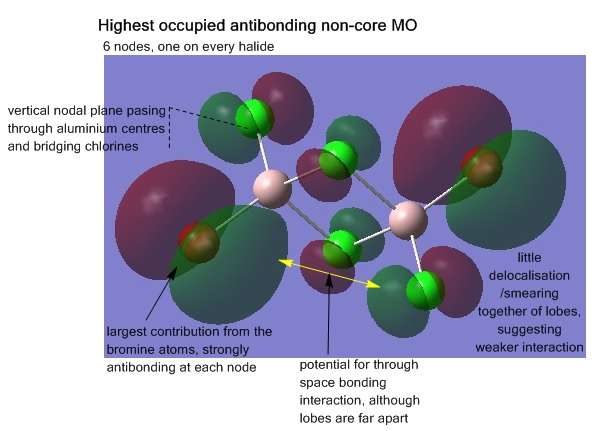
Analysis of the molecular orbitals was also conducted, visualising the MOs shows how the atomic orbitals of each atom of the structure are interacting and combining. For the lowest energy isomer, all the non-core occupied MOs (core orbitals identified as those smeared over areas of the molecule as opposed to localised on atoms where the original atomic orbital originally came from), 31-54 were visualised. The energy jump from MO 30 to 31 helping to indicate where the break between core and non-core orbitals is. Five MOs from this range were chosen for further analysis; MOs 31, 38, 41, 45, and 54, are shown below, the interactions explained. The output file from the Gaussian calculation can be found here, and the D-space link[17].
Item               Value     Threshold  Converged?
 Maximum Force            0.000005     0.000450     YES
 RMS     Force            0.000003     0.000300     YES
 Maximum Displacement     0.000265     0.001800     YES
 RMS     Displacement     0.000089     0.001200     YES
 Predicted change in Energy=-1.202490D-09
 Optimization completed.
    -- Stationary point found.
- Further analysis of occupied non core MOs
-
 MO 31
MO 31 -
 MO 38
MO 38 -
 MO 41
MO 41 -
 MO 45
MO 45 -
 MO 54
MO 54


References
- ↑ B. Reffy, M. Kolonits and M. Hargittai, Journal of Molecular Structure, 1998, 445, 139. DOI:10.1016/S0022-2860(97)00420-1
- ↑ Caroline Welch, D-space, DOI:10042/27613
- ↑ Caroline Welch, D-space, DOI:10042/27620
- ↑ Caroline Welch, D-space, DOI:10042/27623
- ↑ M. Matus, D. Grant, M. Tho-Nguyen and D. Dixon, J. Phys. Chem. C, 2009, 113, 16553. DOI:10.1021/jp905318y
- ↑ Caroline Welch, D-space, DOI:10042/27700
- ↑ Caroline Welch, D-space, DOI:10042/27702
- ↑ Caroline Welch, D-space, DOI:10042/27703
- ↑ Caroline Welch, D-space, DOI:10042/27704
- ↑ W. Brown, C. Foote, I. Iverson and E. Anslyn, Organic Chemistry, 6, Cengage Learning, California, 2012
- ↑ Caroline Welch, D-space, DOI:10042/27705
- ↑ Caroline Welch, D-space, DOI:10042/27761
- ↑ Caroline Welch, D-space, DOI:10042/27707
- ↑ Caroline Welch, D-space, DOI:10042/27708
- ↑ Caroline Welch, D-space, DOI:10042/27722
- ↑ Caroline Welch, D-space, DOI:10042/27710
- ↑ Caroline Welch, D-space, DOI:10042/27745