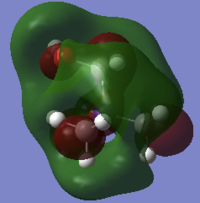
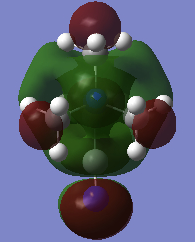
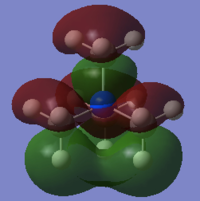
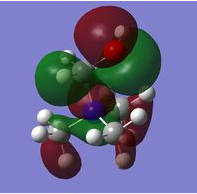
Rep:Mod:cvbn603plm
Optimising a molecule
Optimisation of BH3 molecule
The BH3 molecule was optimised using two basis: 3-21G and 6-31G. The symmetry of the molecule was broken initially by manually setting the B-H bond lengths to be 1.53, 1.54 and 1.55 Å respectively. This is to ensure that a global minimum is calculated by Gaussian so that a true optimisation is achieved.
3-21G Basis Set
BH3 molecule was built using GaussView and optimised with 3-21G (B3LYP). The calculated results were tabulated below.
| Property | Value |
|---|---|
| File Type | .log |
| Calculation Type | FOPT |
| Calculation Method | RB3LYP |
| Basis Set | 3-21G |
| Final Energy / a.u. | -26.46226429 |
| Gradient / a.u. | 0.00008851 |
| Dipole Moment / Debye | 0.00 |
| Point Group | CS |
| Time Taken for Calculation / s | 33.6 |
The following table indicated that optimisation was successful.
         Item               Value     Threshold  Converged?
 Maximum Force            0.000220     0.000450     YES
 RMS     Force            0.000106     0.000300     YES
 Maximum Displacement     0.000709     0.001800     YES
 RMS     Displacement     0.000447     0.001200     YES
 Predicted change in Energy=-1.672479D-07
 Optimization completed.
As seen from Table. 1, symmetry CS was obtained instead of the expected D3h. This was because Gaussian requires very accurate numbers to achieve the right point group.
6-31G (d,p) Basis Set
The log file of 3-21G optimised molecule was used as the input for the 6-31G(d,p) optimisation. This is a higher level basis set and its calculations provide a more accurate representation of the structure of the molecule.

| Property | Value |
|---|---|
| File Type | .log |
| Calculation Type | FOPT |
| Calculation Method | RB3LYP |
| Basis Set | 6-31G(d,p) |
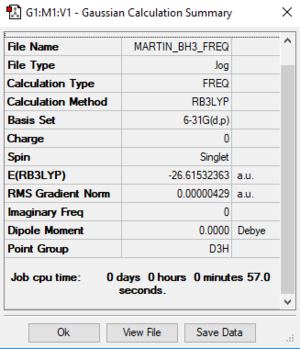
| Final Energy / a.u. | -26.61532362 |
| Gradient / a.u. | 0.00000706 |
| Dipole Moment / Debye | 0.00 |
| Point Group | CS |
| Time Taken for Calculation / s | 15.5 |
The following table indicated that optimisation was successful.
         Item               Value     Threshold  Converged?
 Maximum Force            0.000012     0.000450     YES
 RMS     Force            0.000008     0.000300     YES
 Maximum Displacement     0.000061     0.001800     YES
 RMS     Displacement     0.000038     0.001200     YES
 Predicted change in Energy=-1.068816D-09
 Optimization completed.
A comparison between the results showed that although the B-H bond lengths and H-B-H bond angles appear to be the same at an accuracy of two decimal places (or one decimal place for bond angles), the values differ slightly at higher accuracy (refer to .log files). The B-H bond lengths calculated with the 6-31G basis set gave a smaller value that is closer to the literature value of 1.19 Å [1]. Bond angle calculated with the 3-21G basis set deviated more from 120.0°. Therefore, it can be concluded that the 6-31G (d,p) basis set produce more accurate results than the 3-21G basis set.
Using pseudo-potentials and larger basis sets
The calculation of properties using basis set for larger molecules with more electrons has its limitations. Larger basis set calculations can be used but it is computationally very expensive. Instead, pseudo-potentials are introduced to replace the complicated effects arising from the motion of the core electrons and nucleus of an atom by an effective potential. [2] This is based on the assumption that only the valence electrons contribute to bonding interactions. In this section, GaBr3 was used to examine the accuracy of calculations using pseudo-potentials.
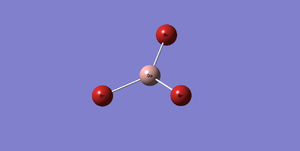
GaBr3 molecule was built in a similar way as BH3 using GaussView and optimised with LanL2DZ (B3LYP). Symmetry of the molecule was restricted to D3h (very tight: 0.0001). The results from calculation were tabulated below.
| DOI:10042/27933 | |
| Property | Value |
|---|---|
| File Type | .log |
| Calculation Type | FOPT |
| Calculation Method | RB3LYP |
| Basis Set | LANL2DZ |
| Final Energy / a.u. | -41.70082783 |
| Gradient / a.u. | 0.00000016 |
| Dipole Moment / Debye | 0.00 |
| Point Group | D3h |
| Time Taken for Calculation / s | 17.3 s |
The following table indicated that optimisation was successful.
         Item               Value     Threshold  Converged?
 Maximum Force            0.000000     0.000450     YES
 RMS     Force            0.000000     0.000300     YES
 Maximum Displacement     0.000003     0.001800     YES
 RMS     Displacement     0.000002     0.001200     YES
 Predicted change in Energy=-1.282681D-12
 Optimization completed.
The Ga-Br bond length of GaBr3 molecule quoted in literature is 2.239 Å [3]. The calculated value is slightly different, though still in good agreement with the literature. It could be improved by using a larger basis set. The Br-Ga-Br bond angle calculated is exactly 120.0° due to the restriction of D3h symmetry. Overall, it can be concluded that calculations with pseudo-potentials still give a relatively accurate results for large molecules.
Using a mixture of basis-sets and pseudo-potentials
It has been demonstrated above that the use of basis sets works well for calculation of properties of small atoms, whereas the pseudo-potentials give a more accurate calculations for larger atoms. In the case of BBr3 here, a combination of basis sets and pseudo-potentials were used, i.e. a 6-31G(d,p) calculation for small B atom and a LanL2DZ pseudo-potential calculation for heavier Br atoms. It was built in a similar way as GaBr3 on GaussView and sent for calculations on HPC with basis sets and pseudo-potentials specified. The results obtained were tabulated below.

| DOI:10042/27934 | |
| Property | Value |
|---|---|
| File Type | .log |
| Calculation Type | FOPT |
| Calculation Method | RB3LYP |
| Basis Set | Gen |
| Final Energy / a.u. | -64.43645388 |
| Gradient / a.u. | 0.00000943 |
| Dipole Moment / Debye | 0.00 |
| Point Group | CS |
| Time Taken for Calculation / s | 38.8 |
| B-Br Bond Length | 1.93 Å |
| Br-B-Br Bond Angle | 120.0° |
The following table indicated that optimisation was successful.
         Item               Value     Threshold  Converged?
 Maximum Force            0.000016     0.000450     YES
 RMS     Force            0.000010     0.000300     YES
 Maximum Displacement     0.000067     0.001800     YES
 RMS     Displacement     0.000040     0.001200     YES
 Predicted change in Energy=-1.574158D-09
 Optimization completed.
The calculated B-Br bond length is slightly different, though still in good agreement with the literature value of 1.903 Å [4]. Br-B-Br bond angle of 120.0° indicates that the molecule has a D3h symmetry. This shows that the use of a combination of basis sets and pseudo-potentials for calculations produce accurate results.
Structural analysis of BH3, GaBr3 and BBr3
All of the three molecules have a trigonal planar structure with D3h symmetry and three 2c-2e bonds between the central atom and the ligands.
| BH3 | GaBr3 | BBr3 | ||||||||||
|---|---|---|---|---|---|---|---|---|---|---|---|---|
|
|
| ||||||||||
| Bond length / Å | 1.19 | 2.35 | 1.93 | |||||||||
| Bond angle / ° | 120.0 | 120.0 | 120.0 |
The effect of changing ligands can be observed by comparing the bond lengths between B-H and B-Br. From the table above, the B-Br bond is much longer than the B-H bond. This can be rationalised by the difference in sizes of the atoms. Both Br and H require one electron to achieve stable octet/duplet configuration. However, Br atom has an electronic configuration of [Ar]3d104s24p5 and is much larger than the H atom with an electronic configuration of 1s1. The radial distribution function suggests that the 4p valence orbital is more diffused and further away from the attraction of the nucleus, leading to weaker and longer bond between B and Br. Conversely, the 1s orbital is close to the nucleus, and thus the B-H bond is much stronger and shorter.
From the MO perspective, the difference in electronegativity between B and Br is 0.92 whereas that between B and H is 0.16. Larger difference in electronegativity would mean that the energy gap between the corresponding atomic orbitals of B and Br is larger in the MO diagram. This results in lower stabilisation energy of the resultant bonding molecular orbital. Electrons in this orbital would therefore have higher energy and are less attracted to the nucleus. As such, the B-Br bond is weaker and longer than the B-H bond.
Upon comparison of the bond lengths between Ga-Br and B-Br, the effect of changing the central atom can be observed. The Ga-Br bond is longer than the B-Br bond. This can be explained by the same reasons above. Ga atom (electronic configuration: [Ar]3d104s24p1) is larger than B atom (electronic configuration: [He]2s22p1). The 4p valence orbital is more diffused and further away from the nucleus, leading to longer Ga-Br bond. 2p valence orbital, on the other hand, is closer to the nucleus. Therefore, the B-Br bond is shorter.
Similarly, the difference in bond lengths (and bond strengths) can be explained from the MO perspective. Both Ga and B are from Group 13. However, Ga is lower down in the group with smaller electronegativity. Therefore, the difference in electronegativity between Ga and Br is larger, and this would result in greater energy mismatch between the atomic orbitals. The Ga-Br bond is thus longer and weaker as compared to the B-Br bond.
Interpretation of a bond in GaussView
It is observed that in some cases where a bond is expected between two atoms, GaussView does not draw the bond if the distance between the two atoms exceeds a certain value. This pre-defined parameter (believed to be the sum of van der Waal's radii of the two atoms) is the criterion for bond definition in GaussView. Within this given distance, the software recognises that there is covalent interaction between the two atoms, and therefore a bond is drawn. However, this does not necessarily mean that there is no bond or interaction between the atoms when the inter-atomic distance exceeds the parameter.
A bond is an attractive force that binds atoms together to form a molecule. It is caused by the electrostatic force of attraction and has a stabilising effect. Chemical bonds can be categorised into strong bonds (e.g. ionic, covalent and metallic bonds) and weak bonds (dipole-dipole interaction, hydrogen-bonding and dispersion force). In the case of a covalent bond between two atoms, the valence electrons from both atoms are attracted to both nuclei. This attractive force balances the repulsion between the shared electrons to achieve a stable configuration. Conventionally, a line is used to depict two shared electrons (one from each atom) and this is used in Gaussian. However, it is noteworthy that this representation of bond using line is simply an aid in visualising how atoms interact with one another to form a molecule. A bond is indeed a region that forms when the valence electrons from different atoms interact with each other and cannot be "seen" in actual molecules. For instance, in metallic bonding, this region refers to the force of attraction between metallic cations and the "sea of delocalised electrons". This interaction cannot be represented by the conventional line. Another example would be electrostatic (or ionic) bonds between two oppositely charged ions. This type of bonding arises from the complete transfer of electrons from one atom to another, and the conventional line representation would not provide an accurate illustration of it.
Weaker intermolecular interactions exist too. An example would be the hydrogen bonding between a highly electronegative atom (N, O or F) and H atoms directly attached to another highly electronegative atom (N, O or F). It is often represented using dotted line between the atoms involved in interaction.
Frequency analysis
Frequency analysis was carried out on BH3 and GaBr3 using frequency calculations on Gaussian, the results were then compared against each other. Simulated IR spectra of the computed molecules were generated too.
Frequency analysis of BH3
Frequency analysis of BH3 was carried out on BH3 on Gaussian. Symmetry of the molecule was restricted to D3h with very tight tolerance of 0.0001. Optimisation and frequency analysis were done with the 6-31G(d,p) basis set. Results obtained were tabulated below.
| Optimisation | Frequency | |
|---|---|---|
| File Type | .log | .log |
| Calculation Type | FOPT | FREQ |
| Calculation Method | RB3LYP | RB3LYP |
| Basis Set | 6-31G(d,p) | 6-31G(d,p) |
| Final energy/a.u. | -26.61532363 | -26.61532363 |
| Gradient/a.u. | 0.00000296 | 0.00000291 |
| Dipole Moment/Debye | 0.00 | 0.00 |
| Point Group | D3h | D3h |
| Time Taken for Calculation / s | 7.0 | 5.0 |
Item Value Threshold Converged? Maximum Force 0.000006 0.000450 YES RMS Force 0.000004 0.000300 YES Maximum Displacement 0.000023 0.001800 YES RMS Displacement 0.000015 0.001200 YES Predicted change in Energy=-2.008851D-10 Optimization completed. |
Item Value Threshold Converged? Maximum Force 0.000006 0.000450 YES RMS Force 0.000003 0.000300 YES Maximum Displacement 0.000023 0.001800 YES RMS Displacement 0.000011 0.001200 YES Predicted change in Energy=-1.996524D-10 Optimization completed. |
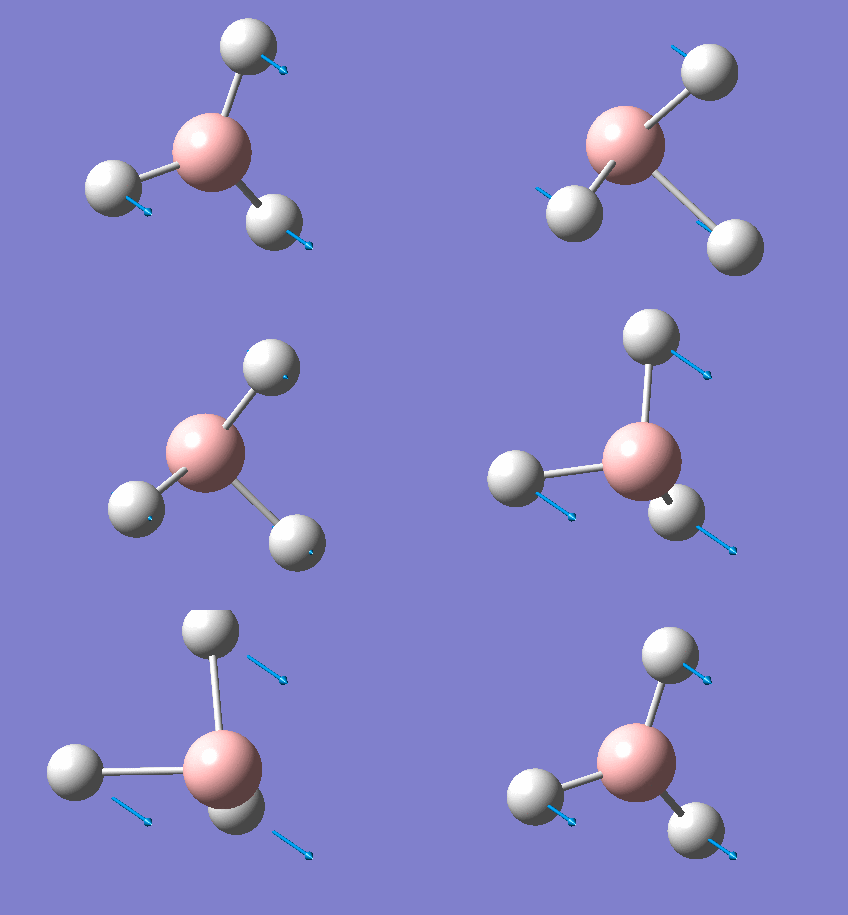
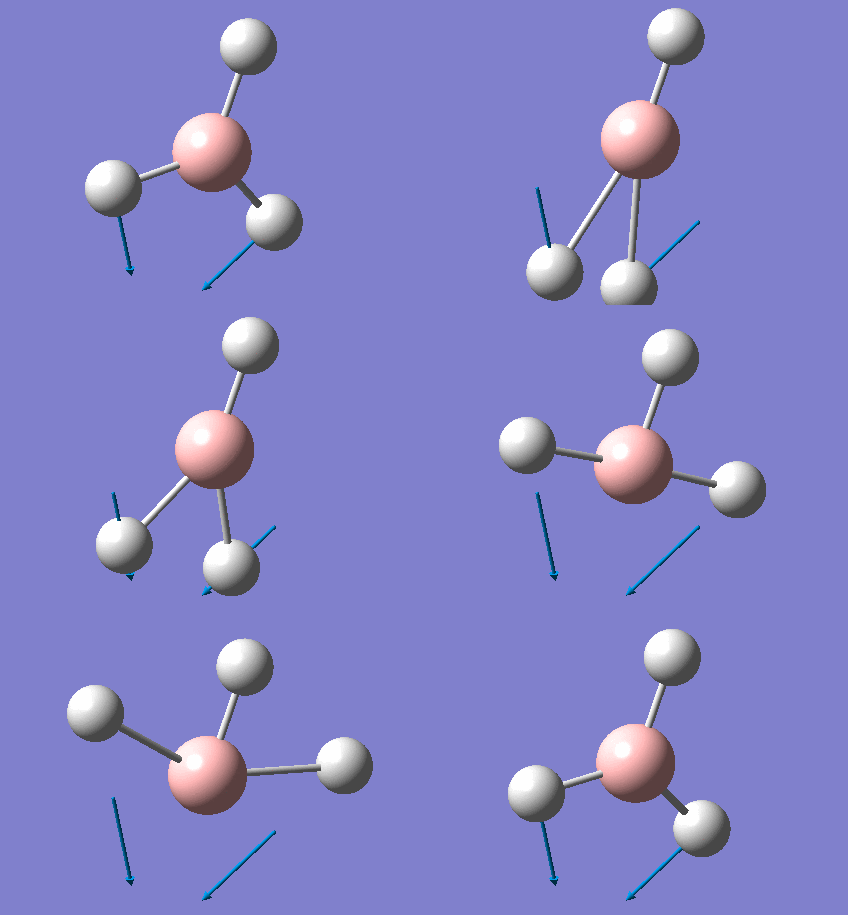
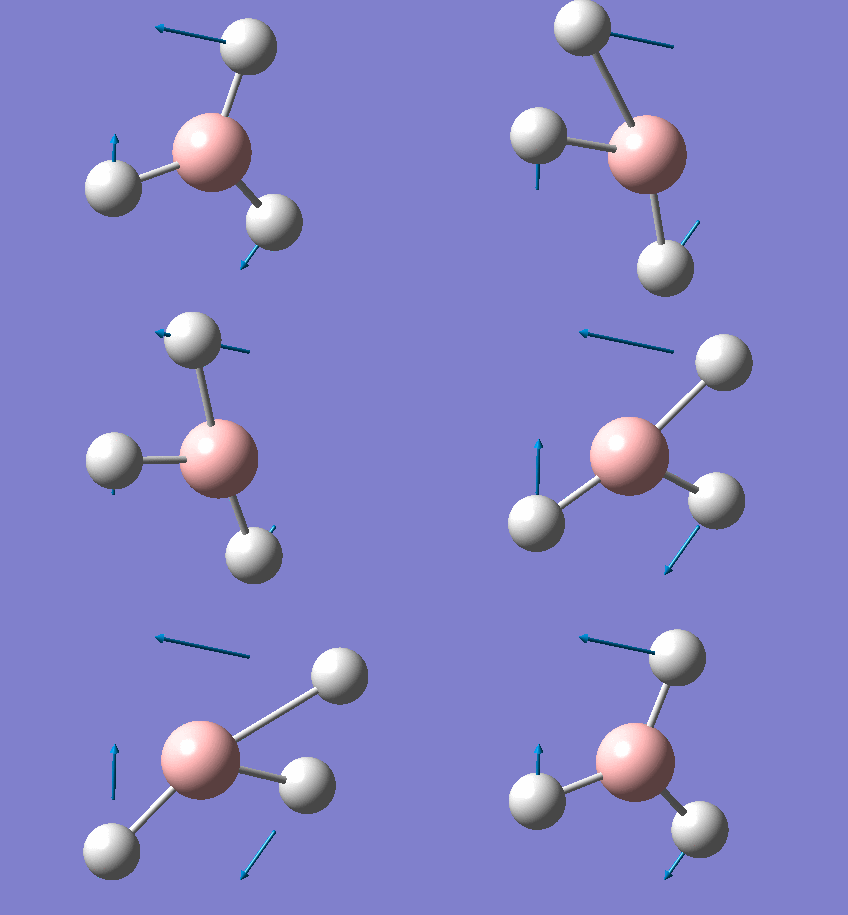
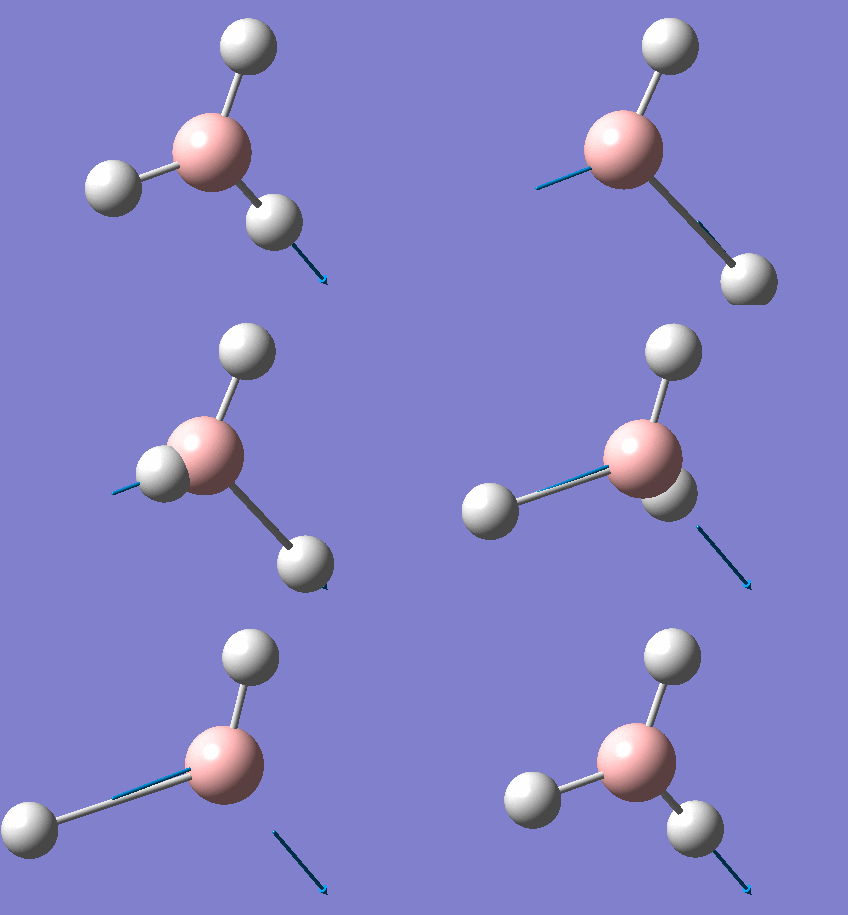
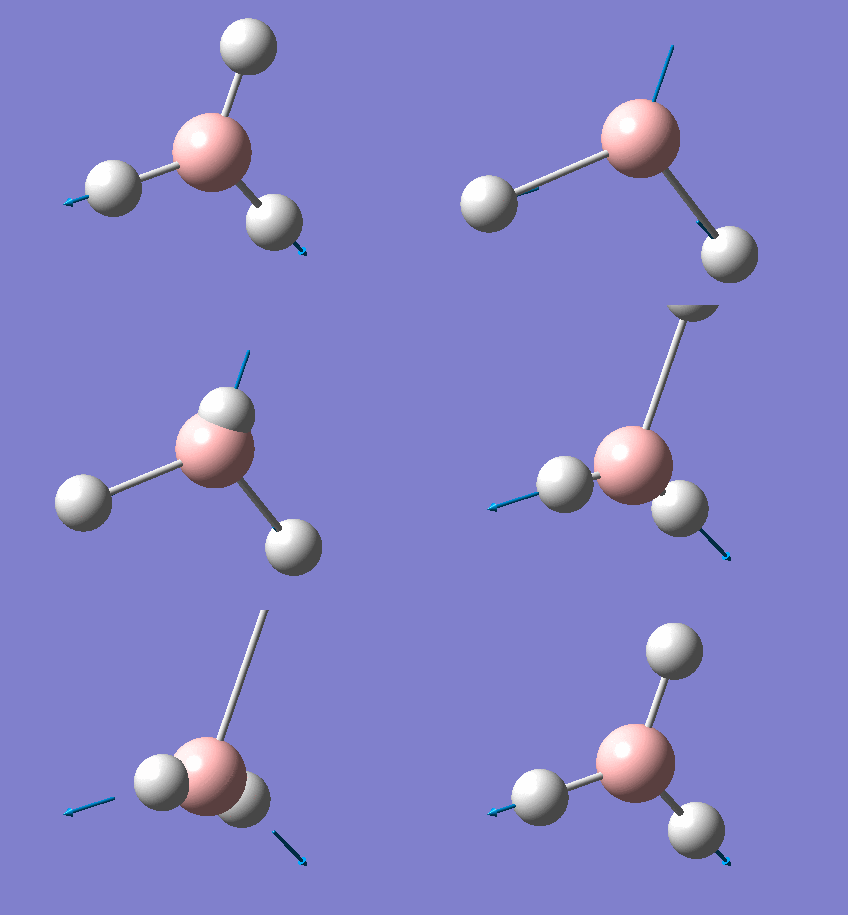
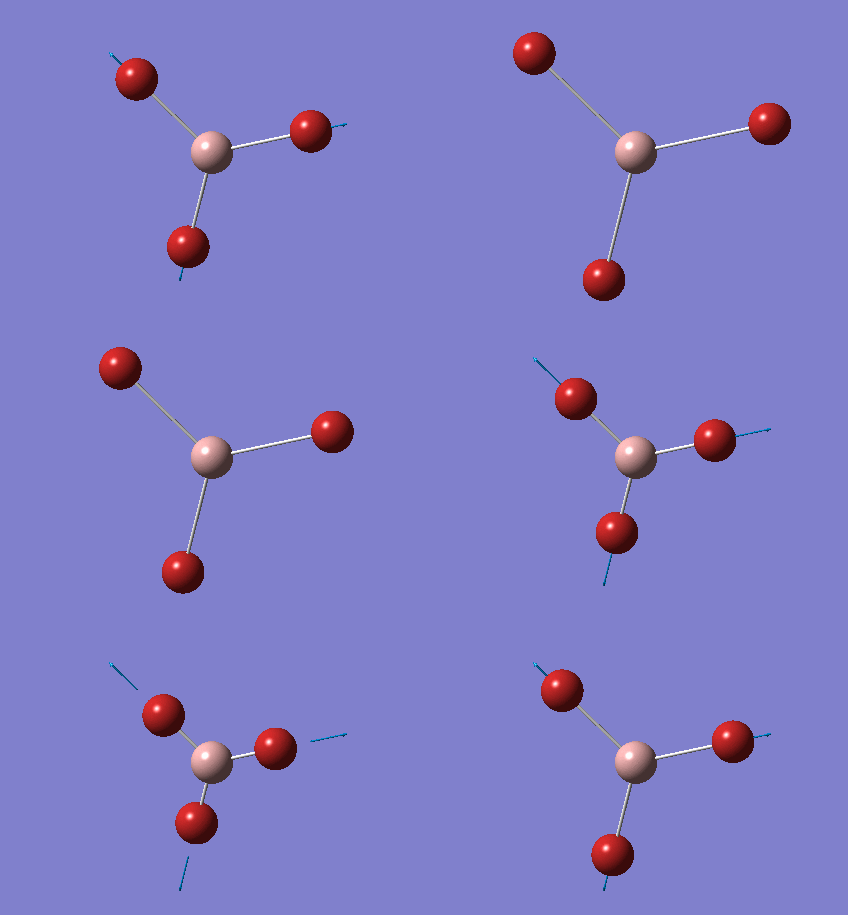
A summary of the vibrational modes of BH3 was tabulated below.
From the tabulated results above, 6 vibrational modes were observed. According to Equation 2 below (non-linear molecules), where N = 4 for BH3, number of vibrational modes = 6. This agrees with the calculated results from Gaussian.
The computed IR spectrum is shown below.

Instead of the 6 vibrational modes (and thus 6 peaks) expected, only 3 peaks were observed. This could be due to two reasons.
- IR spectroscopy only captures vibrational mode with a resultant dipole moment. Symmetrical stretching of the B-H bonds at 2582 cm-1 results in dipole moments cancelling out each other, giving an overall 0 resultant dipole moment (as seen in Table 6). Therefore, this vibrational frequency is not IR active.
- Degeneracy of vibrational modes results in less number of peaks being observed. As seen from Table 6, two pairs of vibrations (2 and 3, 5 and 6) are degenerate and would therefore only show up as 2 peaks on the spectrum.
Frequency analysis of GaBr3
Similarly, frequency analysis of GaBr3 was carried out on the optimised (LanL2DZ, D3h symmetry restricted) molecule.
| DOI:10042/27933 | |
| Property | Value |
|---|---|
| File Type | .log |
| Calculation Type | FREQ |
| Calculation Method | RB3LYP |
| Basis Set | LANL2DZ |
| Final Energy / a.u. | -41.70082783 |
| Gradient / a.u. | 0.00000011 |
| Dipole Moment / Debye | 0.00 |
| Point Group | D3H |
| Time Taken for Calculation /s | 5.0 |
The table below indicated that optimisation was completed.
         Item               Value     Threshold  Converged?
 Maximum Force            0.000000     0.000450     YES
 RMS     Force            0.000000     0.000300     YES
 Maximum Displacement     0.000002     0.001800     YES
 RMS     Displacement     0.000001     0.001200     YES
 Predicted change in Energy=-6.142863D-13
 Optimization completed.
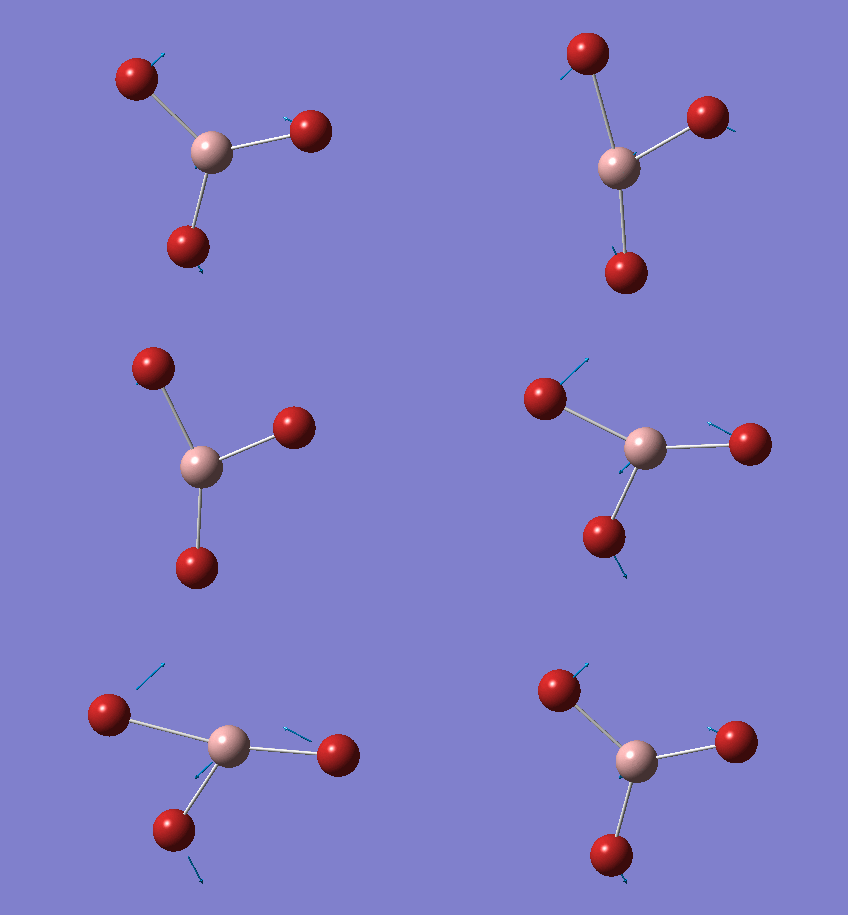
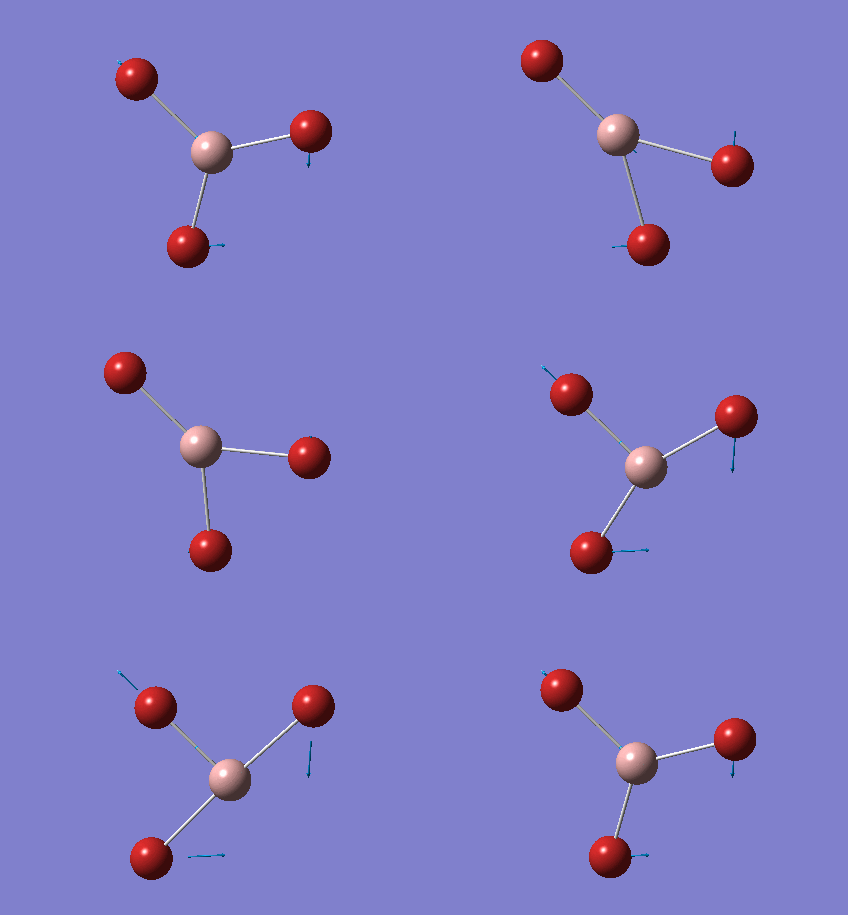
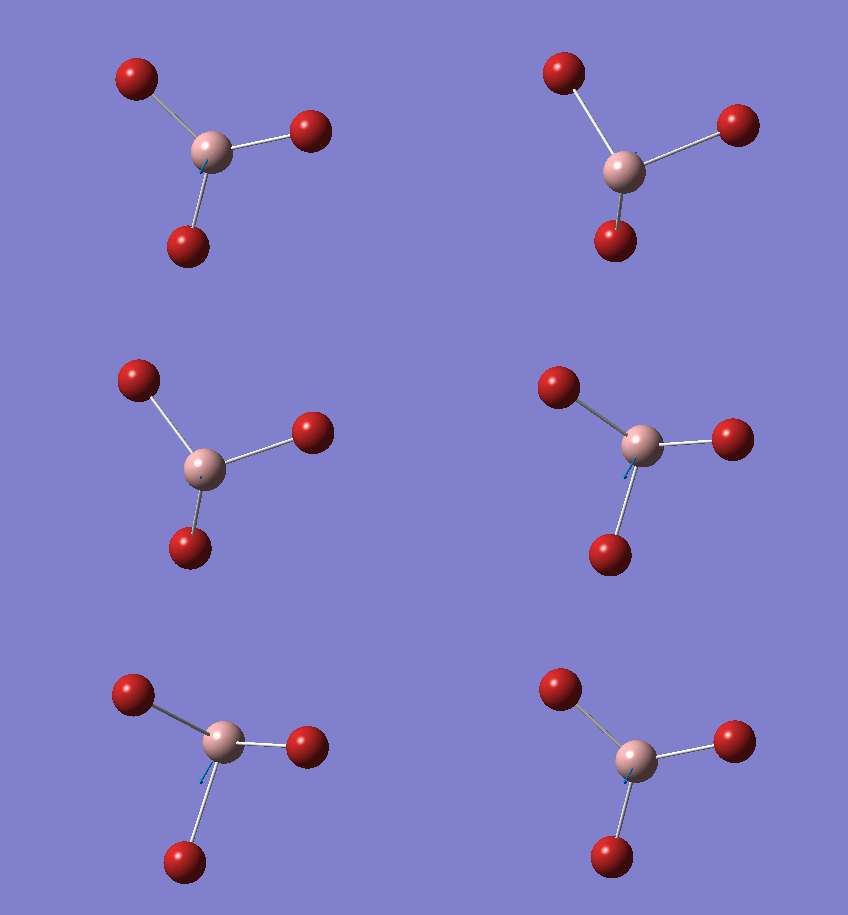
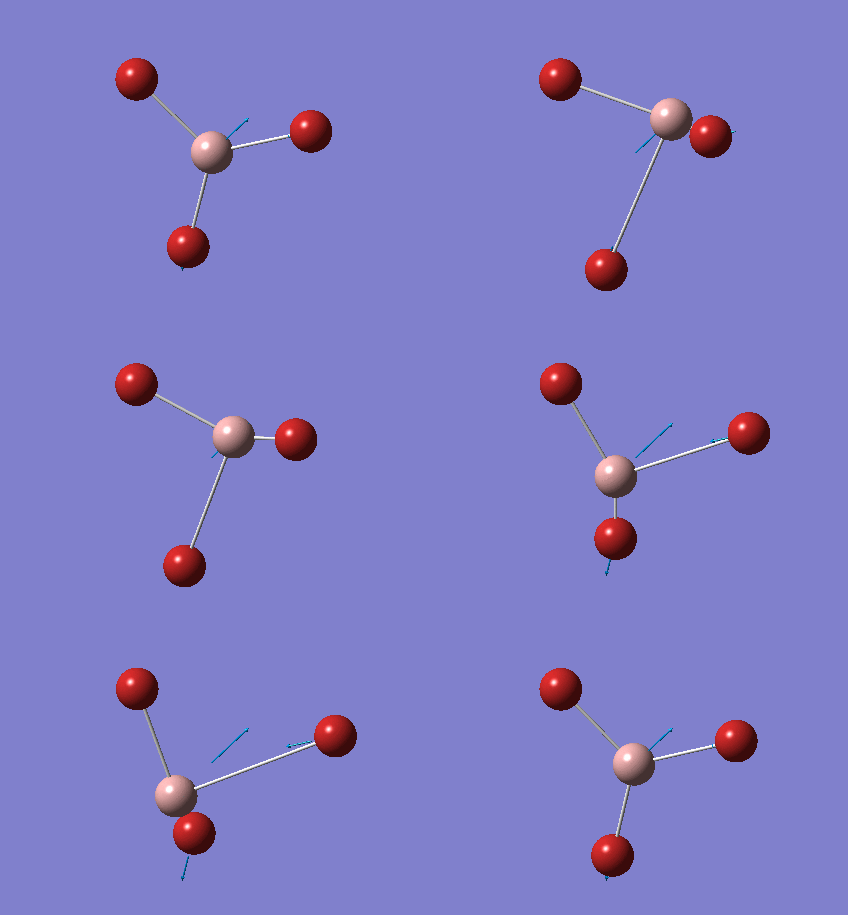
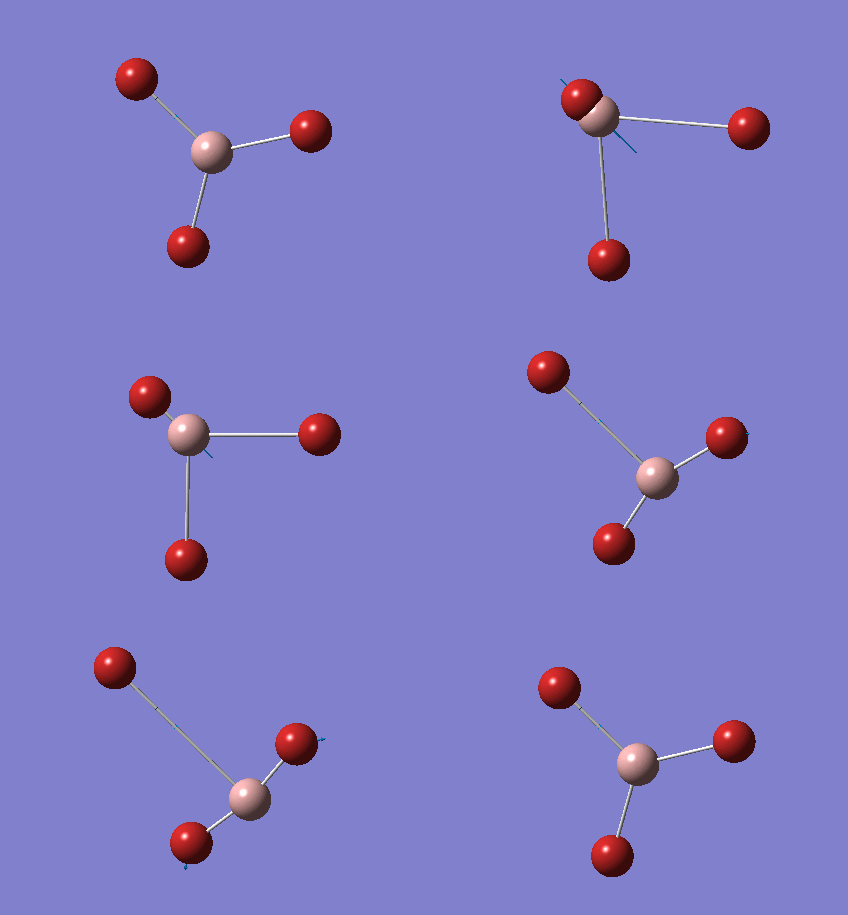
The various vibrational modes were tabulated below.
IR spectrum of GaBr3 was generated in a similar way and was shown in the figure below.
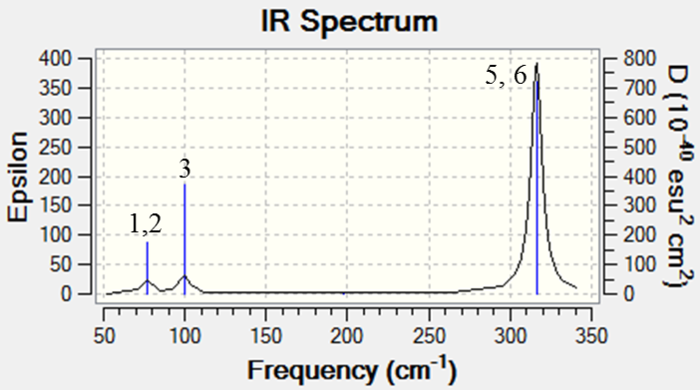
Similar to BH3, number of vibrational modes of GaBr3 = 3(4) - 6 = 6. However, only 3 peaks were observed. This could be due to the same reasons as above. 1 and 2, 5 and 6 are degenerate and 4 being IR inactive as a result of symmetrical stretching of Ga-Br bonds, leading to a resultant 0 dipole moment.
Comparison of frequencies of BH3 and GaBr3
The vibrational modes of the two molecules were compared. A summary was tabulated below.
| No. | Vibrational frequencies of BH3 / cm-1 | Vibrational frequencies of GaBr3 / cm-1 |
|---|---|---|
| 1 | 1163 | 76 |
| 2 | 1213 | 76 |
| 3 | 1213 | 100 |
| 4 | 2582 | 197 |
| 5 | 2715 | 316 |
| 6 | 2715 | 316 |
Both IR spectra have three peaks even though six peaks were expected. As discussed above, this is due to vibrational mode degeneracy as well as IR inactiveness (zero intensity) of the peaks. It can also be seen that the modes with A2" and E' symmetry lie closely together in the low energy region, whereas those with A1' and E' symmetry lie closely together in the high energy region. It is in fact that the modes in the low energy region (A2" and E') correspond to the vibrational modes associated with the bending motion of the bonds while those in the high energy region (A1' and E') correspond to the vibrational modes associated with the stretching motion of the bonds. It can thus be concluded that stretching is higher in energy than bending.
However, the large difference in the frequencies (and intensities) of the vibrational modes of the two molecules is due to the difference in mass of the two molecules. According to Equation 3, BH3 has a smaller reduced mass than GaBr3, and would therefore have a higher vibrational frequency. As the frequencies correspond to vibrational energies, a higher vibrational frequency indicates that BH3 has a higher vibrational energy.
A reordering of the vibrational modes of the two spectra can also be observed. In BH3, the A2" level is higher in energy than the E' level, whereas in GaBr3, the opposite is observed (E' energy level is higher than A2" energy level). This reordering of the vibrational modes could be due to the difference in mass of the atoms. For instance, in the BH3 molecule, H atoms are light as compared to the B atom, and would therefore appear to vibrate more vigorously in the A2" level. Conversely, in the GaBr3 molecule, Br ligands are heavier than the central Ga atom, and would therefore stay relatively stationary in the A2" level.
Mathematically, optimisation simply corresponds to the first derivative of the potential energy surface of the molecule, whereas frequency analysis is to the second derivative of the same molecular potential energy surface. The optimisation and frequency analysis must be carried out using the same method and basis set. The potential energy surface obtained from optimisation is used for frequency analysis. As such, a consistency in the method and basis set used for calculation is necessary to ensure that the second derivation step (frequency analysis) is based on the same function as the first derivation step (optimisation).
As discussed above, a gradient = 0 from the optimisation only suggests that the point obtained is either a turning point, maxima or minima. Frequency analysis (second derivation) is necessary to ensure that the optimised structure is a minima. From the mathematical perspective, a positive second derivative would suggest that a minima is obtained from the optimisation calculation and that the structure is at equilibrium. If the second derivation is negative, this would mean that a maxima is obtained from the optimisation calculation. This structure depicts the transition state of the reaction instead.
The first line of the low frequencies represents the rotational and translational motion in x, y and z axes. The second line of the low frequencies corresponds to the vibrational frequencies.
Molecular orbitals of BH3
Population analysis allows a qualitative comparison with the approximate molecular orbitals (MOs) drawn using a MO diagram. A population analysis was carried out on the previously optimised (with 6-31G(d,p) basis set) BH3 molecule, the MOs were computed and visualised on GaussView.
Population analysis was carried out on the BH3 molecule with tight convergence criteria. This was to ensure that the degenerate pairs of MOs have the same energies.
| Property | Value |
|---|---|
| File Type | .log |
| Calculation Type | SP |
| Calculation Method | RB3LYP |
| Basis Set | 6-31G(d,p) |
| Final energy / a.u. | -26.61532363 |
| Gradient / a.u. | 0.00000000 |
| Dipole Moment / Debye | 0.00 |
| Point Group | D3h |
| Time Taken for Calculation / s | 7.0 |
The MO diagram with computed MOs of BH3 was illustrated below.
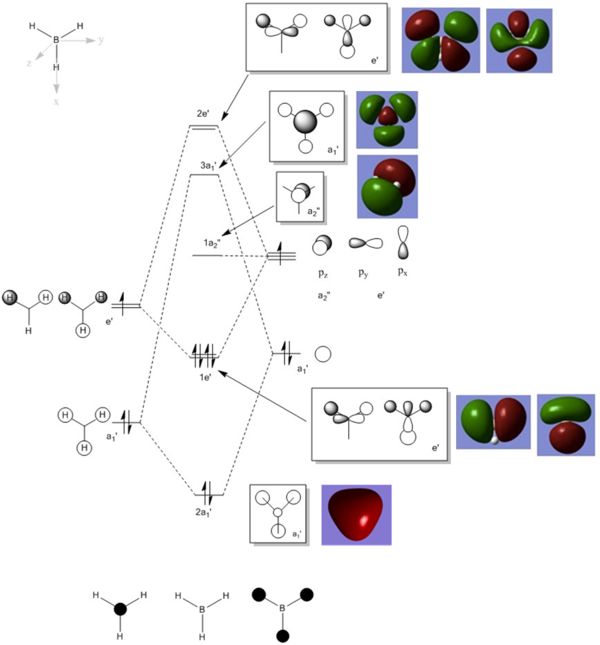
From the diagram above, it can be observed that the computed MOs are very similar to the qualitatively derived MOs from the MO diagram. The derived MOs were obtained from superimposing the corresponding fragment orbitals, while the computed MOs show the resultant distribution of the superimposed fragment orbitals.
Natural bond orbital (NBO) analysis of NH3
Optimisation and frequency analysis

| Optimisation | Frequency | |
|---|---|---|
| File Type | .log | .log |
| Calculation Type | FOPT | FREQ |
| Calculation Method | RB3LYP | RB3LYP |
| Basis Set | 6-31G(d,p) | 6-31G(d,p) |
| Final Energy/a.u. | -56.55776863 | -56.55776856 |
| Gradient/a.u. | 0.00000289 | 0.00000279 |
| Dipole Moment/Debye | 1.84 | 1.84 |
| Point Group | C3V | C3 |
| Time Taken for Calculation / s | 8.0 | 7.0 |
Item Value Threshold Converged? Maximum Force 0.000005 0.000450 YES RMS Force 0.000003 0.000300 YES Maximum Displacement 0.000010 0.001800 YES RMS Displacement 0.000007 0.001200 YES Predicted change in Energy=-7.830251D-11 Optimization completed. |
             Item               Value     Threshold  Converged?
 Maximum Force            0.000005     0.000450     YES
 RMS     Force            0.000003     0.000300     YES
 Maximum Displacement     0.000012     0.001800     YES
 RMS     Displacement     0.000006     0.001200     YES
 Predicted change in Energy=-8.435065D-11
 Optimization completed.
Low frequencies --- 0.0411 -0.0144 0.0005 1.6412 1.6437 2.4682 Low frequencies --- 1089.2851 1693.9239 1693.9239 |
NBO analysis
NBO analysis was carried out on the optimised NH3. This was done by examining the charge distribution of the molecule. The figure below illustrated the NH3 molecule characterised by both the colours representing the charge distribution as well as the relative charge numbers.
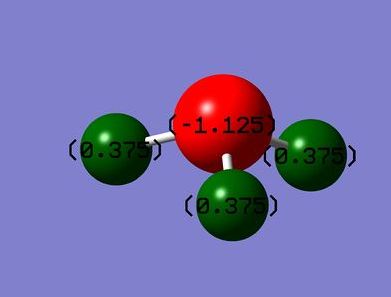
In the figure above, red (on N atom) indicates a region of high charge density while green (on H atoms) indicates a region of low charge density. This agrees with theory that nitrogen is more electronegative, therefore drawing more electron density to itself, whereas hydrogen, being less electronegative here as compared to nitrogen, has lower electron density. The numbers on the atoms represent the charge range (-1.125 to 1.125). -1.125 represents a region of high electron density while 1.125 represents a region of low electron density. It is apparent that the charges add up to zero, once again agreeing with theory that NH3 is a neutral molecule.
Association energies of NH3BH3
Finally, association energies of the NH3BH3 adduct was studied.
Optimisation and frequency analysis
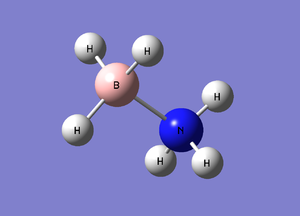
NH3BH3 was built in a similar way on GaussView, and was optimised (6-31G(d,p) basis set) with tight convergence criteria to allow a comparison of reactants and products later. Frequency analysis was done in a similar manner on Gaussview and results from the calculations were tabulated below.
| Optimisation | Frequency | |
|---|---|---|
| File Type | .log | .log |
| Calculation Type | FOPT | FREQ |
| Calculation Method | RB3LYP | RB3LYP |
| Basis Set | 6-31G(d,p) | 6-31G(d,p) |
| Final Energy/a.u. | -83.22468906 | -83.22468908 |
| Gradient/a.u. | 0.00000124 | 0.00000125 |
| Dipole Moment/Debye | 5.56 | 5.56 |
| Point Group | C1 | C1 |
| Time Taken for Calculation / s | 54 | 29 |
Item Value Threshold Converged? Maximum Force 0.000002 0.000015 YES RMS Force 0.000001 0.000010 YES Maximum Displacement 0.000026 0.000060 YES RMS Displacement 0.000009 0.000040 YES Predicted change in Energy=-8.957513D-11 Optimization completed. |
             Item               Value     Threshold  Converged?
 Maximum Force            0.000004     0.000450     YES
 RMS     Force            0.000001     0.000300     YES
 Maximum Displacement     0.000026     0.001800     YES
 RMS     Displacement     0.000010     0.001200     YES
 Predicted change in Energy=-1.106803D-10
 Optimization completed.
Low frequencies --- -2.6405 -1.6489 -0.0014 -0.0009 0.0007 4.0744 Low frequencies --- 263.4621 632.9593 638.4302 |
Association energy of NH3BH3
Energies of the optimised molecules (6-31G(d,p) basis set) with tight convergence criteria were tabulated below and compared.
| Molecule | NH3 | BH3 | NH3BH3 |
|---|---|---|---|
| Final Energy / a.u. | -56.55776863 | -26.61532363 | -83.22468906 |
For the association reaction, NH3 (g) + BH3 (g) → NH3BH3 (g)
Difference in energy, ΔE = ΣE (products) - ΣE (reactants) = -0.0515968 Hartrees = -135 kJ mol-1
The negative sign implies that the association reaction is exothermic and energetically favourable. Conversely, the reverse dissociation reaction of NH3BH3 (g) → NH3 (g) + BH3 (g) is endothermic and energetically unfavourable.
Comparing the bond energies of the N-B (135 kJ mol-1) with a typical C-C bond (347 kJ mol-1) reveals that the N-B bond is of a much lower energy (i.e. weaker). This can be rationalised by the dative nature of this bond. As discussed above, Gaussian defines a bond when there is covalent interaction between two atoms within a pre-defined distance, it does not differentiate between a covalent and a dative bond. The low bond energy can be explained by the electron withdrawing effect of nitrogen. N is highly electronegative as compared to B and thus withdraws electron density to itself. It is therefore less favourable for it to donate its lone pair into the vacant orbital on B, resulting in a weak bond formed.
Comparison of selected "onium" cations
Optimisation and frequency analysis of [N(CH3)4]+, [P(CH3)4]+ and [S(CH3)3]+
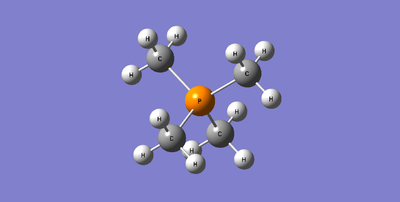
The three cations were built on GaussView and submitted to HPC for optimisation (with 6-31G(d,p) basis set). Tight convergence criteria were imposed. Frequency analysis was then carried out by submitting the .log file obtained from optimisation to HPC. Results of optimisation and frequency analysis were tabulated below.
[N(CH3)4]+

| Optimisation DOI:10042/279352 |
Frequency DOI:10042/27936 | |
|---|---|---|
| File Type | .log | .log |
| Calculation Type | FOPT | FREQ |
| Calculation Method | RB3LYP | RB3LYP |
| Basis Set | 6-31G(d,p) | 6-31G(d,p) |
| Final Energy/a.u. | -214.1812735 | -214.181273 |
| Gradient/a.u. | 0.00000427 | 0.00000334 |
| Dipole Moment/Debye | 0.00 | 0.00 |
| Point Group | C1 | C1 |
| Time Taken for Calculation | 16 min 23.3 s | 18 min 49.3 s |
Item Value Threshold Converged? Maximum Force 0.000012 0.000015 YES RMS Force 0.000003 0.000010 YES Maximum Displacement 0.000041 0.000060 YES RMS Displacement 0.000012 0.000040 YES Predicted change in Energy=-9.350821D-10 Optimization completed. |
             Item               Value     Threshold  Converged?
 Maximum Force            0.000017     0.000450     YES
 RMS     Force            0.000003     0.000300     YES
 Maximum Displacement     0.000185     0.001800     YES
 RMS     Displacement     0.000074     0.001200     YES
 Predicted change in Energy=-1.513514D-09
 Optimization completed.
Low frequencies --- -9.0119 -2.9518 -0.0005 -0.0003 0.0003 5.1260 Low frequencies --- 182.4947 288.3339 288.8566 |
[P(CH3)4]+
| Optimisation DOI:10042/27938 |
Frequency DOI:10042/27939 | |
|---|---|---|
| File Type | .log | .log |
| Calculation Type | FOPT | FREQ |
| Calculation Method | RB3LYP | RB3LYP |
| Basis Set | 6-31G(d,p) | 6-31G(d,p) |
| Final Energy/a.u. | -500.82701160 | -500.82701180 |
| Gradient/a.u. | 0.00000324 | 0.00000317 |
| Dipole Moment/Debye | 0.00 | 0.00 |
| Point Group | C1 | C1 |
Item Value Threshold Converged? Maximum Force 0.000006 0.000015 YES RMS Force 0.000002 0.000010 YES Maximum Displacement 0.000040 0.000060 YES RMS Displacement 0.000012 0.000040 YES Predicted change in Energy=-3.229105D-10 Optimization completed. |
                   Item             Value    Threshold  Converged?
 Maximum Force            0.000010 0.000450 YES
 RMS     Force            0.000003 0.000300 YES
 Maximum Displacement     0.001268 0.001800 YES
 RMS     Displacement     0.000343 0.001200 YES
 Predicted change in Energy=-5.327815D-09
 Optimization completed.
Low frequencies --- -5.9835 -0.0040 -0.0028 -0.0015 3.6796 6.9200 Low frequencies --- 155.9685 191.5411 191.5626 |
[S(CH3)3]+

| Optimisation DOI:10042/27940 |
Frequency DOI:10042/27941 | |
|---|---|---|
| File Type | .log | .log |
| Calculation Type | FOPT | FREQ |
| Calculation Method | RB3LYP | RB3LYP |
| Basis Set | 6-31G(d,p) | 6-31G(d,p) |
| Final Energy/a.u. | -517.68327580 | -517.68327590 |
| Gradient/a.u. | 0.00000298 | 0.00000256 |
| Dipole Moment/Debye | 0.96 | 0.96 |
| Point Group | C1 | C1 |
| Time Taken for Calculation | 17 min 30.0 s | 8 min 58.2 s |
Item Value Threshold Converged? Maximum Force 0.000007 0.000015 YES RMS Force 0.000003 0.000010 YES Maximum Displacement 0.000034 0.000060 YES RMS Displacement 0.000010 0.000040 YES Predicted change in Energy=-2.146270D-10 Optimization completed. |
             Item               Value     Threshold  Converged?
 Maximum Force            0.000010     0.000450     YES
 RMS     Force            0.000003     0.000300     YES
 Maximum Displacement     0.001110     0.001800     YES
 RMS     Displacement     0.000332     0.001200     YES
 Predicted change in Energy=-4.015397D-09
 Optimization completed.
Low frequencies --- -9.9124 -0.6126 -0.0011 0.0030 0.0042 16.4246 Low frequencies --- 162.2127 199.4726 199.6805 |
Comparison of properties of the trio of cations
Geometries of the cations were compared and a summary was tabulated below.
| N(CH3)4]+ | [P(CH3)4]+ | S(CH3)3]+ | ||||||||||
|---|---|---|---|---|---|---|---|---|---|---|---|---|
X=N |
X=P |
X=S | ||||||||||
| Geometry with respect to central atom | tetrahedral | tetrahedral | trigonal pyramidal | |||||||||
| C-X-C bond angle / ⁰ | 109.5 | 109.5 | 102.7 | |||||||||
| C-X bond length / Å | 1.51 | 1.82 | 1.82 |
Both N(CH3)4]+ and [P(CH3)4]+ adopt a tetrahedral geometry about the central atom (N and P respectively), with bond angle C-X-C (where X = N, P) ≈ 109.5°. This agrees with the valence shell electron pair repulsion (VSEPR) theory [5] that valence electron pairs surrounding an atom occupy positions that minimise their mutual electronic repulsions by maximising the distance between them. Therefore, according to the VSEPR theory, the four bonded pairs around X (where X = N, P) repel each other mutually, and adopt a tetrahedral arrangement which minimises this repulsion.
While S(CH3)3]+ has a similar basic geometry as the two cations discussed above (three bond pairs and one lone pair), the presence of the lone pair of electrons on S alters its geometry slightly. As such, S(CH3)3]+ adopts a trigonal pyramidal shape around the central S atom, with C-S-C bond angle = 102.7°. The decrease in bond angle can be rationalised by the stronger lone pair-lone pair repulsion. [5] As the non-bonding pair is held closer to the central S atom by its positively charged nucleus, the repulsion caused by the lone pair is thus greater than that caused by the bonding pair. Generally, lone pair-lone pair repulsion is stronger than lone pair-bond pair repulsion, which is in turn stronger than the repulsion between two bond pairs (i.e. lp-lp > lp-bp > bp-bp).
Comparing the C-X bond lengths, it can be observed that the C-P and C-S bonds are longer than the C-N bond. This can be explained by the same reason discussed in the previous section. P and S are from the the third period whereas N is from the second period. Based on the radial distribution function, the 3p valence orbital (on P and S) are more diffused and further away from the nucleus. Therefore, there would be a weaker interaction between the valence orbitals, leading to longer C-P and C-S bonds. Conversely, N has a much smaller atomic radius with valence 2p orbital that is held closer to the nucleus. This would result in stronger interaction between the valence orbitals of C and N, resulting in shorter C-N bond. Furthermore, C and N are from the same period and their similarity in sizes and electronegativities results in better interaction of the valence orbitals too.
Population analysis
Population analysis was carried out on Gaussian and the results were summarised in the table below.
| [N(CH3)4]+ | [P(CH3)4]+ | [S(CH3)3]+ | |
|---|---|---|---|
| File Type | .log | .log | .log |
| Calculation Type | SP | SP | SP |
| Calculation Method | RB3LYP | RB3LYP | RB3LYP |
| Basis Set | 6-31G(d,p) | 6-31G(d,p) | 6-31G(d,p) |
| Final Energy / a.u. | -214.18127061 | -500.82702407 | -517.68329075 |
| Dipole Moment / Debye | 0.00 | 0.00 | 0.97 |
| Point Group | C1 | C1 | C1 |
| Time Taken for Calculation / s | 14.0 | 14.0 | 9.0 |
Molecular orbital (MO) analysis
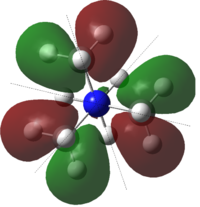
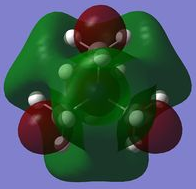
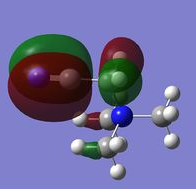
Five occupied non-core MOs of [N(CH3)4]+ were studied. The discussion, together with the visualised MOs were presented in the table below.
NBO analysis
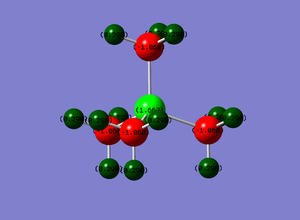
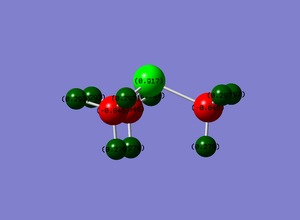
Charge distributions were obtained from results of population analysis. A summary was tabulated below.
Discussion on charge distribution
From the results above, it can be observed that changing the central atom affects the overall charge distributions within the cations. N(CH3)4]+ has a smaller charge range (as represented by the dark green and red colours on the atoms) as compared to the other two cations (with bright green and red colours on the atoms). The dark red colour on N suggests that it is slightly negative. This can be rationalised by its electronegativity. The highly electronegative N atom withdraws electron density to itself, giving the central atom a negative charge. Conversely, for [P(CH3)4]+, the bright green colour on P suggests that it is highly positive. P is less electronegative than C, and is thus less likely to pull electron density to itself. As such, the central atom is positively charged while the carbon ligands bear most of the electron density and are negatively charged. S has a very similar electronegativity as C, an even charge distribution among S and C atoms in S(CH3)3]+ is thus expected. However, it was observed that S is mildly positive and C is slightly negative. This could be due to the difference in sizes of the atoms. S is from the third period, its three principle quantum shells shield the nucleus from pulling electron density to itself. On the other hand, C atom has only two principle quantum shell, and is thus slightly more likely to draw electron density towards itself.
Traditionally, a "formal" positive charge is placed on the central N atom in [NR4]+ to represent the lose of one electron from N during bonding with the R groups. The positive charge suggests that N is electron-deficient. However, from the above analysis, it can be seen that this is not the case (in N(CH3)4]+, N bears a slightly negative charge). Therefore, instead of viewing the positive charge being localised on the N atom, a more appropriate representation of the cation would be with the positive charge smeared over the whole molecule (in the case of N(CH3)4]+, mostly on the H atoms of the molecule).
Discussion on relative contribution
The relative contribution of each atom to the C-X bond was obtained from population analysis. The results were shown below. Only one set of values was shown for each C-X bond as all of the bonds are equivalent in each cation.
[N(CH3)4]+
(1.98452) BD ( 1) C   1 - N  17
                ( 33.65%)   0.5801* C   1 s( 20.78%)p 3.81( 79.06%)d 0.01(  0.16%)
                                           -0.0003 -0.4552  0.0237 -0.0026 -0.8631
                                           -0.0367 -0.1976 -0.0084  0.0719  0.0030
                                           -0.0152  0.0055  0.0013 -0.0314  0.0199
                ( 66.35%)   0.8146* N  17 s( 25.00%)p 3.00( 74.97%)d 0.00(  0.03%)
                                            0.0000 -0.5000  0.0007  0.0000  0.8412
                                           -0.0001  0.1926  0.0000 -0.0700  0.0000
                                           -0.0067  0.0024  0.0006 -0.0138  0.0087
For the four C-N bond, 66% of the bond is contributed by the N orbitals (25% s + 75% p) and 34% of it is contributed by the C orbitals (21% s + 79% p). This suggests that each of the four sp3 orbital of N interacts with one sp3 orbital of C. N is more electronegative than C, thus withdrawing electron density to itself. This explains the higher contribution of orbitals by the P atom.
[P(CH3)4]+
(0.04345) BD*( 1) C   5 - P  17
                ( 40.43%)   0.6358* C   5 s( 25.24%)p 2.96( 74.67%)d 0.00(  0.08%)
                                           -0.0002 -0.5021 -0.0171  0.0020 -0.3141
                                            0.0058  0.2556 -0.0047  0.7632 -0.0140
                                            0.0054  0.0162 -0.0131 -0.0011 -0.0195
                ( 59.57%)  -0.7718* P  17 s( 25.00%)p 2.97( 74.15%)d 0.03(  0.85%)
                                            0.0000 -0.0001 -0.5000  0.0008  0.0000
                                            0.0000  0.3130 -0.0005  0.0000 -0.2548
                                            0.0004  0.0000 -0.7607  0.0011  0.0172
                                            0.0513 -0.0418 -0.0036 -0.0619
For the four C-P bond, 40% of the bond is contributed by C (25% s + 75% p) and 60% of the bond is contributed by P (25% s + 74% p). This suggests that each of the sp3 orbital of P interacts with the sp3 orbital of C. P is less electronegative than N, and therefore contributes less to the C-P bond as compared to the contribution of N to the C-N bond.
[S(CH3)3]+
(0.02231) BD*( 1) C   1 - S  13
                ( 51.33%)   0.7165* C   1 s( 19.71%)p 4.07( 80.16%)d 0.01(  0.14%)
                                           -0.0003 -0.4437 -0.0140  0.0033  0.7882
                                           -0.0061 -0.2193  0.0017  0.3635  0.0098
                                            0.0137 -0.0231  0.0064 -0.0227  0.0096
                ( 48.67%)  -0.6976* S  13 s( 16.95%)p 4.86( 82.42%)d 0.04(  0.63%)
                                            0.0000 -0.0001 -0.4117  0.0075 -0.0012
                                            0.0000 -0.7821  0.0344  0.0000  0.2176
                                           -0.0096  0.0000 -0.4039 -0.0260  0.0255
                                           -0.0597  0.0166 -0.0424  0.0051
For the three C-S bond, 51% of the bond is contributed by C (20% s + 80% p) and 49% of it is contributed by S (17% s + 82% p). This suggests that each of the sp3 orbital of S interacts with one sp3 orbital of C. It is noteworthy that the interacting orbitals from S has a much higher p character (as seen from the s : p ratio above). S has an electronegativity in between that of N and P, and this provides the rationale behind its contribution to the C-S bond (66% > 49% > 40%)
(1.97342) LP ( 1) S  13           s( 49.14%)p 1.03( 50.85%)d 0.00(  0.01%)
                                            0.0000 -0.0002  0.7010  0.0057 -0.0013
                                            0.0000  0.0000  0.0000  0.0000  0.0000
                                            0.0000  0.0000 -0.7122 -0.0364  0.0000
                                            0.0000  0.0000  0.0000 -0.0101
As for the lone pair of electrons on S, s and p orbitals contribute almost evenly to it (49% s + 51% p). This shows that the orbital of the lone pair is sp hybridised rather than the expected sp3 hybridisation. This can be explained by the inert pair effect. As we go down the group, the energy gap between s and p orbitals increases. It becomes more difficult to promote an electron from the s orbital for hybridisation. Orbitals are thus more likely to be sp hybridised instead of sp3 hybridised.
Generally, it can be observed that the contribution of orbital by the X atom (where X = N, S or P) to the C-X bond follows the trend of electronegativity. Electronegativity decreases in the order N > S > P, the contribution of electron density by the X atom to the C-X bond decreases in this order too (66% > 49% > 40%).
Influence of functional groups
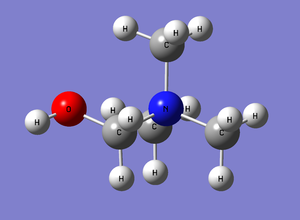
In this section, functional groups on the ligands of the original [N(CH3)4]+ (from the previous section) was varied and the effects were analysed. -OH and -CN functional groups were used and discussed below.
Opimisation and frequency analysis
[N(CH3)3(CH2OH)]+ and [N(CH3)3(CH2CN)]+ were generated in GaussView and optimised with tight convergence criteria (with 6-31G (d,p) basis set) using HPC. The data obtained were then submitted again for frequency analysis. The results from these calculations were presented in the tables below.
[N(CH3)3(CH2OH)]+
| Optimisation DOI:10042/27942 |
Frequency DOI:10042/27944 | |
|---|---|---|
| File Type | .log | .log |
| Calculation Type | FOPT | FREQ |
| Calculation Method | RB3LYP | RB3LYP |
| Basis Set | 6-31G(d,p) | 6-31G(d,p) |
| Final Energy/a.u. | -289.39321905 | -289.39321905 |
| Gradient/a.u. | 0.00000155 | 0.00000152 |
| Dipole Moment/Debye | 1.58 | 1.58 |
| Point Group | C1 | C1 |
| Time Taken for Calculation | 21 min 51.9 s | 27 min 11.3 s |
Item Value Threshold Converged? Maximum Force 0.000004 0.000015 YES RMS Force 0.000001 0.000010 YES Maximum Displacement 0.000049 0.000060 YES RMS Displacement 0.000014 0.000040 YES Predicted change in Energy=-1.869041D-10 Optimization completed. |
             Item               Value     Threshold  Converged?
 Maximum Force            0.000006     0.000450     YES
 RMS     Force            0.000002     0.000300     YES
 Maximum Displacement     0.000106     0.001800     YES
 RMS     Displacement     0.000024     0.001200     YES
 Predicted change in Energy=-1.936646D-10
 Optimization completed.
Low frequencies --- -121.5975 -3.3556 0.0007 0.0008 0.0008 3.7881 Low frequencies --- 4.8892 129.6446 217.5059 |
[N(CH3)3(CH2CN)]+

| Optimisation DOI:10042/27943 |
Frequency DOI:10042/27937 | |
|---|---|---|
| File Type | .log | .log |
| Calculation Type | FOPT | FREQ |
| Calculation Method | RB3LYP | RB3LYP |
| Basis Set | 6-31G(d,p) | 6-31G(d,p) |
| Final Energy/a.u. | -306.39376383 | -306.39376383 |
| Gradient/a.u. | 0.00000043 | 0.0000005 |
| Dipole Moment/Debye | 5.76 | 5.76 |
| Point Group | C1 | C1 |
| Time Taken for Calculation | 23 min 54.0 s | 26 min 25.7 s |
Item Value Threshold Converged? Maximum Force 0.000001 0.000015 YES RMS Force 0.000000 0.000010 YES Maximum Displacement 0.000029 0.000060 YES RMS Displacement 0.000009 0.000040 YES Predicted change in Energy=-2.077069D-11 Optimization completed. |
             Item              Value    Threshold Converged?
 Maximum Force           0.000002    0.000450    YES
 RMS     Force           0.000001    0.000300    YES
 Maximum Displacement    0.000071    0.001800    YES
 RMS     Displacement    0.000015    0.001200    YES
 Predicted change in Energy=-3.072682D-11
 Optimization completed.
Low frequencies --- -2.6359 0.0002 0.0003 0.0006 7.1484 9.6838 Low frequencies --- 91.7743 154.0301 210.9303 |
Population analysis
Population analysis was carried out on Gaussian and the results were tabulated below.
| [N(CH3)3(CH2OH)]+ | [N(CH3)3(CH2CN)]+ | |
|---|---|---|
| File Type | .log | .log |
| Calculation Type | SP | SP |
| Calculation Method | RB3LYP | RB3LYP |
| Basis Set | 6-31G(d,p) | 6-31G(d,p) |
| Final Energy / a.u. | -289.39319992 | -306.39377031 |
| Dipole Moment / Debye | 1.5787 | 5.764 |
| Point Group | C1 | C1 |
| Time Taken for Calculation / s | 19.0 | 22.0 |
NBO analysis
The influence of functional groups on charge distribution was studied. The NBO analysis was performed using the results from population analysis. A summary was tabulated below.
It can be observed that changing the functional group has a profound effect on the overall charge distribution of the cation. The substitution of the hydrogen atom on the methyl ligand with an -OH group results in an increase in the negative charge on the central nitrogen atom. This agrees with theory that the hydroxyl group is electron donating, and therefore donates electron density to the molecule. The anti-periplanar arrangement of the lone pair of electrons on oxygen and the central N atom allows a high degree of electron density delocalisation between O, C (that is directly bonded to O) and central N. Another reason for this effective delocalisation could be the similiarity in sizes of the atoms.
Another effect of changing the functional group is the change in relative charge of the C adjacent to the hydroxyl group. The presence of a hydroxyl group increases the relative charge on the adjacent C from -0.483 to +0.094. This can be rationalised by the electron withdrawing nature of the oxygen atom. O is highly electronegative and is thus likely to pull electron density to itself via inductive effect, making the adjacent C slightly positively charged.
On the other hand, substituting the hydrogen atom on the methyl ligand with a -CN group affects the overall charge distribution of the molecule too. The nitrile group is electron withdrawing, thus pulling electron density away from the molecule. This can be seen from the slight decrease in the negative charge on the central N atom from -0.295 to -0.289, as well as on the adjacent C from -0.483 to -0.385. The positive charge on the hydrogen atoms in the neighbouring -CH2 group is increased too from 0.269 to 0.309. This, again, is due to the electron withdrawing effect of the nitrile group.
Comparison of HOMO and LUMO of [N(CH3)4]+, [N(CH3)3(CH2OH)]+ and [N(CH3)3(CH2CN)]+
The influence of functional groups on the structure and energy levels of the HOMO and LUMO of the cations were studied. A summary was presented in the table below.
As seen from the visualised HOMO and LUMO tabulated above, the introduction of functional groups changes the shape of the molecular orbitals. For example, the substitution of the hydrogen in the methyl ligand with an -OH group has reduced the delocalisation of electron density. The electron density is largely localised on the -OH group and the size of the orbitals of the methyl groups is reduced, whereas the orbitals in [N(CH3)4]+ distribute evenly among the methyl groups. This can be rationalised by the electron withdrawing effect of the highly electronegative oxygen. Likewise, a great extent of delocalisation of the orbitals can be observed in the LUMO of [N(CH3)4]+. The introduction of an -OH group results in the orbitals being more localised on the functional group. A delocalisation of electron density between O, C (adjacent to the hydroxyl group) and N (central atom) can be observed too (discussed in the NBO analysis section). Similarly, the introduction of the -CN group significantly reduces the size of the MOs of the methyl groups. The HOMO is greatly localised on the nitrile group. This is due to the electron withdrawing effect of the nitrile group, pulling electron density to itself. As for the LUMO, a conparable situation is observed where the orbitals are more concentrated on the -CN group, resulting in a reduction of size in the MOs of the middle part of the molecule.
A change in the energy levels of the HOMOs and LUMOs was observed too by the introduction of functional groups. The addition of both functional groups raise the energy levels of the HOMOs. It also leads to an increase in the energy level of the LUMO of [N(CH3)3(CH2OH)]+ and a decrease in the energy level of [N(CH3)3(CH2CN)]+. The energy difference between the HOMO and the LUMO was calculated too. It can be seen that the presence of the functional groups results in a decrease in the HOMO-LUMO energy gap.
According to the frontier orbital theory, a decrease in HOMO-LUMO gap indicates that the molecules are less kinetically and thermodynamically stable. This has a huge impact on the chemical behaviour of the molecules. For instance, a higher energy HOMO of [N(CH3)3(CH2OH)]+ would mean that [N(CH3)3(CH2OH)]+ is a better electron donor than [N(CH3)4]+. Conversely, a lower energy LUMO of [N(CH3)3(CH2CN)]+ would suggest that [N(CH3)3(CH2CN)]+ is a better electron acceptor than [N(CH3)4]+. As such, the introduction of functional groups promotes the formation of ion pairs, resulting in better ionic liquid.
References
- ↑ K. Kentarou, "Fourier transform infrared spectroscopy of the BH3 ν3 band", The Journal of Chemical Physics, 1992, 96 (5), 3411.DOI:10.1063/1.461942
- ↑ P. Schwerdtfeger, "The Pseudopotential Approximation in Electronic Structure Theory", ChemPhysChem, 2011. DOI:10.1002/cphc.201100387
- ↑ B. Reffy, M. Hargittai and M. Kolonits, "Gallium tribromide: molecular geometry of monomer and dimer from gas-phase electron diffraction", J. Mol. Struct., 1998, 445, 139-148 DOI:10.1016/S0022-2860(97)00420-1
- ↑ I. Krossing, G. Santiso-Quinones, "Reference Values for the B-X Bond Lengths of BI3 and BBr3", Inorg. Allg. Chem, 2008, 634(4), 704-707 DOI:10.1002/zaac.200700510
- ↑ 5.0 5.1 R. J. Gillespie, "The Valence-Shell Electron-Pair Repulsion (VSEPR) Theory of Directed Valency", Journal of Chemical Education, 1963, 40 (6), 296-301.DOI:10.1021/ed040p295

