Rep:Mod:ct1515
Molecule Report
Molecule Name: NH3
Optimization data:
Calculation method:RB3LYP
Basis set:6-31G(D,P)
Final energy E(RB3LYP):-56.55776873 a.u.
Point group:C3v
H-N-H bond angle = 105.74118
N-H bond distance = 1.01798
         Item               Value     Threshold  Converged?
 Maximum Force            0.000004     0.000450     YES
 RMS     Force            0.000004     0.000300     YES
 Maximum Displacement     0.000072     0.001800     YES
 RMS     Displacement     0.000035     0.001200     YES
Log file and Jmol
NH3 |
Vibrational Analysis
How many modes do you expect from the 3N-6 rule? 3
Which modes are degenerate (ie have the same energy)? Modes 2 and 3 are degenerate and modes 5 and 6
Which modes are "bending" vibrations and which are "bond stretch" vibrations? Modes 1-3 are bending vibrations and 4-6 are stretching vibrations.
Which mode is highly symmetric? 4
One mode is known as the "umbrella" mode, which one is this? 1
How many bands would you expect to see in an experimental spectrum of gaseous ammonia? 2 because the 3 smallest vibrational modes are too small in intensity to register, and 2 of the 3 modes that do register are degenerate.
Charge analysis
Charge on N atom: -1.125
Charge on H atom: 0.375
Nitrogen is a more electronegative atom therefore the fact that it is more negative is expected as it attracts more electron density.
Molecule Name: Nitrogen (N2)
Optimization data: Calculation method:RB3LYP
Basis set:6-31G(D,P)
Final energy E(RB3LYP):-109.52359111 a.u.
Point group:D∞h
N-N bond length: 1.10550
   Item               Value     Threshold  Converged?
 Maximum Force            0.000001     0.000450     YES
 RMS     Force            0.000001     0.000300     YES
 Maximum Displacement     0.000000     0.001800     YES
 RMS     Displacement     0.000000     0.001200     YES
Log file and Jmol
N2 |
Vibrational analysis
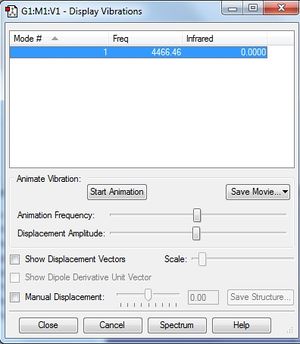
Nitrogen only has one vibrational mode which is expected as it only has one bond.
Charge analysis
There are no partial charges on the nitrogen because they are the same atom.
Molecule name: Hydrogen H2
Optimization data: Calculation method:RB3LYP
Basis set:6-31G(D,P)
Final energy E(RB3LYP):-1.15928020 a.u.
Point group:D∞h
H-H bond length: 0.74279
        Item               Value     Threshold  Converged?
 Maximum Force            0.000000     0.000450     YES
 RMS     Force            0.000000     0.000300     YES
 Maximum Displacement     0.000000     0.001800     YES
 RMS     Displacement     0.000001     0.001200     YES
Log file and Jmol
H2 |
Vibrational Analysis
There is only one vibrational mode of hydrogen which is expected as there is only one bond.
Charge analysis
There are no partial charges on the atoms because they are the same.
Energy Calculations
N2 + 3H2 -> 2NH3
E(NH3)= -56.55776873
2*E(NH3)=-113.11553746
E(N2)=-109.52412868
E(H2)=-1.17853936
3*E(H2)=-3.53561808
ΔE=2*E(NH3)-[E(N2)+3*E(H2)]= -0.0557907 a.u.
ΔE = -146.47849401 kJ/mol
Therefore the NH3 is more stable as this reaction is an exothermic reaction meaning energy is released during the reaction so the NH3 is in a lower energy state than the other gases.
Project Molecule
Methane
Optimization data: Calculation method:RB3LYP
Basis set:6-31G(D,P)
Final energy E(RB3LYP):-40.52401404 a.u.
Point group:Td
C-H bond length: 1.09197
         Item               Value     Threshold  Converged?
 Maximum Force            0.000063     0.000450     YES
 RMS     Force            0.000034     0.000300     YES
 Maximum Displacement     0.000179     0.001800     YES
 RMS     Displacement     0.000095     0.001200     YES
Log file and Jmol
CH4 |
Vibrational analysis
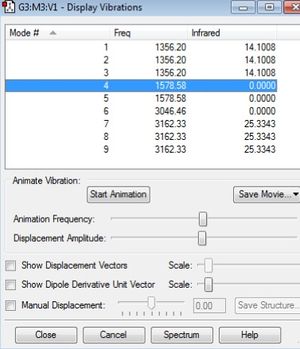
Modes 1-3 are degenerate in their frequency and intensity. They are all bending modes. Modes 4 and 5 are degenerate bending modes however there is no change in dipole so they do not register on infrared. Mode 6 is a stretching mode with no change in dipole. Modes 7-9 are are degenerate stretching modes there is a change in dipole however so will register on infrared. So there will be two peaks on the spectrum.
Charge Analysis
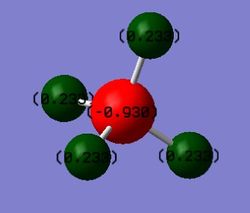 Charges present on Carbon(Red) and Hydrogen(Green)
The carbon has a charge of -0.930 and the hydrogens' have a charge of 0.233. This is expected as the carbon is more electronegative than hydrogen.
Molecular Orbitals
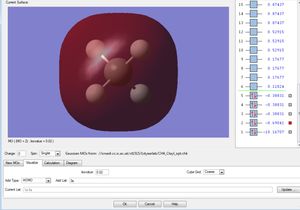
This is the 1s2 atomic orbital of the carbon which is too low in energy to interact with the orbitals of the hydrogens' and therefore doesn't contribute to bonding.
This is the σs orbital. It is the lowest in energy bonding σ molecular orbital. It is composed of the 2s from the carbon and one of the ligand group orbitals(LGOs).
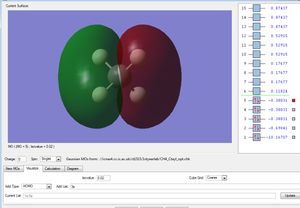
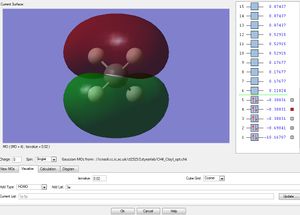
These three are the orbitals of σx, σy and σz. These are the highest occupied molecular orbitals and are the combination of the 2px, 2py and the 2pz orbitals and the remaining 3 LGOs.
All of these 5 orbitals are occupied with two electrons each.
Molecule Name: Ethene
Optimization data:
Calculation method:RB3LYP
Basis set:6-31G(D,P)
Final energy E(RB3LYP):-78.59380796 a.u.
C-C bond distance: 1.33008
C-H bond distance: 1.08673
Point group:D2h
         Item               Value     Threshold  Converged?
 Maximum Force            0.000107     0.000450     YES
 RMS     Force            0.000040     0.000300     YES
 Maximum Displacement     0.000168     0.001800     YES
 RMS     Displacement     0.000092     0.001200     YES
Log file and Jmol
CH |
Vibrational analysis
 Vibrations produced on GaussView
Modes 1-5 and 7 are bending vibrational modes. 6, 8 and 11 are bending and stretching vibrational modes. 9,10 and 12 are stretching vibrational modes. Mode 9, 12 and 3 have a large change in dipole and therefore will produce peaks on a infrared spectrum. Mode 7 will give a very small peak as there is a small change in dipole.
Charge Analysis
 Charges present on Carbon(Red) and Hydrogen(Green)
This is expected as the carbon is more electronegative than the hydrogens and therefore have a slight negative charge.
Molecular Orbitals
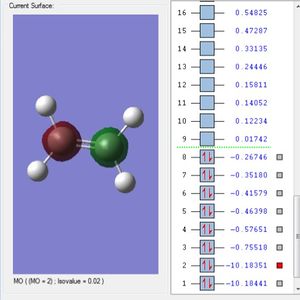
This is the 1s orbitals and is the lowest in energy and therefore too low for bonding. This is occupied.
This is the 1s anti-bonding atomic orbitals. These are occupied.
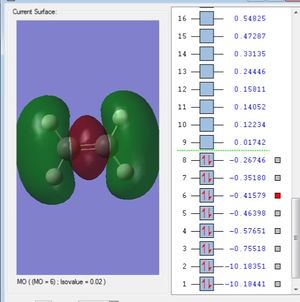
This is the σs orbital. It is the lowest in energy bonding σ molecular orbital. It is composed of the 2s from the carbons and 1s of the Hydrogens as shown below.
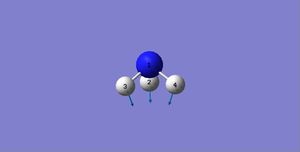 Diagram to show atomic orbital use.[1]
This is the σ's. This is occupied. It is composed of the carbon's 2s and two 1s of hydrogens in one phase and the other carbon's 2s and two 1s of hydrogens in another phase as shown below.
 Diagram to show atomic orbital use.[1]
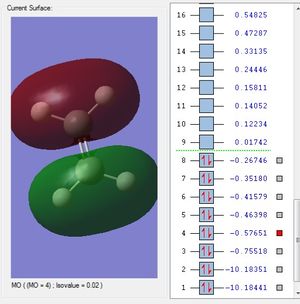
This is the πy. This is occupied. This is the combination of the 2py of the carbons and the 1s of the hydrogens as shown below.
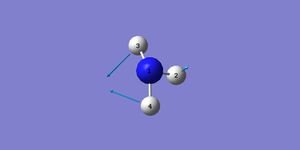 Diagram to show atomic orbital use.[1]
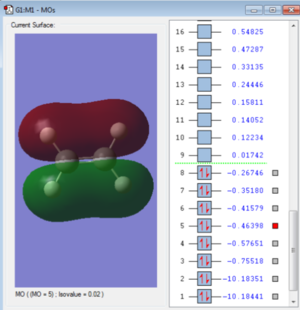
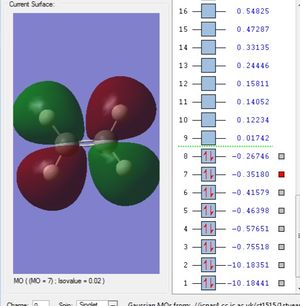
This is the πx. This is occupied. this is the combination of the 2px of the carbons and the 1s of the hydrogens which are all in the same phase as shown below.
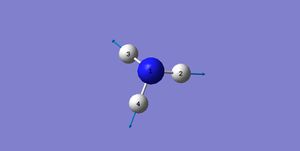 Diagram to show atomic orbital use.[1]
This is the π'y. This is occupied. This is the combination of the 2py orbitals of the carbons which are out of phase with each other and the 1s of the hydrogens in the same phase as the part of the p orbital closest to it as shown below.
 Diagram to show atomic orbital use.[1]
This is the πz. This is occupied. This is the combination of the two 2pz orbitals of the carbon only.
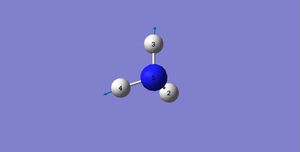 Diagram to show atomic orbital use.[1]


