Rep:Mod:csw14MgO
Modelling the Thermal Expansion of MgO
Introduction


The objective of this computational laboratory is to model the thermal expansion of a crystal of magnesium oxide and determine its thermal expansion coefficient.
Magnesium oxide (MgO) has a crystalline structure, held together by ionic interactions between Mg2+ and O2- ions. Its unit cell is a face-centred cubic (fcc) cell, where each magnesium and oxygen ion is in an octahedral configuration with respect to the other. While it is commonly described using the fcc conventional cell, the structure of MgO can be most simply described by its rhombohedron primitive cell. A crystal of MgO is simply an infinite number of these cells stacked together.
Due to the periodicity of crystals, a crystalline lattice of MgO in real space can be described in the reciprocal space by expressing the crystal in terms of a Fourier series. Different properties of the crystal, such as vibrational modes, can thus be described using a dispersion relation that varies with k-values. Each k-value, also known as a wave vector, represents different combinations of the atomic orbitals that contribute to the final function representing the crystal in reciprocal space. Vibrations propagate through the crystal through phonons and thus, a phonon dispersion that varies with k-values can be produced to describe the vibrational states in a crystal. The following equation gives the relationship between vibrational states and k-values for a 1D chain, where ω is the vibrational frequency of the crystal which varies as a function of k:
In order to model the thermal expansion of MgO, two computational approaches will be used. The first is the quasi-harmonic model. It models the vibrations of the crystal using a harmonic potential. However, in order to model thermal expansion, the parabolic potential is shifted in order to accommodate the newly optimized Helmholtz free energy at each temperature. Consequently, the optimal bond length is able to change with temperature and the expansion of the crystal can be simulated. The quasi-harmonic model also includes a repulsive term, known as the Buckingham potential, to ensure that the oppositely charged ions of magnesium and oxygen behave realistically and do not crash into each other due to attractive Coulombic forces.
The second approach uses the molecular dynamics model. In this classical mechanics model, each atom is given a velocity that is appropriate for the temperature of the system. The atoms are then allowed to move freely. At regular time intervals, the lattice parameters and volume are recorded, and the velocities and positions of the atoms are updated. A large number of steps are simulated so that the initial fluctuations in temperature and energy of the system have a minimal effect on the resulting approximation of the thermal expansion.
By plotting the volume of a cell in the crystal at each temperature, the coefficient of thermal expansion, α, of MgO can be found. The relationship is given by the following equation:
Results and Discussion
Computation of Phonons
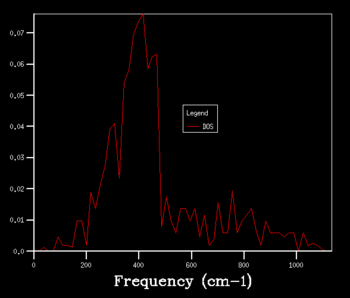
Before performing the quasi-harmonic computations, an appropriate grid size needed to be determined. This was done by generating the phonon density of states (DOS) graph for a variety of shrinking factors. As the shrinking factor is increased, more k-points are used in the DOS computation and thus the graph becomes smoother as more the phonon frequencies are added.
The shrinking factor of 1, which corresponds to a 1x1x1 grid size, produced a DOS graph using a single k-point. The values of the coordinates at this point were 0.5 times the lattice vector in each direction of the crystal, corresponding to the symmetry point L.
A shrinking factor of 16 was found to produce a reasonable DOS graph. Increasing the grid size to 32 and to 64 resulted in graphs with similar shapes, of higher resolution. Thus, the shrinking factor used for further calculations was decided to be 32, as it produced a more detailed DOS graph than a shrinking factor of 16 did, but is a more reasonable option due to the time constraints of the lab. A shrinking factor of 64 was too computationally expensive to be used.
| Shrinking
factor |
1 | 2 | 4 | 8 |
|---|---|---|---|---|
| Phonon
DOS graph |

|

|

|
|
| Shrinking
factor |
16 | 32 | 64 | |
| Phonon
DOS graph |

|

|

|
The phonon dispersion curve was also computed. It gives information about the number and corresponding energies of vibrational states at various k-points in the crystal, especially those that are symmetrically significant. It provides a different perspective of the vibrational states and their energies than the DOS graph does; the DOS gives the proportion of vibrational states present based on the number of k-points provided, whereas the phonon dispersion curve shows how the energies of the vibrations vary with each given k-point.

The same shrinking factor of 32 would be appropriate for modelling similar oxides such as calcium oxide, as its primitive cell and lattice potential should be similar to those of MgO. However, a crystal with a primitive cell comprising of more atoms, such as zeolite, would require a smaller shrinking factor. Since the zeolite primitive cell is larger in real space, its Brillouin zone, or the cell in reciprocal space, would be smaller than that of MgO. Therefore, a smaller shrinking factor, or fewer k-points, should produce a sufficiently accurate DOS graph. A regular metallic lattice, like that of lithium, would also require a smaller shrinking factor than MgO does, as its branches are not expected to fluctuate much. This is due to the fact that a metallic lattice can be thought of as positive point charges in a sea of electrons; as the individual atoms move and vibrate, the repulsive forces between them are softened by electrons attracted to and surrounding the positive ions. Consequently, the energies of the vibrational levels are not expected to fluctuate greatly and its DOS graph can thus also be relatively accurately produced with fewer k-points.
Quasi-Harmonic
In the quasi-harmonic approach, vibrational motion within the crystal is modeled by computing the vibrational energy levels of MgO in a harmonic oscillator model. The phonon dispersion and vibrational DOS are used to form the vibrational energy levels. As these properties are periodic throughout the crystal, the primitive cell is a sufficient basis for modelling vibrations for the entire crystal.
As the shrinking factor and grid size are increased, the magnitude of the change in the Helmholtz free energy of the crystal decreases. A shrinking factor of 32 results in a free energy value accurate to 1meV, and a shrinking factor of 64 gives a free energy value accurate to 0.1 meV.
| Shrinking Factor | Helmholtz Free Energy (eV) | Change in Energy |
|---|---|---|
| 1 | -40.930301 | |
| 2 | -40.926609 | 3.69x10⁻³ |
| 4 | -40.926450 | 1.59x10⁻⁴ |
| 8 | -40.926478 | 2.80x10⁻⁵ |
| 16 | -40.926482 | 4.00x10⁻⁶ |
| 32 | -40.926483 | 1.00x10⁻⁶ |
| 64 | -40.926483 | 0 |
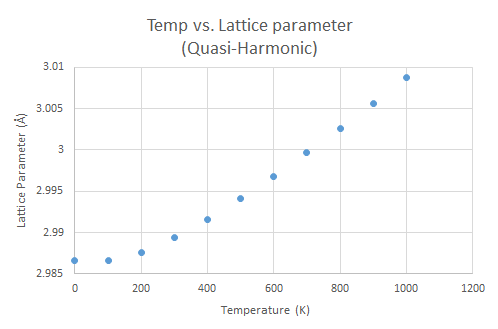
Plotted against temperature, the Helmholtz free energy decreases with increasing temperature. The lattice parameter, and thus the volume, shows the opposite trend, increasing with temperature. When the temperature of a system increases and the volume is allowed to vary accordingly, it will cause an increase in the entropy of the system and a further minimization of the Helmholtz free energy.
The thermal expansion coefficient α was found to be 2.6544x10⁻⁵ K-1 using the gradient of the change in cell volume with temperature. The magnitude of the computed thermal expansion coefficient is similar to experimental values found in literature, which average to 3.706x10⁻⁵ K-1 for a similar temperature range of 300-1000 K. [1]
Molecular Dynamics

In the molecular dynamics approach, vibrational motion within the crystal is simulated by allowing each atom in the crystal to have a velocity and move accordingly. Under this model, the movement of the atoms is no longer predictable and periodic throughout the entire crystal. As a result, a larger number of cells is required to appropriately simulate the different vibrational modes of MgO. For this lab, the molecular dynamics simulations are run with a supercell containing 64 atoms.
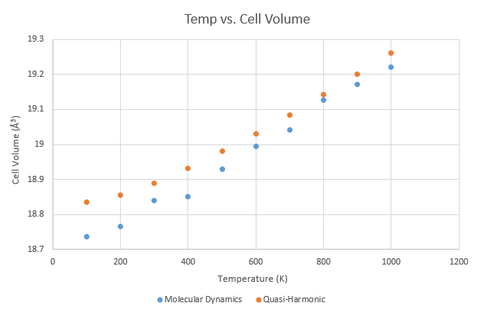
Upon graphing the change of volume (for a primitive cell) with temperature for both approaches, it can be seen that the two show a similar upward trend, converging around 800 K. While the two trend lines do approach a similar value, they do not overlap perfectly. This is likely due to the limitations of the supercell used for the molecular dynamics computation, as only a cell of infinite size would be able to generate all the different possible vibrations.
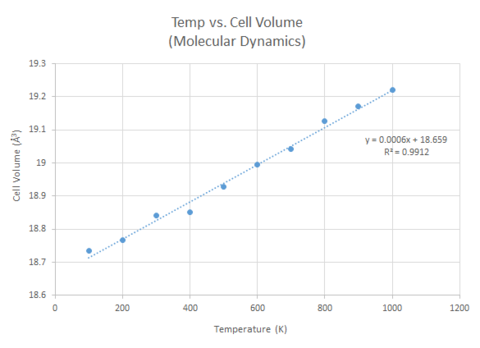
Like for the quasi-harmonic approach, the thermal expansion coefficient α for the molecular dynamics approach was found using the gradient of the change in cell volume with temperature. It was found to be 3.2024x10⁻⁵ K-1. The α value determined from the molecular dynamics approach is more similar to the experimental value from literature.
Conclusion
Thermal expansion occurs when thermal energy, or heat, added to a system is converted into kinetic energy of the molecules in the system. In a crystal, the kinetic energy can manifest as different vibrations of the lattice. As the amount of thermal energy added to the system is increased, the crystal is able to access higher energy vibrational modes. In these modes, there are more repulsive interactions between neighboring units in the crystal. As such, the volume of the crystal increases as more of the substituent atoms are in these high energy vibrational levels with greater internuclear repulsion and greater bond lengths.
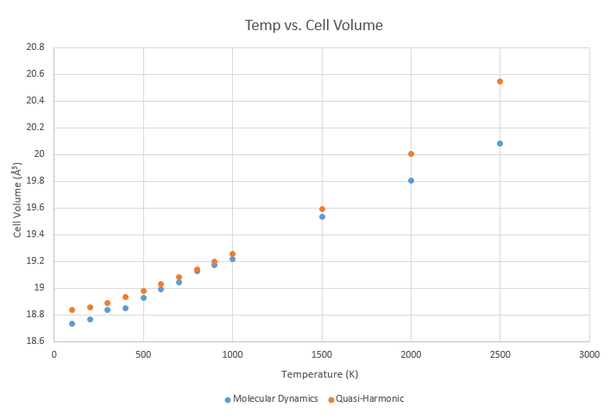
Both the quasi-harmonic and molecular dynamics approaches have provided reasonably accurate thermal expansion coefficients for MgO up to 1000 K. At higher temperatures, such as those approaching the melting point of MgO at 3125 K, the limitations of the quasi-harmonic model in particular become evident. When MgO reaches its melting point, the bonds between individual Mg2+ and O2- ions break as the crystal turns into a liquid. However, within the quasi-harmonic model, the phonon modes that represent the crystal vibrations do not allow for the bonds to break as they would in reality; the crystal would simply continue to expand. The molecular dynamics model, on the other hand, does not have this limitation and would allow the bonds within the crystal to break. It is thus a better approximation than the quasi-harmonic model for the physical change that a crystal would undergo in reality.
Conversely, the quasi-harmonic model is a better approximation at lower temperatures. The difference between the volumes produced by the two approaches at low temperatures is due to the consideration of the zero-point energy in the quasi-harmonic model. The zero-point energy is included in the equation for the Helmholtz free energy, which in turn determines the volume at each given temperature. As it arises from the uncertainty principle in quantum mechanics, the zero-point energy is ignored by the molecular dynamics model, which is based on classical mechanics. It is nonetheless important and causes the divergence of the two models at low temperatures.
References
https://www.nist.gov/sites/default/files/documents/srd/jpcrd375.pdf
- ↑ J Phys Chem Ref Data, Vol 19, No 1, 1990 (Page 71, Table 1)


