Rep:Mod:csw114mgocrystal861
Introduction
The aim of this experiment is to model and study the thermal expansion of Magnesium Oxide using two approaches - Quasi-Harmonic Approximation (Lattice Dynamics) and Molecular Dynamics. By modelling the vibrational modes of Magnesium oxide, we are able to study properties such as super conductivity, dielectric phenomena and even thermal expansion. Thermal expansion refers to a change in volume (shape or area) of a system in response to a change in temperature. It is quantified by the thermal expansivity coefficient and can be derived from this equation:
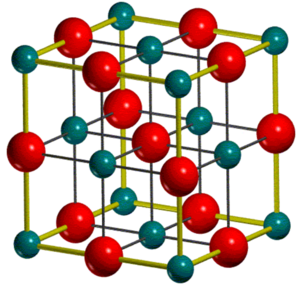
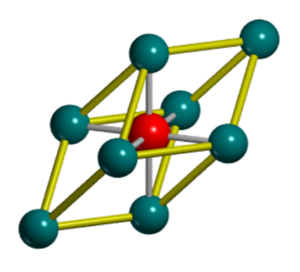
Magnesium Oxide is an ionic crystalline lattice consisting of Mg+2 and O-2 ions. If we assume a defectless MgO crystal structure that is periodic throughout 3D, its structure can be described by either a unit or primitive cell. The unit cell (Figure 1) of MgO is packed in a face centred cubic (FCC) structure with both Mg+2 and O-2 ions occupying octahedral sites in relation to each other. The primitive cell (Figure 2) is the simplest description of the MgO lattice and is a rhombohedron primitive cell containing only one lattice point. MgO is often used as a model system to study lattice vibrations due to its mechanical and dynamic stability whilst showing nearly harmonic behaviour [1]
.
| Conventional cell [2] | Primitive cell [2] |
|---|---|
 |
 |
Due to its periodicity, the properties in a perfect MgO lattice can be described using a periodic function which is then written as a Fourier expansion. The Fourier transform takes us from the Bravias lattice into reciprocal space. In reciprocal space, the periodic function can be expressed as an oscillatory term related to a unique wave vector and angular frequency . The k wave vector is a result of different combinations of atomic orbitals. The relation between the wave vector K and its angular frequency can be described using a dispersion relation. As vibrations are a periodic property of the crystal, a phonon dispersion relation can be used to describe vibrations of the entire crystal lattice. The variation of the wave vector and its energy within the crystal can also be determined from the dispersion relation . (E = hx, where h =planck's constand, =frequency)
Methodology
Two computational approaches were used to model the thermal expansion of MgO:
1. Quasi Harmonic Approximation Approach (QHA)
In the Quasi Harmonic Approximation, the vibrational energy levels of MgO are computed to understand the phonon dispersion of the material as well as its vibrational density of state. The model assumes that the amplitude of atomic displacements is small in relation to interatomic distances. As such, the system can be modeled as a collection of independent harmonic oscillators which establishes the quantum mechanical energy levels of the system. The Quasi Harmonic approach makes use of a single primitive lattice of MgO. Lattice vibrations can be treated as periodic throughout the crystal, hence the primitive cell provides a sufficient basis for modelling vibrations for the entire crystal.
2. Molecular Dynamics Approach
The Molecular Dynamics approach is an example of a classical mechanics model,making use of Newton's second law. The atoms in the MgO system are each given a random velocity which is suitable for the specified temperature of the simulation. The computer simulates atom vibrations till quantities such as energy and temperature fluctuate around a statistical average. Although this method is more computationally demanding, it does not require the use of the harmonic approximation. This simulation requires the use of a larger "super cell" to model the properties of MgO in a more accurate manner. Atom movements are randomly assigned in the simulation and can no longer be assumed to be periodic over the lattice. By obtaining properties over a larger sample size, a more accurate description of the cell can be derived.
Tools Used
DLVisualise and GULP programs were used in this simulation exercise. DL Visualise provides and interface to for modelling while GULP provides the modelling code required for the simulation. These programs were ran on a Linux RedHat environment.
Results and Discussion
Calculating the Phonon Modes of MgO
K space grid
In this section, the phonon dispersion modes of MgO were calculated.
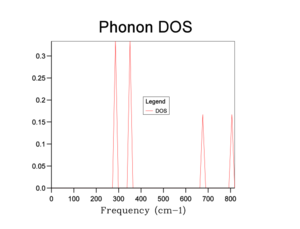
A 1x1x1 grid produced a DOS graph using a single K point, corresponding to the symmetry point L.The value of the coordinates at this k point is equivalent to 0.5 times the lattice vector in the X, Y, and Z direction.
The accuracy of the data obtained increases with the number of k-points used in the calculation. This has the implication that running a simulation with an infinite number of k-points would provide the most accurate physical data regarding our system under consideration. However, it would also be computationally expensive. Different shrinking factors were used to observe its effect on the density of state graphs to obtain a suitable k space grid which provides a balance between accuracy and computational cost.
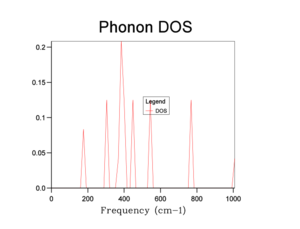
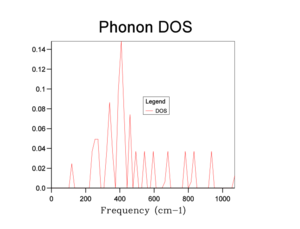
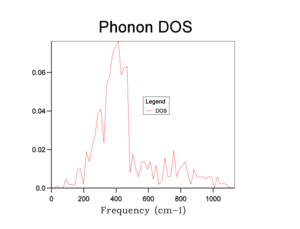
The phonon DOS plots are shown in the table below:
From the graphs, we can see that increasing the shrinking factor produces a smoother and more continuous DOS graph. This is because the phonons were sampled on a grid containing more k-points. A shrinking factor of 32 was chosen to run simulations. It provides a sufficiently smooth DOS curve, comparable to higher shrinking factors (e.g 64), as well as requiring a shorter computational time.
In relation to other systems, the optimal grid size of MgO would be applicable for systems which have roughly the same dimensions as it e.g CaO. This is due to the structural similarity of its primitive and reciprocal lattice to the model system MgO.
For systems with a higher density of atoms per unit area, such as a Zeolite, a smaller shrinking factor would be suitable to create a smooth DOS graph.
As the Zeolite has a larger primitive cell in real space, it would consequently have a smaller cell in reciprocal space in comparison to MgO. The reciprocal lattice of the zeolite would also contain more k points per unit area compared to MgO for a given shrinking factor. Hence, a smaller shrinking factor would be required to product a sufficiently accurate DOS graph for the zeolite.
When considering metallic structures e.g Lithium metal, a larger shrinking factor can be used to produce a smooth DOS graph. Lithium has a smaller primitive cell in real space (Lattice Parameter : 3.490 Å) in comparison to MgO (Lattice Parameter : 4.212Å ). Hence its reciprocal space lattice would be larger.A larger shrinking factor wold be required to give a sufficiently dense K-space grid in order to obtain an accurate DOS graph
Phonon Dispersion Graph
| Phonon Dispersion Graph |
|---|
 |
The phonon dispersion graph were also computed for the MgO system and is shown in Figure 3. The dispersion curve relates the vibrational wave frequency () to the k wave vector. It shows how the phonon energy changes depending on the k vector, especially along important symmetry points in the Brillouin zone. (e.g , X, M etc.).
On the other hand, the Phonon density of states provides with information on the number of vibrational states available in the Brillouin zone.Unlike the dispersion curve, the DOS curve does not give us information regarding the energy of vibrational states.
From Figure 3, 2 types of phonons can be identified- Acoustic and Optical phonons. These types of phonons are a result of interactions of atoms with other neighbouring atoms. Optical phonons result from out of phase vibrations with its neighbours. On the other hand acoustic phonons arise from in-phase vibrations from an atom interacting with its neighbours.
Free Energy of MgO
| Shrinking Factor | Free Energy (e.V) | Change in Free Energy (3.sf) |
|---|---|---|
| 1 | -40.930301 | - |
| 2 | -40.926609 | 3.69x10⁻³ |
| 3 | -40.926432 | 1.77x10⁻⁴ |
| 4 | -40.926450 | 1.80x10⁻⁵ |
| 8 | -40.926478 | 2.80x10⁻⁵ |
| 16 | -40.926482 | 4.00x10⁻⁶ |
| 32 | -40.926483 | 1.00x10⁻⁶ |
| 64 | -40.926483 | 0 |
| Table 2: | Free energy of MgO |
In this section of the experiment, the free energy changes of MgO were modeled against increasing shrinking factors. The free energy was modelled using the Quasi-Harmonic approach. The results are shown in the table above.
It can be seen that the free energy of the system decreases and converges to a single value as a denser k space grid was used. The magnitude of the change in the Helmholtz free energy of the system also decreases.
Whilst considering the density of state plots obtained earlier, a shrinking factor of 32 is appropriate for further calculations involving the Quasi-Harmonic Approximation. This is due to the convergence of its free energy value and the accuracy of the DOS graph produced (shown above).
A shrinking factor of 32 would be appropriate for calculations accurate to 1 meV, while a shrinking factor of 64 would be suitable for calculations accurate 0.1 meV per cell
Thermal Expansion of MgO (Quasi-Harmonic)
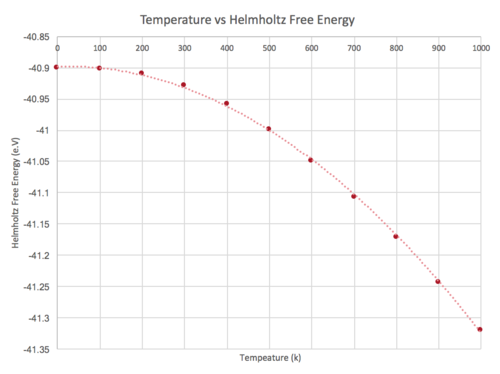
In this section, the Quasi-Harmonic Approximation was used to model the thermal expansion of MgO under different temperatures. A plot showing the Helmholtz free energy (Figure 4),and cell volume (Figure 5) as a function of temperature is shown in the table below.
| Temperature vs Helmholtz Free Energy | Temperature vs Cell Volume |
|---|---|
 |
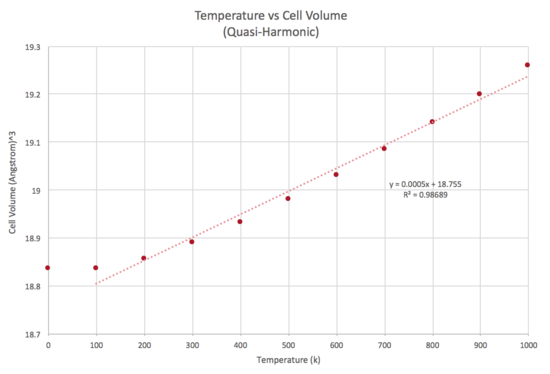 |
From the graph, we can see that an increase in temperature decreases the Helmholtz free energy. The Helmholtz free energy can be defined as : . Where = internal energy, = temperature and = entropy An increase in temperature results in a greater contribution from the entropic term, resulting in a greater minimisation of the Helmholtz free energy. From the graph, we can also see that an increase in temperature leads to an increase in cell volume.
The thermal expansion coefficient was calculated according to the equation shown below:
The thermal expansion coefficient obtained from the Quasi Harmonic Approach was found to be = 2.6544 x 10⁻⁵ K-1 (4 d.p)
Literature values were found for the expansion of MgO.The values were calculated within the range of 200-100k and the average k value of = 3.6890 x 10⁻⁵ K-1 (4 d.p) [3]
| Lennard Jones Potential |
|---|
 |
The origins of thermal expansion (and increasing cell volume) can be explained due to the anharmonicity of atom interactions. Simple atomic interactions can be modelled according to the Leonard Jones potential curve (Figure 7[4]). r0 corresponds to the equilibrium bond distance between the two atoms. As the temperature of the system increases , the system gains more energy and can populate higher vibrational energy states. This causes an increase in the equilibrium separation between two atoms thus leading to thermal expansion (r1 to r2 as shown on the graph).
For a diatomic system modelled using the harmonic approximation, no thermal expansion would be observed as the temperature of the system increases. This is due to the symmetrical displacements of the atoms from their equilibrium positions.
As the temperature of the system increases, phonon modes become less accurate in describing the behaviour of ions. The phonon modes would not allow for the bonds between the Mg +2 and O-2 ions to break. It would continue to model the MgO lattice as an expanding solid even though simulation temperatures might be above its melting temperature.Moreover, phonon-phonon interactions become increasingly significant at higher temperatures, as such the Quasi-harmonic Approximation become less accurate in representing the actual motion of ions.
The Quasi Harmonic approximation is based largely on the Harmonic approximation, but with some modifications. The modifications include modelling vibrations as harmonic oscillators whilst allowing the force constants to change with lattice expansion. The harmonic approximation considers the potential energy between 2 atoms and expresses the energy as a Taylor expansion around the minimum point of the free energy curve. This approximation ignores expansion terms with a power greater than 2. The harmonic approximation serves as a starting point for modelling and is expanded further to account for higher-order anharmonic effects (hence Quasi-Harmonic). The Quasi Harmonic approach also models the Mg +2 and O-2 ions as charge hard spheres whilst ignoring electron-electron interactions. The buckingham coefficient is also included in the QHA to ensure that the two ions do not collide into each other. In order for the calculations to be representative of the entire MgO lattice, the QHA also assumes that the MgO lattice is consideration is defect free.
Thermal Expansion of MgO (Molecular Dynamics)
In this section, the Molecular Dynamics approach was used to model the thermal expansion of MgO under different temperatures. In this simulation, vibrational motion is simulated by randomly assigning atoms with a velocity that is "suitable" for the simulation temperature. In this set of simulations, a "super cell" consisting of 32 pairs of MgO atoms were used . This is because we can no longer assume periodic and predictable behaviour of atoms, hence a more accurate result would be obtained by modelling a slightly larger lattice.
A plot of the Cell Volume (per unit) vs temperature was plotted and is shown in Figure 8:
| Cell Volume vs Temperature |
|---|
 |
From the graph, we can see that an increase in temperature leads to an increase in cell volume. This trend is also observed from the data obtained using the Quasi-Harmonic Approximation A thermal expansion coefficient of 2.6687 x 10⁻⁵ K-1 (4 d.p) was obtained from the Molecular Dynamics simulation. This value is similar to the value obtained from the Quasi-Harmonic Approximation as well as literature values.
Comparison between Molecular dynamics and the Quasi Harmonic Approximation
A comparison between the Molecular dynamics and Quasi Harmonic Approximtion (QHA) was done by comparing how both systems modeled cell volumes of MgO as a function of temperature.The cell volumes of MgO at different temperatures were calculated using both computational methods and plotted as a function of temperature (Figure 9).
| Temperature vs Cell Volume |
|---|
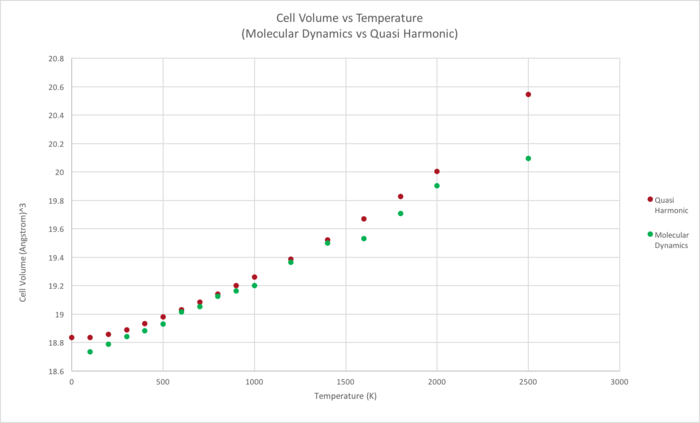 |
Within the "low temperature" regime, results obtained from both approaches are in agreement with each other. The values obtained can be seen to converge at 800k. Hence, within this temperature regime, the Quasi Harmonic Approximation and Molecular Dynamics approach are both reasonably accurate in modelling the thermal expansivity of MgO.
However, at higher temperatures (approaches the melting point), the data obtained from both approaches start to diverge. Within this regime, the limits of the Quasi Harmonic Approximation are evident and Molecular Dynamics becomes a more accurate method to model thermal expansion. When MgO reaches its melting point, the bonds between the oppositely charged Mg +2 and O-2 ions break and MgO undergoes a phase transition to the liquid phase. The phase transition from a solid to liquid phase is taken into account within the Molecular Dynamics approach, which allows for bond breaking. The Quasi Harmonic Approximation, on the other hand, does not take into account bond breaking and would continue to model MgO as an "expanding solid" past its melting temperature (mentioned above), thus making less accurate in describing the physical properties of MgO.
We can also see that the Quasi Harmonic Approximation predicts larger cell volumes for a given temperature, in comparison to the Molecular Dynamics approach. The difference in volumes predicted by both approaches lies in the fact that the Quasi Harmonic Approximation takes into account the zero point energy. As the QHA is a Quantum Mechanical calculation, particles cannot access the "bottom" of the potential well due to the heisienburg uncertainty principal. The value of the Helmholtz Free energy (F) calcualated in the Quasi Harmonic Approach is obtained via the following equation:
= Zero Point Energy
= Vibrational entropy
The Helmholtz Free Energy is minimized with respect to temperature and volume. The Molecular Dynamics approach ignores the zero point energy as it is a classical mechanics calculation.
Conclusion
In this experiment, the thermal expansivity of MgO was modelled using two intrinsically different approaches. The Quasi-Harmonic approach is based on Quantum Mechanics while Molecular Dynamics is derived from Classical Mechanics. Both approaches are shown to be reliable whilst modelling thermal expansion at lower temperatures. At higher temperatures (e.g approaching the melting temperature of MgO), Molecular Dynamics becomes a more accurate method as it takes into account the breaking of bonds between the Mg +2 and O-2 ions. A grid size consisting of 1 k point was not sufficient to produce a realistic picture of the density of states. Therefore, to accurately model thermal expansion via the Quasi Harmonic Approximation, a suitable k space grid had to be found in order to ensure accuracy whilst not encompassing a high computational cost. The optimal grid size chosen for this exercise was 32x32x32. This was implemented for the thermal expansion studies.
The thermal expansion coefficients obtained from the two approaches are summarised in the table below:
| Computational Method | Thermal Expansion coefficeint |
|---|---|
| Quasi Harmonic Approximation | |
| Molecular Dynamics |
References
1.A. Mei, O. Hellman, C. Schlepütz, A. Rockett, T. Chiang, L. Hultman, I. Petrov and J. Greene, Physical Review B, 2015, 92.
2.http://www.theochem.unito.it/crystal_tuto/mssc2008_cd/tutorials/geometry/geom_tut.html
3.O. Anderson and K. Zou, Journal of Physical and Chemical Reference Data, 1990, 19, 69-83.
4.http://web.mit.edu/mbuehler/www/SIMS/Thermal%20Expansion.html

