Rep:Mod:cr1411
Introduction
This computational experiment is aimed at modelling compounds and use molecular mechanics to carry out predictions of different of their properties such as regioselectivity or enantioselectivity, but also spectroscopic data such as NMR spectrum calculations. In the first part of the module, the regioselectivity of the dimerisation of cyclopentadiene and of its product's subsequent hydrogenation are investigated. An example of atropisomerism is studied for a ketone intermediate in the synthesis of Taxol. 1H NMR and 13C NMR spectra calculations are carried out for another Taxol intermediate and the data obtained used to check the literature assignments for this compound. The second part of the computational experiment involves the study of the enantioselectivity of the Shi and Jacobsen epoxidations of two alkenes, namely styrene and β-methylstyrene. Various properties such as optical rotation, 1H NMR and 13C NMR spectra are reported.
The hydrogenation of cyclopentadiene dimer
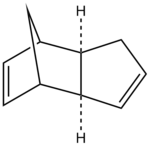
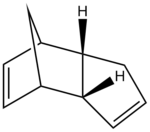
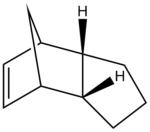
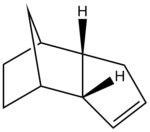
The geometries of the dimers 1-4 were optimised using the MMFF94(s) force field option in Avogadro; the results are summarised in Table 1.
Between the two cyclopentadiene dimers, compound 1 has the lowest total energy and is thus the thermodynamic product (the most stable). On the other hand, compound 2 is the kinetic product, that is the one the most rapidly formed. It can be noted that the angle bending energy is the energy contribution that determines the total energy difference between the two isomers: it is significantly higher in compound 2.
The isomer formed during the reaction is the endo product and this can be explained in terms of orbital interactions between the diene and dienophile: in the endo conformer, there are favourable bonding interactions between the frontier orbitals of the diene and dienophile at the back of the molecule. These stabilise the molecule and hence determine the stereochemistry of the end product.[1] This interaction is not present in the case of the exo product.

Diagram arranged from [1]
The dimerisation of cyclopentadiene is thus kinetically controlled: the reaction specifically gives the kinetic endo dimer 2.
Between the two hydrogenation products, compound 4 displays a lower total energy with respect to compound 3 and is thus the most stable: compound 4 is the thermodynamic product whilst compound 3 is the kinetic product. The stretching, bending, torsional and Van der Waals contributions to the energy are all smaller in the former case, with the exception of the electrostatic energy being slightly lower for dimer 3, as the unfavourable steric repulsions between the olefinic hydrogen atoms and the ones bridging the two cycles are minimised.
It has been reported that the product formed was isomer 4;[2] the hydrogenation reaction thus proceeds under thermodynamic control.
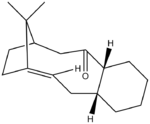
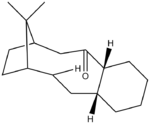
The atropisomers 9 and 10 of the Taxol intermediate, along with their corresponding parent hydrocarbons, were optimised using MMFF94(s) in Avogadro to determine their relative stabilities; the results are summarised in Table 2.
The lowest value of the total energy was obtained when the cyclohexane ring of both atropisomers had a chair conformation, which lies the lowest energy (it is actually an energy minimum).[3] The boat conformation is indeed higher in energy (it is an energy maximum for cyclohexane) due to unfavourable steric repulsion between the flagpole hydrogen atoms.[3] Between both conformers 9 and 10, compound 10 has a lower total energy and is thus the most stable. The "Olefin Strain" (OS) energy, that is the difference in strain energy between the alkene and its parent hydrocarbon,[4] was then calculated for both atropisomers in order to determine the relative reactivity of both bridgehead alkenes:
Compound 9: OS= 84.47-70.55= 13.92 kcal/mol
Compound 10: OS= 73.96-60.56= 13.40 kcal/mol
Both values are lower than 17 kcal/mol; both isomers are thus very stable: they represent a case of "hyperstable" olefins [4] They have a total energy lower than their corresponding parent hydrocarbon and hence display a very low reactivity. Between the two compounds, atropisomer 10 has the lower OS value and is hence expected to react more slowly than atropisomer 9.
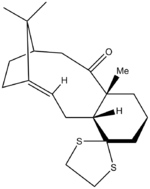
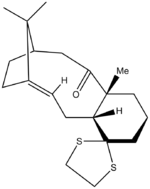
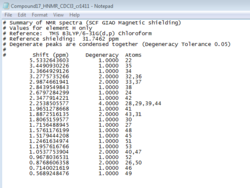
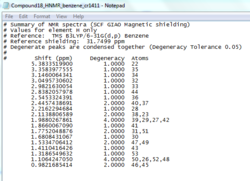
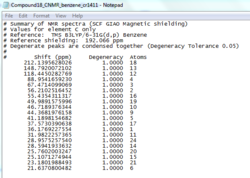
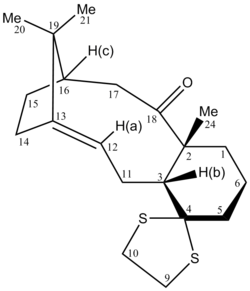
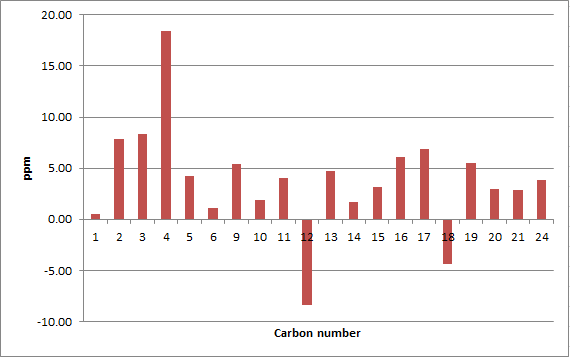
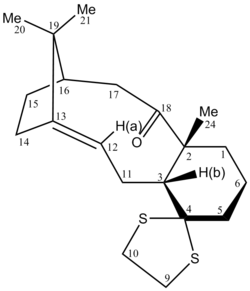
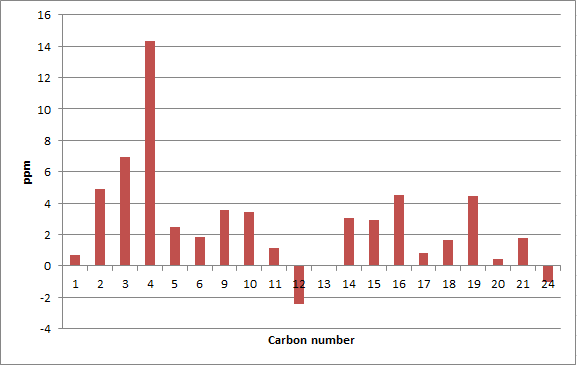
The two isomers of the Taxol intermediate were first optimised using MMFF94(s) in Avogadro. Their 1H and 13C NMR spectra were then simulated; the results are summarised in Table 3. The 1H and 13C NMR chemical shifts computed were then used to check whether the values reported in literature[5] were correctly assigned. The difference between the calculated and reported values was thus determined and plotted against the corresponding atom studied.[6],[7]
As expected from the results in the previous section, compound 18 has the lowest strain energy and is therefore the most stable.
A comparison of selected chemical shifts from the 1H NMR spectrum of both isomers, along with a complete revision of their 13C NMR spectra were then carried out; the results are summarised in Tables 4, 5, 6 and 7.
The NMR prediction for isomer 17 can be accessed here: DOI:10042/26559
| H atom | δ (ppm) | literature value (ppm) | Δδ (ppm) |
|---|---|---|---|
| H(a) | 5.53 | 4.84 | 0.69 |
| H(b) | 2.68 | 2.99 | -0.31 |
| H(c) | 2.35 | 1.00-0.80 | 1.35-1.55 |
While the deviations observed for H(a) and H(b) are minor, the one for H(c) is important. The value reported in the literature[5] is thus likely to be incorrect for this proton.
| C atom | δ (ppm) | literature value (ppm) | Δδ (ppm) |
|---|---|---|---|
| 1 | 33.18 | 32.66 | 0.52 |
| 2 | 60.33 | 52.52 | 7.81 |
| 3 | 64.55 | 56.19 | 8.36 |
| 4 | 91.27 | 72.88 | 18.39 |
| 5 | 40.07 | 35.85 | 4.22 |
| 6 | 22.05 | 20.96 | 1.09 |
| 9 | 44.19 | 38.81 | 5.38 |
| 10 | 47.63 | 45.76 | 1.87 |
| 11 | 32.87 | 28.79 | 4.08 |
| 12 | 116.91 | 125.33 | -8.42 |
| 13 | 149.37 | 144.63 | 4.74 |
| 14 | 27.36 | 25.66 | 1.70 |
| 15 | 31.46 | 28.29 | 3.17 |
| 16 | 52.85 | 46.80 | 6.05 |
| 17 | 46.64 | 39.80 | 6.84 |
| 18 | 214.46 | 218.79 | -4.33 |
| 19 | 54.01 | 48.50 | 5.51 |
| 20 | 26.87 | 23.86 | 3.01 |
| 21 | 21.56 | 18.71 | 2.85 |
| 24 | 30.68 | 26.88 | 3.80 |
The deviation from the calculated 13C NMR chemical shifts are significant for isomer 17. In particular, the difference in chemical shifts for the carbon atoms 2, 3, 4, 9, 12, 16, 17 and 19 is higher than 5 ppm, which suggests an inaccurate conformation of the molecule in these regions, unless the values reported in the literature are wrong.[8] The average |Δδ| is 5.11 ppm, the maximum 18.39 ppm.
The NMR prediction for isomer 18 can be accessed here: DOI:10042/26560
| H atom | δ (ppm) | literature value (ppm) | Δδ (ppm) |
|---|---|---|---|
| H(a) | 5.38 | 5.21 | 0.17 |
| H(b) | 2.11 | 1.58 | 0.53 |
The deviations observed for H(a) and H(b) are small; the values from literature match the ones calculated. The assignments in the literature have thus been correctly reported for the 1H NMR spectrum of isomer 18.
| C atom | δ (ppm) | literature value (ppm) | Δδ (ppm) |
|---|---|---|---|
| 1 | 36.18 | 35.47 | 0.71 |
| 2 | 56.21 | 51.30 | 4.91 |
| 3 | 67.47 | 60.53 | 6.94 |
| 4 | 88.95 | 74.61 | 14.34 |
| 5 | 41.19 | 38.73 | 2.46 |
| 6 | 21.64 | 19.83 | 1.81 |
| 9 | 44.37 | 40.82 | 3.55 |
| 10 | 46.72 | 43.28 | 3.44 |
| 11 | 31.98 | 30.84 | 1.14 |
| 12 | 118.45 | 120.90 | -2.45 |
| 13 | 148.79 | 148.72 | 0.07 |
| 14 | 28.59 | 25.56 | 3.03 |
| 15 | 25.11 | 22.21 | 2.90 |
| 16 | 55.43 | 50.94 | 4.49 |
| 17 | 37.57 | 36.78 | 0.79 |
| 18 | 213.14 | 211.49 | 1.65 |
| 19 | 49.99 | 45.53 | 4.46 |
| 20 | 25.76 | 25.35 | 0.41 |
| 21 | 23.18 | 21.39 | 1.79 |
| 24 | 28.96 | 30.00 | -1.04 |
The deviations from the calculated chemical shifts are also important in the case of isomer 18 but are less marked than for isomer 17; the average |Δδ| is 3.12 ppm, the maximum 14.34 ppm. For both isomers 17 and 18, the maximum deviation observed is for carbon 4, that is for the spiroatom. As its value is above 5 ppm, it is likely the computed conformation of the molecule is wrong in this region.
The thermodynamic properties of both isomers were further explored; the results are summed up in Table 8. They corroborate the ones found above: isomer 18 has the lowest energies and is thus the most stable.
| Energy (Hartree/particle)/Compound | 17 | 18 |
|---|---|---|
| Zero-point correction | 0.467223 | 0.467690 |
| Thermal correction to Energy | 0.489128 | 0.489220 |
| Thermal correction to Enthalpy | 0.490072 | 0.490164 |
| Thermal correction to Gibbs Free Energy | 0.418832 | 0.420446 |
| Sum of electronic and zero-point Energies | -1651.389634 | -1651.415536 |
| Sum of electronic and thermal Energies | -1651.367729 | -1651.394007 |
| Sum of electronic and thermal Enthalpies | -1651.366785 | -1651.393062 |
| Sum of electronic and thermal Free Energies | -1651.438025 | -1651.462780 |
Analysis of the properties of the synthesised alkene epoxides
The crystal structure of the Shi and Jacobsen catalysts
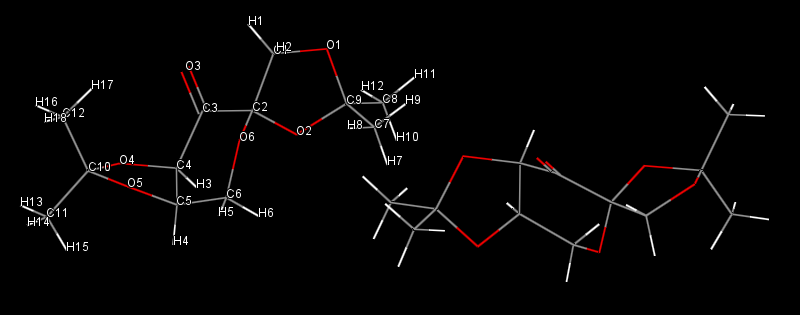
The Cambridge crystal database (CCDC) was searched using the Conquest program for the Shi and Jacobsen catalysts, their structure analysis with the Mercury program is reported below.
Shi catalyst
| C-O | bond length (Å) |
|---|---|
| C1-O1 | 1.429 |
| C9-O1 | 1.423 |
| C2-O2 | 1.423 |
| C2-O6 | 1.408 |
| C9-O2 | 1.454 |
| C4-O4 | 1.415 |
| C10-O4 | 1.456 |
| C5-O5 | 1.437 |
| C10-O5 | 1.428 |
It can be noted that the C-O bonds formed from the pyranose ring increase in the order C4-O4<C2-O2<C5-O5; the smaller value obtained for C4-O4 suggests a higher degree of strain for this bond. It can further be noted that the C9-O1 bond length is very close to the one measured for C10-O5, whilst C9-O2 is similar to C10-O4. At the anomeric centre, the C-O bond length in the pyranose ring is 1.408 Å, which is smaller than the value of 1.426 Å recorded for the simple pyranose unit.[9] The adjacent C-O bond length on the 1,3-dioxolane ring is much shorter: 1.408 Å.
Short distance interactions (lower than the sum of their Van der Waals radii, of range 2.391-3.206 Å) are further observed. All intermolecular, these are essentially H bonds, but dipole-dipole interactions are also observed. For example, the oxygen of the carbonyl atom establishes 2 H bonds (2.646 and 2.669 Å) with hydrogen atoms from adjacent molecules and one dipole-dipole interaction with a carbon atom (3.094 Å) from one of these molecules. In each 1,3-dioxolane ring, one oxygen atom is involved in 1 H-bond, the other in 2 H bonds, which stabilise the compound's crystal structure.[10]
Jacobsen catalyst
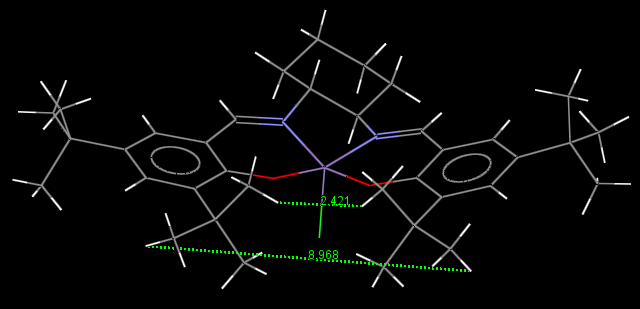
On each aromatic ring, the two t-Butyl groups adopt a staggered conformation with respect to each other; this corresponds to a minimum in energy and is thus the most stable conformation. H atoms from the t-Butyl groups also establish short contacts of 2.364 Å with H atoms of a t-Butyl group from a neighbouring molecule.
Distances between Hydrogen atoms of two adjacent t-Butyl groups on the aromatic rings were also measured; they ranged between 2.421 and 8.968 Å. Attractive non-covalent interactions (Van der Waals forces) are then expected to be formed between H atoms separated by a distance lying approximately in the lower part of this range (2.421-5.695 Å).
As for the Shi catalyst, intermolecular H bonds are observed, this time between N and H atoms from adjacent molecules. Their length is 2.650 Å. More general dipole-dipole interactions are also present, between C and H atoms (2.842 Å), and Cl and H atoms, where the the Chlorine atom establishes dipole-dipole interactions with two H atoms of two adjacent molecules. Their length is 2.759 Å and 2.775 Å, respectively.
Calculated NMR properties of the epoxide products
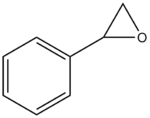
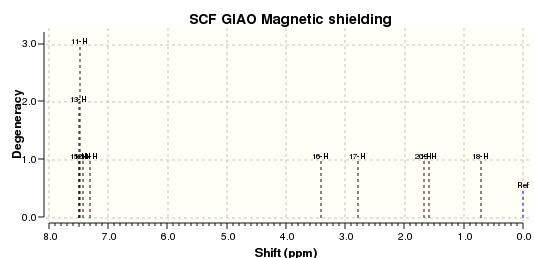
The two epoxide products, styrene oxide and β-methylstyrene oxide, were first optimised using MMFF94(s) in Avogadro. Their 1H and 13C NMR spectra were then simulated and used to check assigned values in literature[11],[12] as per the Taxol intermediates above (cf. Tables 11, 12, 14 and 15).
Styrene oxide
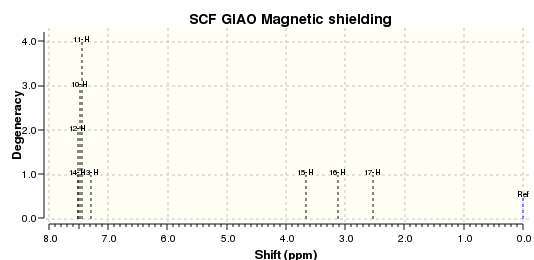
The NMR prediction for styrene oxide can be accessed here: DOI:10042/2661
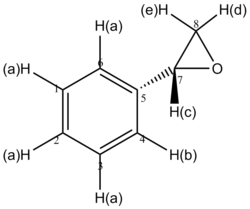
| H atom | δ (ppm) | literature value (ppm) | Δδ (ppm) |
|---|---|---|---|
| H(a) | 7.49 | 7.26-7.36 | 0.13-0.23 |
| H(b) | 7.30 | 7.26-7.36 | 0.06-0.16 |
| H(c) | 3.66 | 3.87 | 0.21 |
| H(d) | 3.11 | 3.15 | 0.04 |
| H(e) | 2.53 | 2.81 | 0.28 |
From the graph above, the deviations between the calculated and reported 1H NMR chemical shift are very small, which indicates a correct assignment in the literature.[11]
| C atom | δ (ppm) | literature value (ppm) | Δδ (ppm) |
|---|---|---|---|
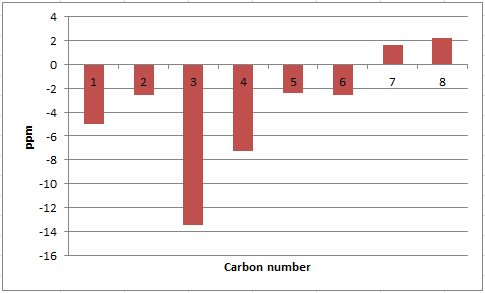
| 1 | 123.42 | 128.4 | -4.98 |
| 2 | 122.96 | 125.5 | -2.54 |
| 3 | 124.13 | 137.6 | -13.47 |
| 4 | 118.27 | 125.5 | -7.23 |
| 5 | 123.13 | 125.5 | -2.37 |
| 6 | 122.96 | 125.5 | -2.54 |
| 7 | 54.05 | 52.4 | 1.65 |
| 8 | 53.45 | 51.2 | 2.25 |
In the case of the 13C NMR chemical shifts, important deviations are observed for the Carbon atoms 1, 3 and 4, that is for carbon atoms in the aromatic ring.
β-methyl styrene oxide
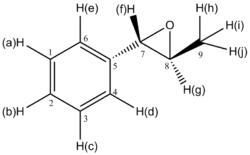
The NMR prediction for β-methylstyrene oxide can be accessed here: DOI:10042/26613
| H atom | δ (ppm) | literature value (ppm) | Δδ (ppm) |
|---|---|---|---|
| H(a) | 7.49 | 7.24-7.39 | 0.10-0.25 |
| H(b) | 7.42 | 7.24-7.39 | 0.03-0.18 |
| H(c) | 7.49 | 7.24-7.39 | 0.10-0.25 |
| H(d) | 7.31 | 7.24-7.39 | -0.08-0.07 |
| H(e) | 7.49 | 7.24-7.39 | 0.10-0.25 |
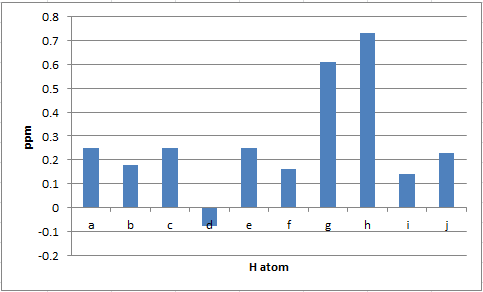
| H(f) | 3.41 | 3.57 | 0.16 |
| H(g) | 2.79 | 3.32-3.40 | 0.53-0.61 |
| H(h) | 0.72 | 1.45 | 0.73 |
| H(i) | 1.59 | 1.45 | 0.14 |
| H(j) | 1.68 | 1.45 | 0.23 |
As for styrene oxide, the differences in 1H NMR chemical shifts observed for methylstyrene oxide are not significant; the values reported in literature[12] are thus correct.
| C atom | δ (ppm) | literature value (ppm) | Δδ (ppm) |
|---|---|---|---|
| 1 | 123.33 | 127.70 | -4.37 |
| 2 | 122.73 | 125.70 | -2.97 |
| 3 | 124.07 | 128.30 | -4.23 |
| 4 | 118.49 | 125.70 | -7.21 |
| 5 | 134.98 | 135.84 | -0.86 |
| 6 | 122.80 | 125.70 | -2.90 |
| 7 | 60.58 | 59.70 | 0.88 |
| 8 | 62.32 | 59.70 | 2.62 |
| 9 | 18.84 | 18.10 | 0.74 |
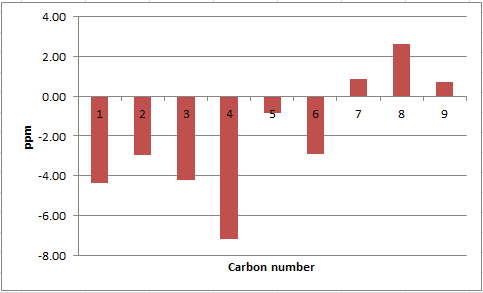
As per styrene oxide above, the most significant deviations in 13C NMR chemical shifts are seen for the carbon atoms 1, 3 and 4. This suggests an inaccurate conformation of the molecule in this region.
Determination of the absolute configuration of the epoxide products
Calculated chiroptical properties
| parameter/epoxide | styrene oxide | methylstyrene oxide |
|---|---|---|
| literature value for optical rotation (in chloroform) | -33.3° (589 nm) (R)[13] | -43.6° (589 nm) (S,S)[14] |
| calculated optical rotation (in chloroform) | -30.12 (589 nm) -94.05 (365 nm) DOI:10042/26761 |
46.8° (589 nm) 137.69 (365 nm) |
| computed Vibrational Circular Dichroism spectrum | 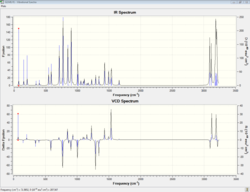 DOI:10042/26763 |
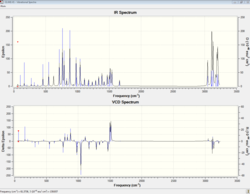 |
The values obtained for the optical rotation of both products are of the same range than the ones found in literature, however with an opposite sign in the case of β-methylstyrene oxide. Hence the computed enantiomers have the following absolute configurations: (R)-(-)-styrene oxide and (R,R)-(+)-methylstyrene oxide.
Calculated transition states for the epoxidation
In order to check the absolute configuration of the epoxide products that was assigned in the section above, the relative free energy (determined computationnally) of the transition states of styrene and methylstyrene was identified. This then allowed to find the ratio of concentrations between the two enantiomers for each epoxidation, and hence the enantiomeric excess (ee) of one enantiomer over the other. This latter parameter was determined with the formula ee=[(% more abundant enantiomer-50)*100]/50).[15]
Using the Shi catalyst
The thermodynamic quantities of the eight possible transition states for the epoxidation of β-methylstyrene using the Shi catalyst are summarised in Tables 17-20. The ratio of concentrations K between enantiomers was then calculated for each case, along with the enantiomeric excess; the results are summed up in Table 21.
β-methylstyrene
| Energy /Transition State | (R,R) | (S,S) |
|---|---|---|
| Zero-point correction (Hartree/particle) | 0.4681 | 0.4681 |
| Thermal correction to Energy | 0.4943 | 0.4938 |
| Thermal correction to Enthalpy | 0.4952 | 0.4953 |
| Thermal correction to Gibbs Free Energy | 0.4134 | 0.4102 |
| Sum of electronic and zero-point Energies | -1342.9683 | -1342.9625 |
| Sum of electronic and thermal Energies | -1342.9421 | -1342.9363 |
| Sum of electronic and thermal Enthalpies | -1342.9412 | -1342.9353 |
| Sum of electronic and thermal Free Energies | -1343.0230 | -1343.0179 |
| Energy/Transition State | (R,R) | (S,S) |
|---|---|---|
| Zero-point correction (Hartree/particle) | 0.4672 | 0.4676 |
| Thermal correction to Energy | 0.4938 | 0.4940 |
| Thermal correction to Enthalpy | 0.4947 | 0.4949 |
| Thermal correction to Gibbs Free Energy | 0.4102 | 0.4130 |
| Sum of electronic and zero-point Energies | -1342.9622 | -1342.9610 |
| Sum of electronic and thermal Energies | -1342.9356 | -1342.9347 |
| Sum of electronic and thermal Enthalpies | -1342.9347 | -1342.9337 |
| Sum of electronic and thermal Free Energies | -1343.0192 | -1343.0156 |
| Energy/Transition State | (R,R) | (S,S) |
|---|---|---|
| Zero-point correction (Hartree/particle) | 0.4680 | 0.4671 |
| Thermal correction to Energy | 0.4942 | 0.4935 |
| Thermal correction to Enthalpy | 0.4951 | 0.4944 |
| Thermal correction to Gibbs Free Energy | 0.4135 | 0.4116 |
| Sum of electronic and zero-point Energies | -1342.9747 | -1342.9683 |
| Sum of electronic and thermal Energies | -1342.9486 | -1342.9419 |
| Sum of electronic and thermal Enthalpies | -1342.9476 | -1342.9410 |
| Sum of electronic and thermal Free Energies | -1343.0293 | -1343.0238 |
| Energy/Transition State | (R,R) | (S,S) |
|---|---|---|
| Zero-point correction (Hartree/particle) | 0.4677 | 0.4672 |
| Thermal correction to Energy | 0.4939 | 0.4937 |
| Thermal correction to Enthalpy | 0.4949 | 0.4947 |
| Thermal correction to Gibbs Free Energy | 0.4133 | 0.4113 |
| Sum of electronic and zero-point Energies | -1342.9780 | -1342.9688 |
| Sum of electronic and thermal Energies | -1342.9518 | -1342.9423 |
| Sum of electronic and thermal Enthalpies | -1342.9508 | -1342.9414 |
| Sum of electronic and thermal Free Energies | -1343.0324 | -1343.0247 |
| Parameter/Transition State | TS1 | TS2 | TS3 | TS4 |
|---|---|---|---|---|
| Free energy difference ΔG[(S,S)-(R,R)](kcal/mol) | 5.1*10-3 | 3.6*10-3 | 5.5*10-3 | 7.7*10-3 |
| Free energy difference ΔG[(S,S)-(R,R)](J/mol) | 21.04 | 15.19 | 23.04 | 32.22 |
| Ratio of concentrations K; K=exp[-ΔG/(RT)] | 0.992 | 0.994 | 0.991 | 0.987 |
| ee of (S,S) (%) | 98.4 | 98.8 | 98.2 | 97.4 |
From Tables 17-20, the transition state lying the lowest in energy and hence the most stable corresponds to the one leading to the (R,R) epoxide (Table 20), and where the phenyl group of the alkene is oriented exo with respect to the fructose. Hence the (R,R) enantiomer would be expected to be the major product. However, the results from Table 21 indicate the (S,S) epoxide is formed instead, with an ee of 97.4%, lit 91%[14](corresponding to the transition state the lowest in energy). These results are thus in opposition to the ones obtained in the section above, where it was found that the computed enantiomer had the (R,R) configuration.
Styrene
| Energy /Transition State | (R) TS1 | (S) TS1 |
|---|---|---|
| Zero-point correction (Hartree/particle) | 0.4399 | 0.4396 |
| Thermal correction to Energy | 0.4646 | 0.4646 |
| Thermal correction to Enthalpy | 0.4655 | 0.4655 |
| Thermal correction to Gibbs Free Energy | 0.3869 | 0.3849 |
| Sum of electronic and zero-point Energies | -1303.6777 | -1303.6791 |
| Sum of electronic and thermal Energies | -1303.6530 | -1303.6542 |
| Sum of electronic and thermal Enthalpies | -1303.6521 | -1303.6532 |
| Sum of electronic and thermal Free Energies | -1303.7307 | -1303.7338 |
| Energy/Transition State | (R) TS2 | (S) TS2 |
|---|---|---|
| Zero-point correction (Hartree/particle) | 0.4396 | 0.4393 |
| Thermal correction to Energy | 0.4644 | 0.4642 |
| Thermal correction to Enthalpy | 0.4653 | 0.4651 |
| Thermal correction to Gibbs Free Energy | 0.3856 | 0.3860 |
| Sum of electronic and zero-point Energies | -1303.6762 | -1303.6709 |
| Sum of electronic and thermal Energies | -1303.6515 | -1303.6460 |
| Sum of electronic and thermal Enthalpies | -1303.6505 | -1303.6451 |
| Sum of electronic and thermal Free Energies | -1303.7302 | -1303.7242 |
| Energy/Transition State | (R) TS3 | (S) TS3 |
|---|---|---|
| Zero-point correction (Hartree/particle) | 0.4398 | 0.4399 |
| Thermal correction to Energy | 0.4645 | 0.4645 |
| Thermal correction to Enthalpy | 0.4654 | 0.4654 |
| Thermal correction to Gibbs Free Energy | 0.3861 | 0.3875 |
| Sum of electronic and zero-point Energies | -1303.6831 | -1303.6752 |
| Sum of electronic and thermal Energies | -1303.6584 | -1303.6506 |
| Sum of electronic and thermal Enthalpies | -1303.6575 | -1303.6497 |
| Sum of electronic and thermal Free Energies | -1303.7368 | -1303.7277 |
| Energy/Transition State | (R) TS4 | (S) TS4 |
|---|---|---|
| Zero-point correction (Hartree/particle) | 0.4395 | 0.4396 |
| Thermal correction to Energy | 0.4642 | 0.4644 |
| Thermal correction to Enthalpy | 0.4652 | 0.4653 |
| Thermal correction to Gibbs Free Energy | 0.3863 | 0.3848 |
| Sum of electronic and zero-point Energies | -1303.6849 | -1303.6837 |
| Sum of electronic and thermal Energies | -1303.6601 | -1303.6589 |
| Sum of electronic and thermal Enthalpies | -1303.6592 | -1303.6579 |
| Sum of electronic and thermal Free Energies | -1303.7380 | -1303.7385 |
| Parameter/Transition State | TS1 | TS2 | TS3 | TS4 |
|---|---|---|---|---|
| Free energy difference ΔG[(R)-(S)](kcal/mol) | 3.1*10-3 | -6.0*10-3 | -9.1*10-3 | 5.0*10-4 |
| Free energy difference ΔG[(R)-(S)](J/mol) | 13.08 | -25.36 | -38.24 | 1.92 |
| Ratio of concentrations K; K=exp[-ΔG/(RT)] | 0.995 | 0.990 | 0.985 | 0.999 |
| ee (%) | 99.0 (R) | 98.0 (S) | 96.9 (S) | 99.8 (R) |
In the case of styrene oxide, the transition state the lowest in energy is the one leading to the formation of the (S) enatiomer (Table 25), and where the phenyl ring of the alkene is oriented exo with respect to the fructose (as per methylstyrene oxide above). However, the results from Table 26 above indicate that the (R) epoxide is formed instead, with an ee of 99.8%, lit.[16]95%. This corroborates the results obtained in the previous section, where it was found that the computed enantiomer has the (R) configuration.
Using the Jacobsen catalyst
The thermodynamic quantities of the four possible transition states for the epoxidation of styrene using the Jacobsen catalyst are summarised in Tables 27 and 28. The ratio of concentrations K between enantiomers and enantiomeric excess was then calculated for each case; the results are summed up in Table 29.
Styrene
| Energy /Transition State | (R) TS1 | (S) TS1 |
|---|---|---|
| Zero-point correction (Hartree/particle) | 0.7356 | 0.7356 |
| Thermal correction to Energy | 0.7765 | 0.7765 |
| Thermal correction to Enthalpy | 0.7775 | 0.7775 |
| Thermal correction to Gibbs Free Energy | 0.6638 | 0.6632 |
| Sum of electronic and zero-point Energies | -3343.8891 | -3343.8968 |
| Sum of electronic and thermal Energies | -3343.8482 | -3343.8558 |
| Sum of electronic and thermal Enthalpies | -3343.8473 | -3343.8549 |
| Sum of electronic and thermal Free Energies | -3343.9609 | -3343.9692 |
| Energy/Transition State | (R) TS2 | (S) TS2 |
|---|---|---|
| Zero-point correction (Hartree/particle) | 0.7362 | 0.7365 |
| Thermal correction to Energy | 0.7767 | 0.7772 |
| Thermal correction to Enthalpy | 0.7776 | 0.7781 |
| Thermal correction to Gibbs Free Energy | 0.6642 | 0.6645 |
| Sum of electronic and zero-point Energies | -3343.8902 | -3343.8911 |
| Sum of electronic and thermal Energies | -3343.8497 | -3343.8505 |
| Sum of electronic and thermal Enthalpies | -3343.8487 | -3343.8495 |
| Sum of electronic and thermal Free Energies | -3343.9622 | -3343.9632 |
| Parameter/Transition State | TS1 | TS2 |
|---|---|---|
| Free energy difference ΔG[(R)-(S)](kcal/mol) | 8.3*10-3 | 1.0*10-3 |
| Free energy difference ΔG[(R)-(S)](J/mol) | 34.76 | 4.31 |
| Ratio of concentrations K; K=exp[-ΔG/(RT)] | 0.986 | 0.998 |
| Enantiomeric excess of R (%) | 97.2 | 99.6 |
As for the epoxidation using the Shi catalyst, the transition state the lowest in energy is the one leading to the formation of the (S) product. However the (R) enantiomer is found to be formed from the enatiomeric excess calculation, with an ee of 97.2%. As per above with the Shi catalyst, this is in accordance with the result obtained for the epoxide computed.
Non-covalent interactions (NCI) analysis in the active site of the reaction transition state of β-methylstyrene oxide
The electron density of the transition state of the epoxidation of β-methylstyrene leading to the (S,S) epoxide was computed and an NCI analysis was carried out; the results are given in the diagram below:
Arrow 1 indicates the formation of the C-O bond of the epoxide in the transition state; it is half-covalent[8] and is thus not an NCI per se. Arrow 2 shows the important mildly attractive interaction that spreads across the whole region located in between the Shi catalyst and its substrate, that is where the alkene interacts with the catalyst to form the epoxide product. Arrow 3 indicates the mildly repulsive interaction in the center of the alkene's aromatic ring. Arrow 4 shows the strongly repulsive interaction existing in the center of the 1,3-dioxolane ring of the catalyst.
Electronic topology (QTAIM) analysis in the active-site of the reaction transition state of β-methylstyrene
A QTAIM analysis complementary to the NCI analysis above was carried out for the transition state of β-methylstyrene; the results are given in the diagram below:
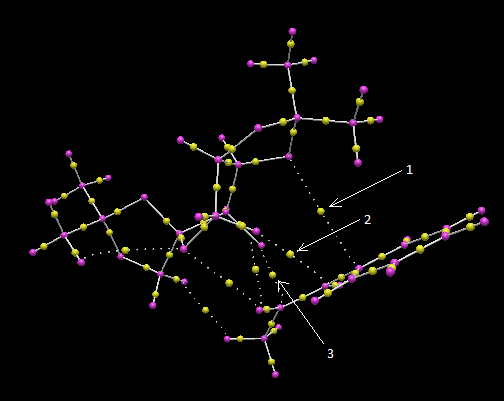
Numerous non-covalent critical points (BCPs)[8] are observed between the Shi catalyst and the alkene. In particular, each dioxirane oxygen of the catalyst establishes one BCP with one end of the alkene double bond (arrows 2 and 3). These BCPs are located approximately mid-way between the two atoms they connect. There are further non-covalent BCPs which help stabilise the transition state, like for example the one between an oxygen atom of the 1,3-dioxolane ring and the tertiary carbon atom of the alkene (arrow 1).
Suggestion of a new candidate for investigation
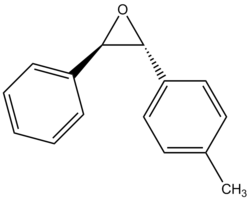
Reaxys was searched for a compound with ORP.ORP<'-500'; trans-(2R,3R)-2-(4-methylphenyl)-3-phenyl oxirane (OR=-580° at 436 nm)[17] was found:
However the corresponding alkene could not be found in the Sigma-Aldrich catalogue.
Conclusion
In this computational experiment, molecular mechanics was successfully applied to study the regioselectivity, atropisomerism and enantioselectivity of different compounds. Their NMR spectra could be further predicted and used to check the corresponding data reported in literature, which was shown to be wrong in some cases. However, limitations of computational predictions were also observed: in some cases, deviations between the calculated and experimental values were very high (well above 5 ppm), suggesting a wrong conformation in the region considered. Molecular mechanics was further used to determine the absolute configuration of the two epoxides styrene oxide and methylstyrene oxide by comparing the calculated value obtained for the optical rotation with the one found in literature. It was found by this method that the epoxides had the following absolute configurations: (R)-styrene oxide and (R,R)-methylstyrene oxide. The enantiomeric excesses determined from the calculated transition states were then used to check the absolute configuration of the products. The results corroborated for (R)-styrene oxide, however it was found that (S,S)-methylstyrene oxide was formed in excess. This last result is surprising, as the transition state the lowest in energy is observed for the one leading to the (R,R) product, this being due to phenyl group of the alkene being oriented exo with respect to the fructose, as in the case of the (R)-styrene transition state. The calculation of the enantiomeric excess for methyl styrene oxide might thus be wrong.
References
- ↑ 1.0 1.1 Clayden, Greeves, Warren and Wothers, Organic Chemistry, Oxford University Press, 2nd edn., 2007, ch. 35, pp. 912-917.
- ↑ D. Skala and J. Hanika, Petroleum and coal, 2003, 45, 3-4.
- ↑ 3.0 3.1 Clayden, Greeves, Warren and Wothers, Organic Chemistry, Oxford University Press, 2nd edn., 2007, ch. 18, pp. 457-461.
- ↑ 4.0 4.1 W. F. Mayer, P. Von Rague Schleyer, J. Am. Chem. Soc., 1981, 103, 1891.
- ↑ 5.0 5.1 5.2 5.3 5.4 5.5 L. Paquette et al, J. Am. Chem. Soc., 1990, 112, 277-283.
- ↑ S. D. Rychnovsky, Org. Lett., 2006, 8, 2895-2898.
- ↑ D. C. Braddock and H. S. Rzepa, J. Nat. Prod., 2008, 71, 728-730
- ↑ 8.0 8.1 8.2 3rd Year Organic Chemistry Computational ChemWiki
- ↑ J. H. Noordik and G. A. Jeffrey, Acta Cryst., 1977, B33, 403-408.
- ↑ M. Durik et al, Acta Cryst., 2001, E57, o672-o674.
- ↑ 11.0 11.1 11.2 11.3 K. Sarma et al., Tetrahedron: Asymmetry, 2009, 20, 1295-1300.
- ↑ 12.0 12.1 12.2 12.3 P. C. Bulman Page et al, Tetrahedron, 2009, 65, 2910-2915.
- ↑ F. R. Jensen and R. C. Kiskis, J. Am. Chem. Soc., 1975, 97, 5825-5831.
- ↑ 14.0 14.1 T. Katsuki et al., Angewandte Chemie, 2012, 51, 8243-8246.
- ↑ U. C. Davis Chemistry Wiki
- ↑ G. Berti et al., J. Org. Chem., 1965, 30, 4091.
- ↑ P. M. Dansette et al., Tetrahedron, 1976, 32, 2071-2074.

