Rep:Mod:cni
Inorganic computational experiment
Computational methods have proven to be great assets in modern chemistry. Through investigation of bond lengths and angles as well as orbitals new catalysts can be suggested as well as deeper mechanistic understanding of some fundamental reactions. The importance of computatinal methods has been recognised formally with two Nobel Prizes. In 1998 Kohn and Pople shared the Nobel prize for the development of the density functional theory and computational methods in quantum chemistry respectively.[1] More recently, in 2013 Karplus, Levitt and Warshel for their development of the method and consequent application to larger systems.[2]
Optimistaion and investigation of BH3
To begin, a molecule of BH3 was drawn in Gaussian. This was then altered by changing the bond lengths to 1.53, 1.54, 1.55 Å. This broke the symmetry of the molecule. It was then optimised using the 3-21 G basis set.
Item               Value     Threshold  Converged?
 Maximum Force            0.000220     0.000450     YES
 RMS     Force            0.000106     0.000300     YES
 Maximum Displacement     0.000709     0.001800     YES
 RMS     Displacement     0.000447     0.001200     YES
 Predicted change in Energy=-1.672478D-07
 Optimization completed.
    -- Stationary point found.
BH3 optimistaion
File Name = CN_BH3_OPT
File Type = .log
Calculation Type = FOPT
Calculation Method = RB3LYP
Basis Set = 3-21G
Charge = 0
Spin = Singlet
E(RB3LYP) = -26.46226429 a.u.
RMS Gradient Norm = 0.00008851 a.u.
Imaginary Freq =
Dipole Moment = 0.0003 Debye
Point Group = CS
Job cpu time:       0 days  0 hours  0 minutes 24.0 seconds.
Thus the optimisation was successful as a stationary point in the potential energy of the molecule was found.
Using a better basis set
This was the optimised using a more sophisticated basis set, namely, 6-31G (d,p). The use of a better basis set allows more functions to be used and so a more complex and 'true' description of the structure.
Item               Value     Threshold  Converged?
 Maximum Force            0.000204     0.000450     YES
 RMS     Force            0.000099     0.000300     YES
 Maximum Displacement     0.000659     0.001800     YES
 RMS     Displacement     0.000418     0.001200     YES
 Predicted change in Energy=-1.452164D-07
 Optimization completed.
    -- Stationary point found.
BH3 optimistaion.2
File Name = CN_BH3_OPT_2
File Type = .log
Calculation Type = FOPT
Calculation Method = RB3LYP
Basis Set = 6-31G(d,p)
Charge = 0
Spin = Singlet
E(RB3LYP) = -26.61532358 a.u.
RMS Gradient Norm = 0.00008206 a.u.
Imaginary Freq =
Dipole Moment = 0.0003 Debye
Point Group = CS
Job cpu time:       0 days  0 hours  0 minutes 26.0 seconds.
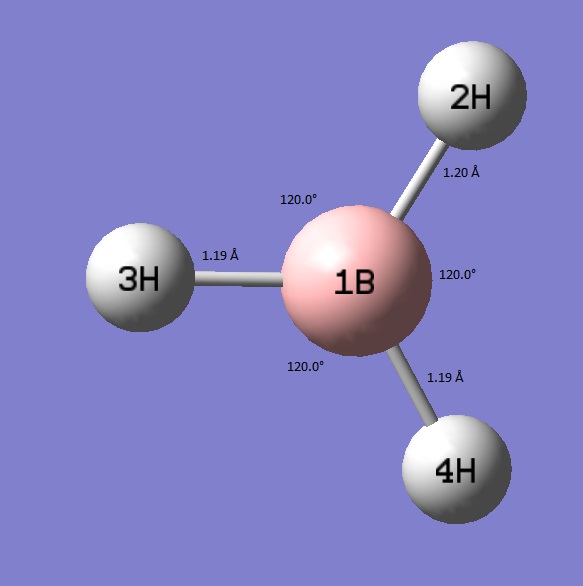
The diagram shows that to two decimal places the bond lengths are the same and the bond angles are still the theoretical ideal of 120° for a trigonal planar structure. Inspection of the two optimised structures beyond two decimal places for the bond lengths and beyond one decimal place for the bond angles shows generally a larger step towards the idealised D3h structure. However, despite the output involving up to 5 decimal places this isn't completely accurate and so values are only quoted according to conventional accuracy. Regardless, the better set has shortened the B-2H bond and improved the symmetry.
Optimistaion and investigation of GaBr3
Item               Value     Threshold  Converged?
 Maximum Force            0.000135     0.000450     YES
 RMS     Force            0.000089     0.000300     YES
 Maximum Displacement     0.000814     0.001800     YES
 RMS     Displacement     0.000533     0.001200     YES
 Predicted change in Energy=-1.782200D-07
 Optimization completed.
    -- Stationary point found.
GaBr3 optimisation.2
File Name = GABR3_OPT
File Type = .log
Calculation Type = FOPT
Calculation Method = RB3LYP
Basis Set = 6-31G(d,p)
Charge = 0
Spin = Singlet
E(RB3LYP) = -9638.24603597 a.u.
RMS Gradient Norm = 0.00006766 a.u.
Imaginary Freq =
Dipole Moment = 0.0000 Debye
Point Group = D3H
Job cpu time:       0 days  0 hours  0 minutes 22.0 seconds.
Thus it can be seen that the energy was successfully minimised as the values converged and a stationary point was found.
In this structure the point group was fixed to be D3h. Thus it is unsurprising that the bond lengths and angles are all euaivalent not only to two decimal places as conventionally shown but to all computed values. Some literature has measure the Ga-Br bond length at 2.35 Å.[3] However, this is with with larger electron donating groups and so may be responsible for the longer bond than computationally calculated.
BBr3 optimistaion and investigation.
Item               Value     Threshold  Converged?
 Maximum Force            0.000008     0.000015     YES
 RMS     Force            0.000005     0.000010     YES
 Maximum Displacement     0.000034     0.000060     YES
 RMS     Displacement     0.000023     0.000040     YES
 Predicted change in Energy=-3.605958D-10
 Optimization completed.
    -- Stationary point found.
BH3 optimistaion
File Name = CN_BBR3_OPT_631G_DP
File Type = .log
Calculation Type = FOPT
Calculation Method = RB3LYP
Basis Set = Gen
Charge = 0
Spin = Singlet
E(RB3LYP) = -64.43644957 a.u.
RMS Gradient Norm = 0.00000367 a.u.
Imaginary Freq =
Dipole Moment = 0.0001 Debye
Point Group = CS
Job cpu time:       0 days  0 hours  0 minutes 15.0 seconds.
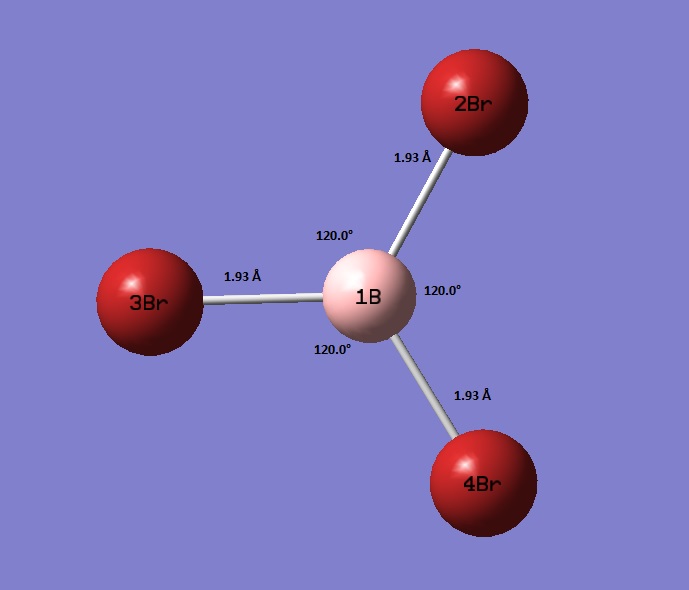
Unsurprisingly, the bond lengths lie between the that of GaBr3 and BH3. This is due to the larger atoms using more diffuse orbitals for bonding and as such having worse overlap with bonded atoms. This worse overlap can be seen in the greater bond distance.
Structure comparison
| Molecule | Computed value (Å) | Literature value (Å) | Percentage difference (%) |
|---|---|---|---|
| BH3 | 1.19 | 1.188 | 0.17 |
| GaBr3 | 2.26 | 2.243 | 0.76 |
| BBr3 | 1.93 | 1.903 | 1.42 |
Thus it can be seen that computational methods even using fairly basic basis sets, with rapid calculation times (all being under 30 seconds) can give very accurate results. It is not surprising that the larger errors are found in larger molecules with more electrons and so more complicated basis sets may be required to achieve more accurate results.
As before mentioned the increasing atomic size is a key factor in increasing bond distance. This is most evident in the comparison of BH3 and BBr3 which despite a greater ionic character, through a larger electronegativty difference, resulting in a strong bond the bond distance is still increased due the larger bromine compared to hydrogen. The effect of possible stabilisation via lone pairs on bromine donating into a vacant pz orbital on the boron, to relieve some of the electron deficiency was not investigated.
The comparison between GaBr3 and BBr3 allows an investigation into changing the central atom rather than the ligand. As before, Ga with a larger atomic radius has a larger bond length. However, this increase is not as marked as when the ligand is changed. When the ligand size is increased the bond length is increased by 0.74 Å (62%) whilst when the central atom is changed the bond length increases by 0.33 Å (17%). This may be attributed to the fact that Ga and Br are in the same period and so their orbital mismatch isn't as poor and so form a stronger bond with smaller bond length. However, another potential factor is simply steric crowding in the BBr3 product which isn't present in the GaBr3 product. As Ga is larger it can accommodate the Br molecules closer to it without having two Br atoms too close to each other.
Frequency analysis
Computational methods can also be used to probe vibrations of molecules and consequently predict their infrared spectrum. This is particularly interesting as molecular vibrations can be animated and thus allowing a more physical meaning an deasier understanding of symmetry of vibrations.
BH3
Item               Value     Threshold  Converged?
 Maximum Force            0.000006     0.000450     YES
 RMS     Force            0.000004     0.000300     YES
 Maximum Displacement     0.000023     0.001800     YES
 RMS     Displacement     0.000015     0.001200     YES
 Predicted change in Energy=-2.008834D-10
 Optimization completed.
    -- Stationary point found.
BH3_D3h_freq
File Name = CN_BH3_D3H_FREQ
File Type = .log
Calculation Type = FREQ
Calculation Method = RB3LYP
Basis Set = 6-31G(d,p)
Charge = 0
Spin = Singlet
E(RB3LYP) = -26.61532364 a.u.
RMS Gradient Norm = 0.00000146 a.u.
Imaginary Freq = 0
Dipole Moment = 0.0000 Debye
Point Group = D3H
Job cpu time:       0 days  0 hours  0 minutes  7.0 seconds.
Low frequencies ---  -11.0162  -11.0068   -5.2500    0.0009    0.0350    0.4552
 Low frequencies --- 1162.9794 1213.1423 1213.1425
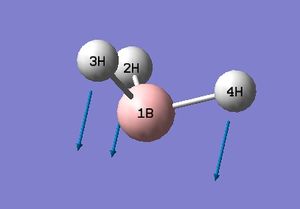
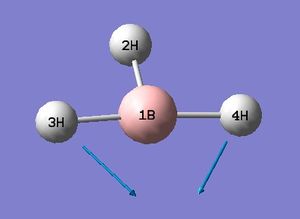
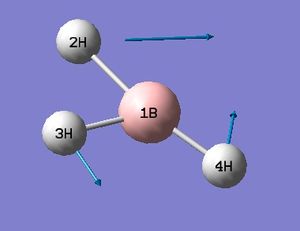
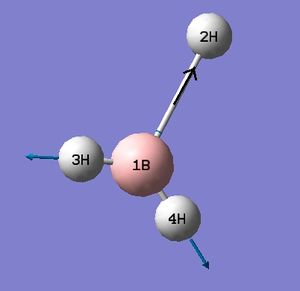
The low frequencies fall between ±15 and so energy minimisation was successful. This is supported by the successful location of a stationary point with converged values shown in the item table. The lowest real frequency is 1163 cm-1. As a triatomic molecule 3N-6 vibrational modes may be predicted. Below are animations as calculated by Gaussian for BH3.
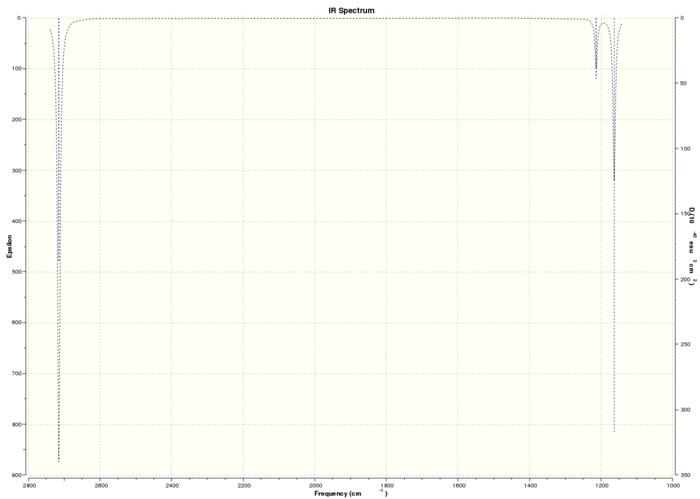
Computed IR Spectrum of BH3
The computed spectrum shows three peaks 2715, 1213 and 1163 cm-1. This is due to an overlap of vibrations 2 with 3 and 5 with 6. Vibration four is a symmetric stretch and so there is no change in the overall dipole moment and therefore IR inactive and not seen.
GaBr3
The same calculation was carried out on a molecule of GaBr3.
Item               Value     Threshold  Converged?
 Maximum Force            0.000000     0.000015     YES
 RMS     Force            0.000000     0.000010     YES
 Maximum Displacement     0.000000     0.000060     YES
 RMS     Displacement     0.000000     0.000040     YES
 Predicted change in Energy=-4.242680D-15
 Optimization completed.
    -- Stationary point found.
 Low frequencies ---   -2.3877   -2.3877   -1.4221    0.0128    0.0200    0.0337
 Low frequencies ---   86.9739   86.9740  119.7676
Again successful minimsiation was confirmed by the location of a stationary point as well converged values. The lowest real frequency is 87 cm-1.
GaBr3 optimisation.2. freq
File Name = GABR3_OPT_FREQ
File Type = .log
Calculation Type = FREQ
Calculation Method = RB3LYP
Basis Set = 6-31G(d,p)
Charge = 0
Spin = Singlet
E(RB3LYP) = -9638.24600758 a.u.
RMS Gradient Norm = 0.00000001 a.u.
Imaginary Freq = 0
Dipole Moment = 0.0000 Debye
Point Group = D3H
Job cpu time:       0 days  0 hours  0 minutes 21.0 seconds.
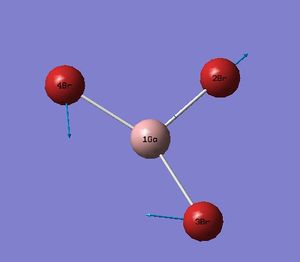
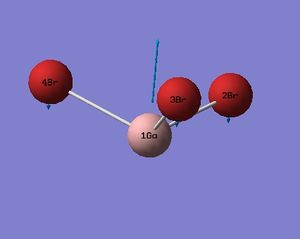
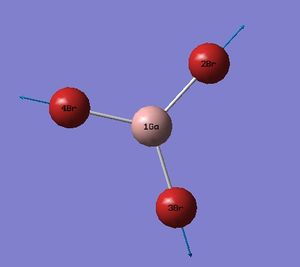
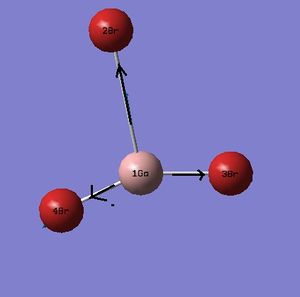
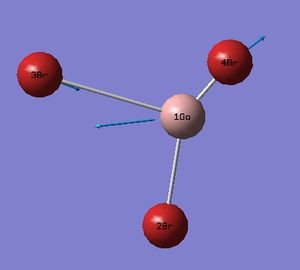
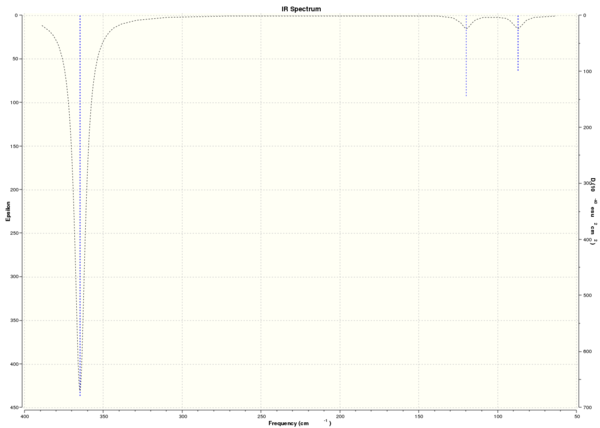
The computed spectrum is also presented. There is s reordering of vibrational modes observed. The A2 mode is lowest in the BH3 molecule but third in the GaBr3 molecule with one of the E' now lowest in energy.
Computed IR spectrum of GaBr3
Again there are two overlays an an IR inactive mode resulting in three peaks.
| BH3 (cm-1) | GaBr3 (cm-1) |
|---|---|
| 1163 | 87 |
| 1213 | 119 |
| 2715 | 365 |
The intensities compared to that of BH3 are much less resulting broader peaks. Of note also is the frequency of the bonds oscillation. This is not surprising with the knowledge that the vibrations can be considered as two masses on a spring. In the GaBr3 molecule the masses are significantly heavier than those in BH3. Simply the sum of the atomic masses in a Ga-Br bond is 149.624 amu. For B-H it is 11.81 amu. Spectroscopily it is much more relevant to compare the reduced mass,μ. μ=m1m2/m1+m2.
Thus it can be seen that Ga-Br has a reduced mass of 6.21 x 10⁻²⁶. The reduced mass of B-H is 1.5 x10⁻²⁷
The relative pattern between the spectra is common however with 3 low frequency vibrations, with two of these degenerate, one vibration being a symmetrical stretch and so IR inactive and then two higher frequency degenerate modes. The fundamental difference between the high and low frequency vibrations is the method of vibration. Bending motions tend to be lower in energy and so have a lower frequency which is seen in the spectra. Contrastingly, stretches are higher energy motions and so have a higher frequency.
The nature of a chemical bond is hard to define. It is often considered simply to be the attraction of two or more atoms. The bond may be between ions, or ions and dipoles. Electrostatic attractions include ionic bonding as well as Van der Waals forces which include the attraction between spontaneous and induced dipoles. However, difficult questions include how strong the interaction must be to be considered a bond as well as if there is a distance requirement for a bond. A better description of a bond may be that is it a cooperative interaction which lowers the overall energy of the system.
Molecular orbitals of BH3
 BH3_D3h
File Name = CN_BH3_D3H_NBO
File Type = .chk
Calculation Type = FOPT
Calculation Method = RB3LYP
Basis Set = 6-31G(D,P)
Charge = 0
Spin = Singlet
Total Energy = -26.61532364 a.u.
RMS Gradient Norm = 0.00000211 a.u.
Imaginary Freq =
Dipole Moment = 0.0000 Debye
Point Group = D3H
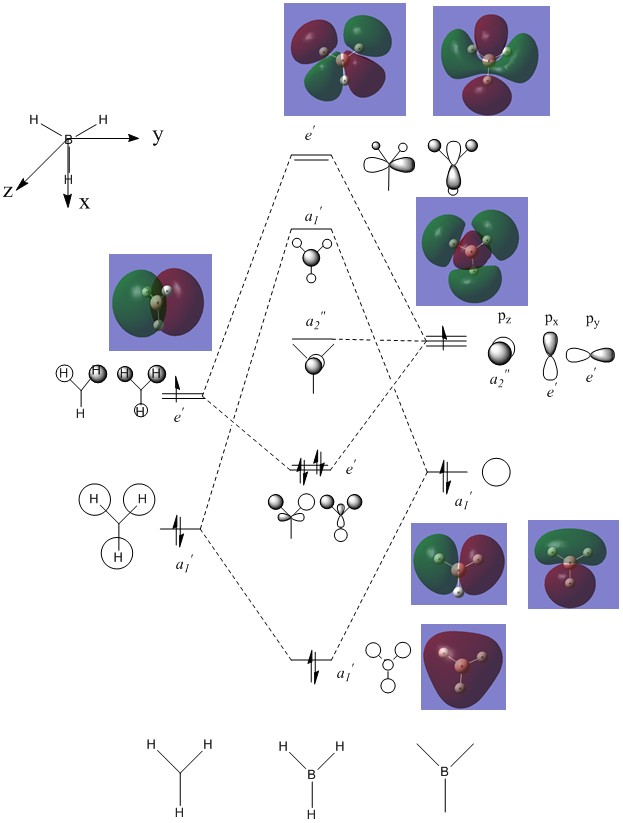
Molecular orbital diagram of BH3
Not shown in the MO diagram is the s orbital localised on the boron which is too low in energy to interact with any other orbitals. It was computationally found at -6.77 au. Clearly, the use of LCAO is a powerful approximation to the appearance of orbitals shown by the similarities with the computed orbitals. Whilst they are useful for determining the general shape of orbitals and hence the general degree of bonding/antibonding character it doesn't give an absolute qualitative value for the energy of orbitals and so for more complex systems involving mixing for example the ordering of orbitals can be difficult.
NBO analysis of NH3
Orbitals in NH3
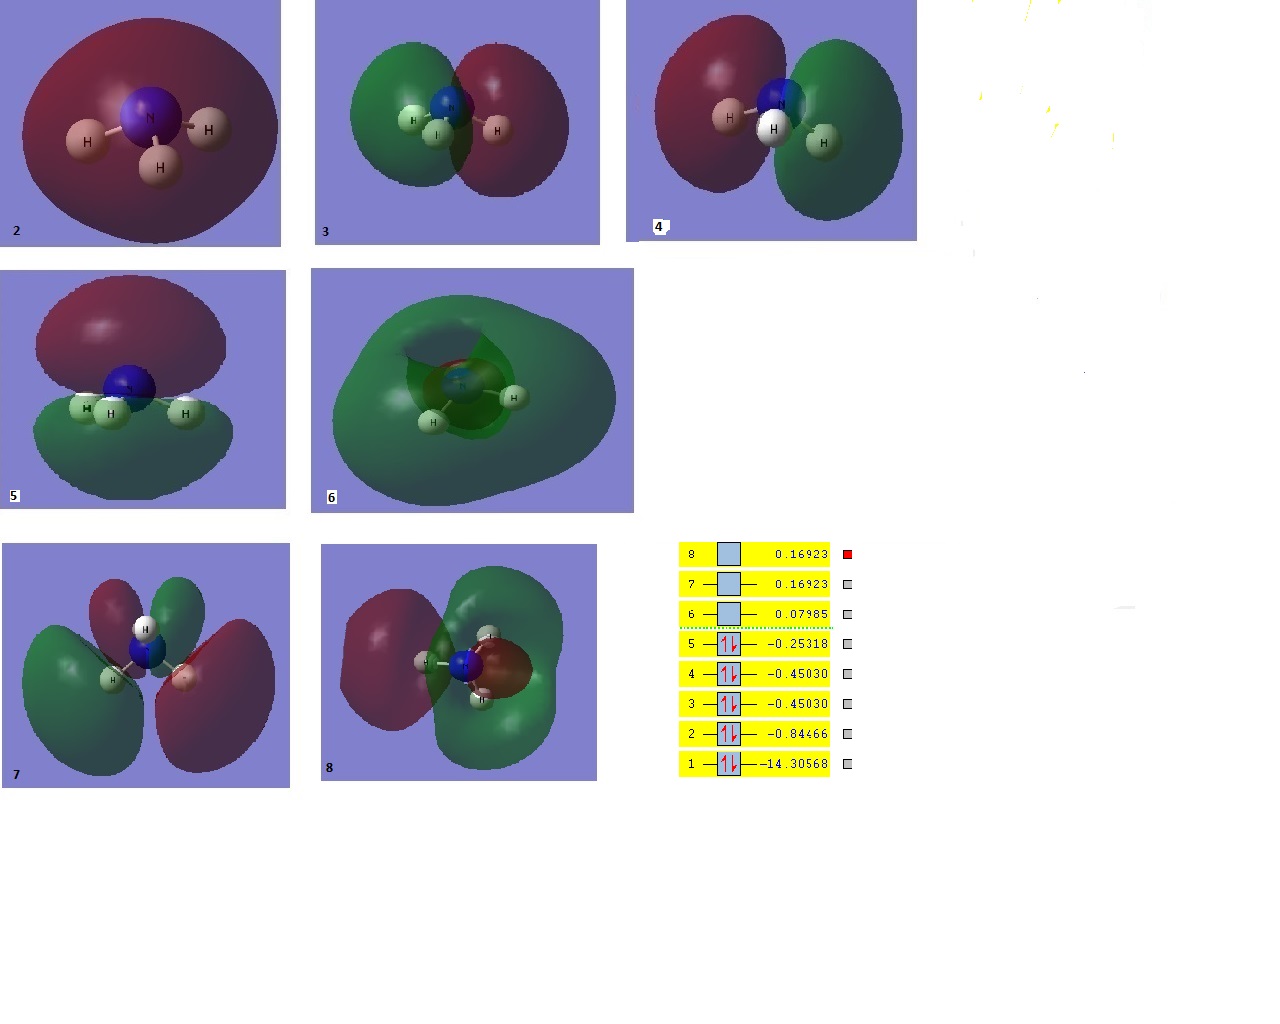 It is interesting to note again that orbital 1 as computed was a s orbital localised on the nitrogen atom. The value for this orbital at -14 a.u is much lower than that of boron, due to the greater electronegativity of nitrogen compared to boron resulting in a lowering of orbitals.
Low frequencies ---   -0.0015   -0.0013   -0.0010    3.2005    6.2581    7.7429
 Low frequencies --- 1089.3668 1693.9325 1693.9356
NH3_freq
File Name = NH3_FREQ
File Type = .log
Calculation Type = FREQ
Calculation Method = RB3LYP
Basis Set = 6-31G(d,p)
Charge = 0
Spin = Singlet
E(RB3LYP) = -56.55776872 a.u.
RMS Gradient Norm = 0.00000314 a.u.
Imaginary Freq = 0
Dipole Moment = 1.8465 Debye
Point Group = CS
Job cpu time:       0 days  0 hours  0 minutes  7.0 seconds.
Item               Value     Threshold  Converged?
 Maximum Force            0.000006     0.000015     YES
 RMS     Force            0.000004     0.000010     YES
 Maximum Displacement     0.000013     0.000060     YES
 RMS     Displacement     0.000009     0.000040     YES
 Predicted change in Energy=-1.074695D-10
 Optimization completed.
    -- Stationary point found.
Successful minimisation was done shown by the location of a stationary point and the low frequency within acceptable boundaries. The lowest frequency is 1089 cm-1.
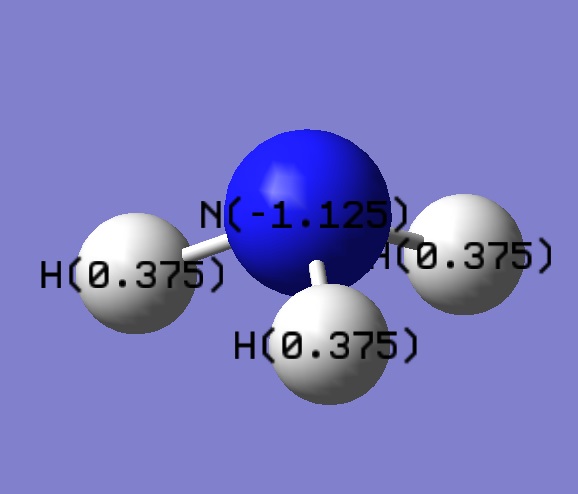
Using the .log file the charge distribution was investigated. Unsurprisingly, nitrogen was found to be negative whilst the hydrogens were positive. Whilst giving a basic quantitative image, the charge distribution can also be investigated quantitatively. Although there is nothing to compare it to, the difference in electronegativities between nitrogen and hydrogen is clear.It is worth noting that the sum of the positive hydrogens is equal and opposite to the nitrogen as ammonia is an uncharged molecule.
Ammonia borane
Ammonia borane has received interest as a potential hydrogen store. It is formed by the reaction of boron and ammonia. By evaluating the energies of the reactants and products the energy of the forward reaction (formation of the ammonia borane) can be assessed.
Ammonia borane
File Name = AMMONIABORANE
File Type = .log
Calculation Type = FOPT
Calculation Method = RB3LYP
Basis Set = 6-31G(d,p)
Charge = 0
Spin = Singlet
E(RB3LYP) = -83.22468906 a.u.
RMS Gradient Norm = 0.00000124 a.u.
Imaginary Freq =
Dipole Moment = 5.5646 Debye
Point Group = C1
Job cpu time:       0 days  0 hours  1 minutes  0.0 seconds.
ammonia borane-freq
File Name = AMMONIABORANE_FREQ
File Type = .log
Calculation Type = FREQ
Calculation Method = RB3LYP
Basis Set = 6-31G(d,p)
Charge = 0
Spin = Singlet
E(RB3LYP) = -83.22468908 a.u.
RMS Gradient Norm = 0.00000124 a.u.
Imaginary Freq = 0
Dipole Moment = 5.5646 Debye
Point Group = C1
Job cpu time:       0 days  0 hours  0 minutes 29.0 seconds.
File:AMMONIABORANE FREQ.CN.LOG
Thus it can be seen that the energy minismisation was successful with location of a stationary point, converged values and low frequencies in an accepted range.
| NH3 | BH3 | H3BNH3 | Sum (au) | Sum (kJ/mol) |
| -56.5577682 | -26.61532364 | -83.22468906 | -0.0516 | -135.4684815 |
Thus it can be seen that formation of the ammonia borane is favourable as it results in a lower energy product. Due to computed accuracy this value can only be quoted to ±5 kJ/mol. Thus the formation of ammonia borane and by extension the formation of a B-N bond is approximately -135 kJ/mol.The formation of ammonia borane is comparable to the formation of a B-N bond. The computed value is reasonable with some literature findings of the enthalpy of formation of ammonia borane found to be 73.3 kJ mol[4] The equilibrium constant can also be calculated using dG=-RTlnK. This was found to be 5 x 10²³ The reason for this stability is probably due to the resonance forms possible in ammonia borane.
References
- ↑ http://www.nobelprize.org/nobel_prizes/chemistry/laureates/1998/
- ↑ http://www.nobelprize.org/nobel_prizes/chemistry/laureates/2013/
- ↑ R. W. H. Small and I.J. Worrall, Acta Cryst. 1982, 38, 86-87
- ↑ G. Leroy, M. Sana, C. Wilante, Theoretica chimica acta, March 1993, Volume 85, Issue 1-3, pp 155-166
Mini report: Acid and bases
Dimers of the general formula AlBrCl2 were investigated. This was done using the HPC and the GEN basis set with 6-31G(d,p) on the Al and Cl and the LanL2DZ set on the Br.
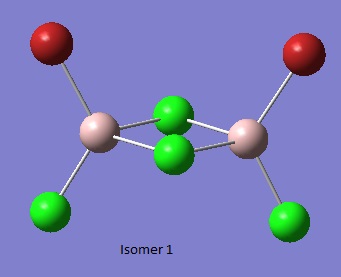
Isomer 1[1]
Item               Value     Threshold  Converged?
 Maximum Force            0.000054     0.000450     YES
 RMS     Force            0.000026     0.000300     YES
 Maximum Displacement     0.001103     0.001800     YES
 RMS     Displacement     0.000443     0.001200     YES
 Predicted change in Energy=-9.817401D-08
 Optimization completed.
    -- Stationary point found.
Al2Br2Cl4_CN_1
File Name = checkpoint_88982-2
File Type = .fch
Calculation Type = FOPT
Calculation Method = RB3LYP
Basis Set = GEN
Charge = 0
Spin = Singlet
Total Energy = -2352.41626654 a.u.
RMS Gradient Norm = 0.00003436 a.u.
Imaginary Freq =
Dipole Moment = 0.1629 Debye
Point Group =
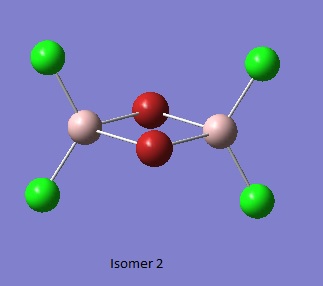
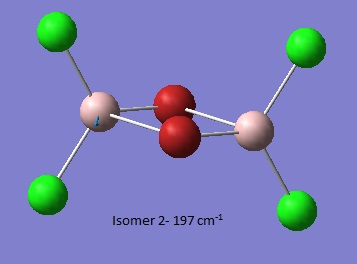
Isomer 2 [2]
Item               Value     Threshold  Converged?
 Maximum Force            0.000010     0.000450     YES
 RMS     Force            0.000004     0.000300     YES
 Maximum Displacement     0.000579     0.001800     YES
 RMS     Displacement     0.000290     0.001200     YES
 Predicted change in Energy=-8.499644D-10
 Optimization completed.
    -- Stationary point found.
Al2Br2Cl4_CN_1
File Name = checkpoint_88950-2
File Type = .fch
Calculation Type = FOPT
Calculation Method = RB3LYP
Basis Set = GEN
Charge = 0
Spin = Singlet
Total Energy = -2352.40630798 a.u.
RMS Gradient Norm = 0.00000704 a.u.
Imaginary Freq =
Dipole Moment = 0.0016 Debye
Point Group =
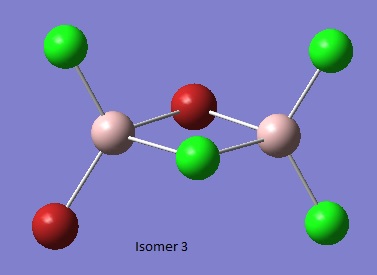
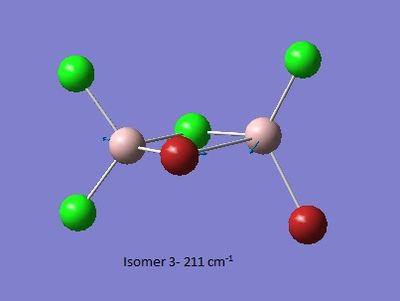
Isomer 3 [3]
Intrestingly, this isomer exists as two enantiomers. However, by definition the opposing enantiomer would have the same energy. Optical rotation calculations could have been undertaken and compared to experimental values.
Item               Value     Threshold  Converged?
 Maximum Force            0.000120     0.000450     YES
 RMS     Force            0.000031     0.000300     YES
 Maximum Displacement     0.001216     0.001800     YES
 RMS     Displacement     0.000411     0.001200     YES
 Predicted change in Energy=-5.931896D-08
 Optimization completed.
    -- Stationary point found.
 Al2Br2Cl4_CN_1
File Name = checkpoint_88957-2
File Type = .fch
Calculation Type = FOPT
Calculation Method = RB3LYP
Basis Set = GEN
Charge = 0
Spin = Singlet
Total Energy = -2352.41109934 a.u.
RMS Gradient Norm = 0.00004234 a.u.
Imaginary Freq =
Dipole Moment = 0.1378 Debye
Point Group =
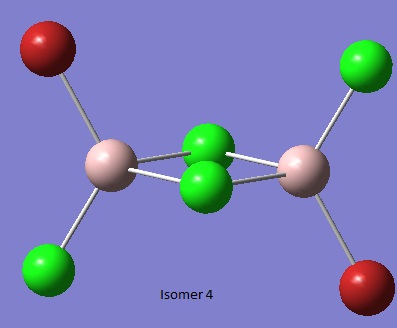
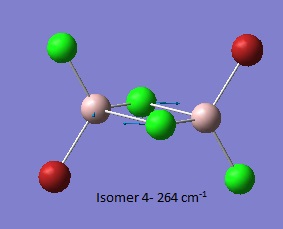
Isomer 4 [4]
Al2Br2Cl4_CN_1
File Name = checkpoint_88985-3
File Type = .fch
Calculation Type = FOPT
Calculation Method = RB3LYP
Basis Set = GEN
Charge = 0
Spin = Singlet
Total Energy = -2352.41631605 a.u.
RMS Gradient Norm = 0.00002605 a.u.
Imaginary Freq =
Dipole Moment = 0.0013 Debye
Point Group =
Item               Value     Threshold  Converged?
 Maximum Force            0.000041     0.000450     YES
 RMS     Force            0.000020     0.000300     YES
 Maximum Displacement     0.000334     0.001800     YES
 RMS     Displacement     0.000158     0.001200     YES
 Predicted change in Energy=-2.051200D-08
 Optimization completed.
    -- Stationary point found.
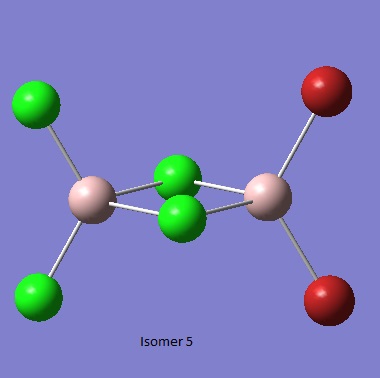
Isomer 5 [5]
Whilst not strictly an isomer of the dimer from the AlBrCl2 monomer, via the Schlenk equliibrium, it is likely that this compound would exist in solution. As such it's energy was calculated but no freqeuncy analysis was undertaken.
Al2Br2Cl4_CN_1
File Name = checkpoint_88963-2
File Type = .fch
Calculation Type = FOPT
Calculation Method = RB3LYP
Basis Set = GEN
Charge = 0
Spin = Singlet
Total Energy = -2352.41632882 a.u.
RMS Gradient Norm = 0.00002549 a.u.
Imaginary Freq =
Dipole Moment = 0.1893 Debye
Point Group =
Item               Value     Threshold  Converged?
 Maximum Force            0.000038     0.000450     YES
 RMS     Force            0.000020     0.000300     YES
 Maximum Displacement     0.001641     0.001800     YES
 RMS     Displacement     0.000579     0.001200     YES
 Predicted change in Energy=-7.058482D-08
 Optimization completed.
    -- Stationary point found.
Isomer comparison
| Isomer 1 | Isomer 2 | Isomer 3 | Isomer 4 | Isomer 5 | |
| Energy (a.u) | -2352.416267 | -2352.406308 | -2352.411099 | -2352.416316 | -2352.416329 |
| Diff in energy (au) | -4.951E-05 | -0.01000807 | -0.00521671 | 0 | 1.277E-05 |
| Diff in energy (kJ/mol) | -0.129988487 | -26.27618398 | -13.69647012 | 0 | 0.03352763 |
As such it is clear that three structures are very close in energy with two structures higher in energy. Due computational uncertainty it is unclear which structure would have the absolute lowest energy. It would suggest that bridging bromines are unfavourable with the highest energy structure involving two bridging bromine groups. It is suggested that the trans structure would be lowest energy as it the bromines are furthest apart and so limited steric clashing would occur. Furthermore, the dipole monemt is minimsed for this structure and so would also be a stabilising factor. Interestingly, isomer 5 is predicted to have the lowest energy. Whilst this is not a true isomer it would exist in solution. Although having a large dipole moment, it may be stabilised by the two adjacent bromines being at an attractive Van der Waals distance.
Monomer investigation
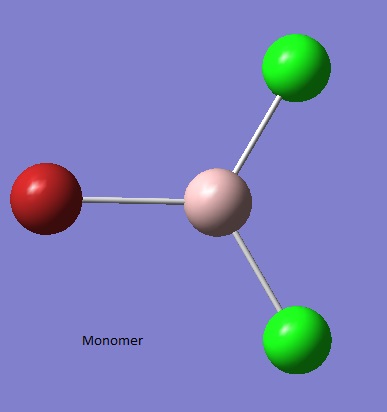
The energy of dimeristaion was also investigated. This was done by first calculating the energy of the monomer.
Item               Value     Threshold  Converged?
 Maximum Force            0.000136     0.000450     YES
 RMS     Force            0.000073     0.000300     YES
 Maximum Displacement     0.000681     0.001800     YES
 RMS     Displacement     0.000497     0.001200     YES
 Predicted change in Energy=-7.984436D-08
 Optimization completed.
    -- Stationary point found.
File Name = Monomer_CN
File Type = .log
Calculation Type = FOPT
Calculation Method = RB3LYP
Basis Set = Gen
Charge = 0
Spin = Singlet
E(RB3LYP) = -1176.19013679 a.u.
RMS Gradient Norm = 0.00004196 a.u.
Imaginary Freq =
Dipole Moment = 0.1075 Debye
Point Group = C2V
Job cpu time:       0 days  0 hours  0 minutes 16.0 seconds.
Thus it was calculated that the energy of two monomers = -2352.380274 a.u. Thus the dG of dimeristaion is -94 kJ/mol. This is representattive of a lnK value of 3 x 10⁶. This shows that dimeristaion is highly favourable. This is due to the vacnt orthogonal p orbital on the Aluminium making the species electron deficient. This electron deficiency can be alleviated through the formation of dimers.
Frequency analysis of the isomers
Frequency analysis was undertaken for all the dimers formed of the monomer unit of AlCl2Br2. This was done using the HPC and the same GEN basis set with 6-31G(d,p) on the Al and Cl and the LanL2DZ set on the Br.
| Isomer 1[6] | Isomer 2[7] | Isomer 3[8] | Isomer 4[9] |
|---|---|---|---|
 |
 |
 |
|
| Low frequencies --- -4.0587 -2.0775 -0.0021 0.0019 0.0028 1.5545
Low frequencies --- 17.2003 50.9114 78.5451 |
Low frequencies --- -5.1638 -5.0470 -3.1763 0.0044 0.0045 0.0048
Low frequencies --- 14.8308 63.2723 86.0759 |
Low frequencies --- -2.4136 -0.0026 -0.0011 0.0027 1.6792 3.3814
Low frequencies --- 17.2787 56.0049 80.0479 |
Low frequencies --- -0.0035 -0.0033 -0.0028 1.4634 1.9565 3.6938
Low frequencies --- 18.1023 49.0768 72.9290 |
| File:Isomer1 freq log.txt | File:Isomer2 freq log CN.txt | File:Isomer3 freq log CN.txt | File:Isomer4 freq log CN.txt |
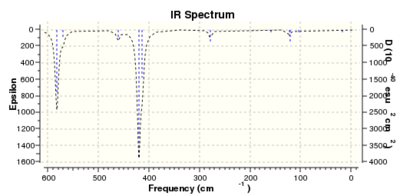
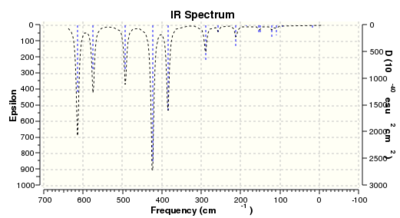
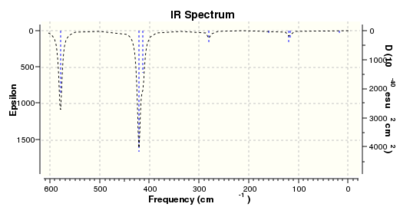
Thus it is instantly obvious that isomer 4 and isomer 1 are closely related, symmetry-wise but isomer 4 is slightly more symmetric with slightly fewer peaks. This is unsurprising when the point groups of the isomers was investigated. Isomer 1 is C2v. isomer 2 is D2h, isomer 3 is C1 and isomer 4 is C2h. However, closer inspection at of the spectra with focus on peaks above 100 D, it is clear that the the structures are quite varied in the number and location of the peaks.
| Isomer 1 (cm-1) | Isomer 2 (cm-1) | Isomer 3 (cm-1) | Isomer 4 (cm-1) |
| 17 | 108 | 110 | 18 |
| 103 | 126 | 121 | 117 |
| 121 | 138 | 149 | 120 |
| 123 | 241 | 154 | 160 |
| 158 | 341 | 211 | 280 |
| 279 | 467 | 257 | 413 |
| 413 | 616 | 289 | 421 |
| 420 | 384 | 579 | |
| 461 | 424 | ||
| 570 | 493 | ||
| 582 | 575 | ||
| 614 |
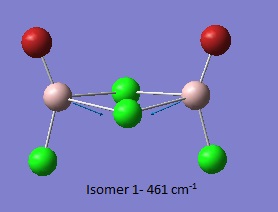
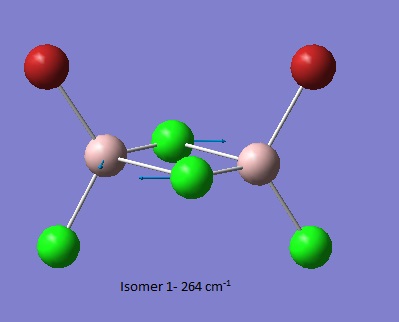
The individual vibrations were investigated with the intention of observing which modes had changed energy and how the symmetry of the different isomers made certain vibrations inactive by resulting in no change in the dipole moment.
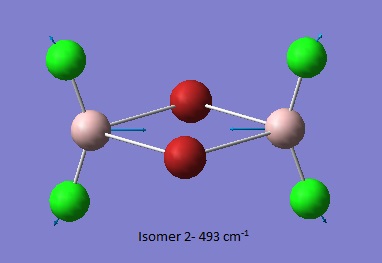
Of most interest in the spectra are the Al-Br stretches as they disrupt the symmetry and, being much larger and heaver than the other atoms and so anchors some of the motions. These can be separated into when Br is the bridging group and when it is the terminal group. In the case of isomer 3 it has one bridging and one terminal bromine. Generally the bridging motions can be observed in the 11th-14th highest energy motions whilst the vibrations involving terminal groups are the four highest energy vibrations, 15 to 18 respectively.
Thus it can be seen the effect of the more massive bromines on the vibrations therefore the change in the dipole moment and therefore the overall spectra. In isomer 2 with both bromines bridging and the aluminum scissoring there is clearly no change in dipole moment and therefore no peak seen in the spectra at 494 cm-1. Contrastingly, Isomer 3 which has one bridging and one terminal Br the Al scissoring symmetry is broken via the much more mobile Al attached to two chlorines whilst the opposing Al is almost stationary as it is anchored by the terminal bromine. This results in a peak at 493 cm-1. Symmetry is also important in the determination of cis and trans isomers via prediction of the IR active bands using the reducible and irreducible representations. Isomer 1 is C2v point group whilst isomer 4 is C2h. As shown above isomer 1 has a peak a weak peak at 461 cm-1 whilst isomer 4 theoretically should have a peak at 459 cm-1. Whilst the same vibration is undertaken by all isomers the terminal bromines result in a distortion of the vibration out of the plane of the square. This is significant as it ensures isomer 1 has a peak, albeit small, due to the subtle dipole moment change whilst isomer 4 has no change in dipole moment as the distortions is symmetrical.
Unsurprisingly, the vibrations with the terminal bromines have lower reduced masses and force constants. This results in a lower frequency as theory may predict via:
Clearly, these are lower energy vibrations with a lower frequency. This can be seen by the much smaller force constant calculated within the bridging bonds. This can be understood by the fact the bonds are '3c-2e' in which electron deficiency of Al is relived by the formation of the dimer. With little electron density spread between the atoms the bond is weaker than a usual terminal 2c-2e bond. This results in a lower force constant for the bond and an overall lower frequency. The idea that bridging bromines is unfavourable is reinforced by isomer 2 having the lowest force constant for the bridging bonds. With isomer 3 with one chlorine and one bromine bridging the force constant is stronger but does not linearly increase to isomers 1 and 4 force constants with 2 bridging chlorines. This may be due to Al-Br bond angles forcing the Al-Cl bond angles away from their ideal and so adding to the destabilisation.
Closer inspection of the vibrations reveal subtle reordering of vibrational modes. For example, the third lowest frequency transition for isomers 1 (79 cm-1),3 (80 cm-1) and 4 (73 cm-1) involves the scissoring of terminal halides. Isomers 1 and 3 predict a low intensity peak in the IR spectrum whilst the symmetry with the trans bromines cancels out and so no peak is observed. Conversely, isomer 2 has the groups attached to Al twisting in a symmetrical fashion resulting in an IR inactive vibrational mode for the third lowest frequency (86 cm-1). Isomer 2 has the terminal halides scissoring as the fourth lowest frequency (87 cm-1).
Molecular analysis of isomer 4
The molecular orbitals were investigated of isomer 4 using the same gen basis set.
Al2Br2Cl4_CN_4_mo
File Name = checkpoint_89170
File Type = .fch
Calculation Type = SP
Calculation Method = RB3LYP
Basis Set = GEN
Charge = 0
Spin = Singlet
Total Energy = -2352.41631605 a.u.
RMS Gradient Norm = 0.00000000 a.u.
Imaginary Freq =
Dipole Moment = 0.0013 Debye
Point Group =
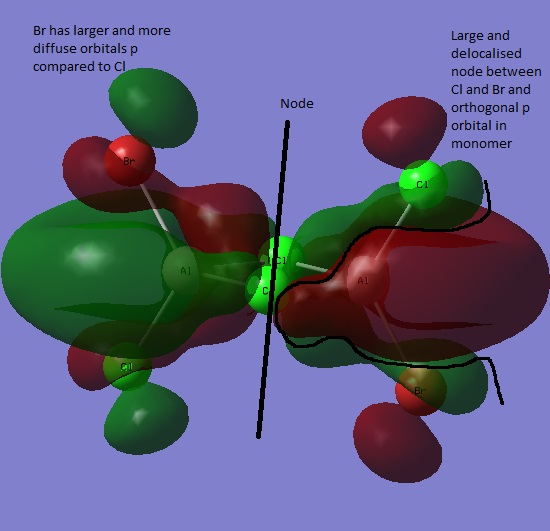
Orbital 58
Simulated orbital 58 was chosen as it is the first orbital with positive energy (0.01407) in the calculation. It is clearly very antibonding, having a positive energy as well as many nodes, including a very large and continuous localised node. The orbital has ungerade symmetry as inversion causes sign change.
Orbital 45
Orbital 54
Orbital 54 has ungerade symmentry and is the HOMO
Orbital 32
Orbital 32 has ungerade symmetry
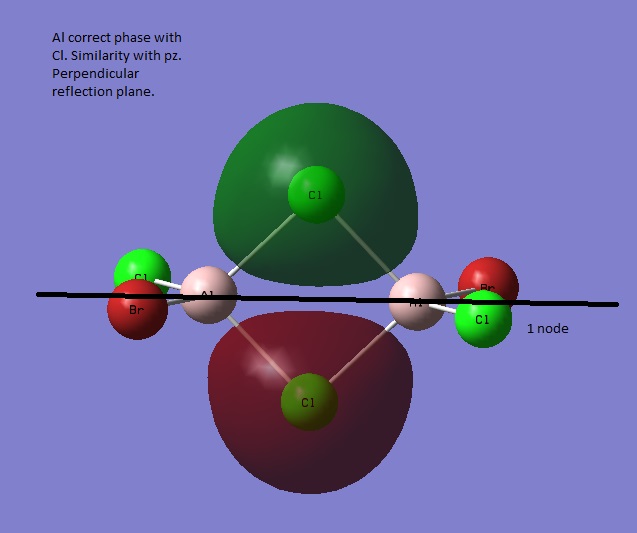
Orbital 38
The HOMO-LUMO band gap was found to 0.2546 au, which is approximately 13 eV.
References
- ↑ C. Nielsen, 2014, http://hdl.handle.net/10042/27948
- ↑ C. Nielsen, 2014, http://hdl.handle.net/10042/27949
- ↑ C.Nielsen, 2014, http://hdl.handle.net/10042/27950
- ↑ C.Nielsen, 2014, http://hdl.handle.net/10042/27951
- ↑ C. Nielsen 2014, http://hdl.handle.net/10042/27952
- ↑ C. Nielsen, 2014, http://hdl.handle.net/10042/27953
- ↑ C. Nielsen, 2014, http://hdl.handle.net/10042/27954
- ↑ C.Nielsen, 2014, http://hdl.handle.net/10042/27955
- ↑ C.Nielsen, 2014 http://hdl.handle.net/10042/27956

