Rep:Mod:cn2209module2
Analysis of BH3
Optimisation
Using the Gaussview program, a model of trigonal planar borane, BH3, was produced and analysed using computational techniques. All three B-H bond lengths were set to 1.5Å before a geometry optimisation was carried out using B3LYP as the method and 3-21G as the basis set. 3-21G is a relatively inaccurate basis set, but as borane is very small and the calculations will be quick it is suitable for this case. Below in Figure 1 is the resulting summary table after the optimisation. This shows the calculation carried out has been an optimisation FOPT, and the method and basis set are those already outlined. These tables will be displayed where relevant and show some other important information. E(RB3LYP) gives the summary energy (-26.462 Hartree). The dipole moment and point group are also given, as predicted BH3 has D3H symmetry point group and therefore no dipole moment.
| BH3 Optimisation | |
|---|---|
| File Name | BH3_OPT |
| File Type | .log |
| Calculation Type | FOPT |
| Calculation Method | RB3LYP |
| Basis Set | 3-21G |
| Charge | 0 |
| Spin | Singlet |
| E(RB3LYP) (a.u.) | -26.462 |
| RMS Gradient Norm (a.u.) | 0.00020672 |
| Imaginary Freq | |
| Dipole Moment (Debye) | 0 |
| Point Group | D3H |
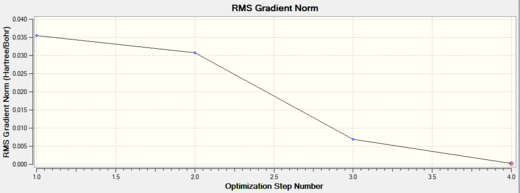
Possibly the most important information given in the table is the RMS gradient value, if it is less than 0.001 it immediately indicates the model has been adequately optimised. This value is actually the lowest point of the RMS gradient graph in Figure 2. The two graphs below show how the energy (left hand graph) and gradient of the energy (right hand graph) vary at each step of the optimsation. The overall aim of an optimisation is to find the structure which gives a minimum of potential energy, or in other words gives the first derivative of the PES to be zero. The graphs move toward zero as the structure is optimised, and this is why the gradient value from the table needs to be as low as possible.
Also measured using Gaussview were the B-H bond lengths and H-B-H bond angles, these were 1.9349Å and 120o respectively. These are in line with predicted angles of a trigonal planar structure and the value for bond length from the literature[1] - 1.867Å.
| Energy gradient of BH3 optimisation | RMS gradient of BH3 optimisation |
|---|---|
Another way of checking if the optimisation has been completed satisfactorily is by checking the "real" text based .log file. One part of the file is shown below. This confirms that the forces and displacements have converged, a stationary point has been found and the optimisation is therefore complete. This will be checked for every optimisation that follows but won't be referred to.
         Item               Value     Threshold  Converged?
 Maximum Force            0.000413     0.000450     YES
 RMS     Force            0.000271     0.000300     YES
 Maximum Displacement     0.001610     0.001800     YES
 RMS     Displacement     0.001054     0.001200     YES
 Predicted change in Energy=-1.071764D-06
 Optimization completed.
    -- Stationary point found.
Vibrational Analysis
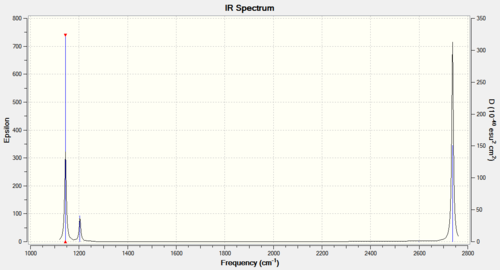
A vibrational or frequency analysis was then carried out for two reasons. It gives another confirmation that the model has been properly optimised and also provides a calculated prediction of the IR data of the molecule. Previously discussed, the first derivative of the PES gives its gradient and helps to find stationary points where the gradient is equal or near enough to zero. This however does not indicate whether the stationary points are at a minimum or a maximum. This is provided by the second derivative, given in essence by vibrational analysis frequencies. Positive second derivatives indicate a minimum and therefore a ground state. Negative second derivatives indicate a maximum or transition state. If negative frequencies are observed in the data, then a transition state is still present in the model, the bond is not at equilibrium and the model hasn't been fully optimised.
| Mode # | Motion Summary | Frequency | Intensity | Symmetry Label |
|---|---|---|---|---|
| 1 | Wagging | 1144.15 | 92.87 | A |
| 2 | Scissor | 1203.64 | 12.32 | E' |
| 3 | Rocking | 1203.64 | 12.32 | E' |
| 4 | Symmetric Stretch | 2598.42 | 0.00 | A' |
| 5 | Asymmetric Stretch | 2737.44 | 103.74 | E' |
| 6 | Asymmetric Stretch | 2737.44 | 103.73 | E' |
Figure 4: Frequency data for BH3
Looking at the data in Figure 4 no negative frequencies have been observed and so the model has been sufficiently optimised. Six vibrational modes have been found by the analysis and the animations are displayed in the links. Despite this, only three peaks are displayed in the spectrum, this is explained by looking at the frequencies and intensities for each mode. The fourth vibrational mode does not give a peak because it has zero intensity, it is a completely symmetric stretch and so does not involve any changes in the dipole moment. Two sets of vibrations are also degenerate and so the scissoring and the rocking as well as the asymmetric stretches will only give two peaks between the four of them.
Molecular Orbitals
Using the optimised BH3 model as a starting point, molecular orbitals and natural bond orbitals have been calculated. The 3D representations of these MOs which have been computed are displayed below alongside the equivalent MOs obtained empirically from a rational LCAO approach.

The first thing to note is that the diagram has not included the lowest energy orbital, an s orbital on the Boron which is so low in energy that it will not form any molecular orbitals. This orbital has been found to have a calculated energy of -6.73023, much more stabilised than the rest. The calculated MOs have predicted the same degeneracty of orbitals as the MO diagram, these are 3&4 and 6&7. The diagrams of the MOs produced by Gaussview are very similar to those gathered by the LCAO MO diagram, although they additionally show the overlap of the atomic orbitals aswell. The calculated MOs have also concluded that the 3a'1 MO is in fact the highest energy MO and higher in energy than the 2e' degenerate orbitals. This ordering can only be speculated on using the LCAO approach. The LCAO approach doesn't give values for energies like the computed calculations and so in general the computational gives a much better indication of how near or far apart the MOs are in terms of energy.
Natural Bond Order Analysis
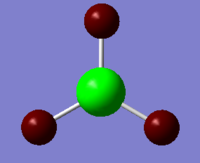
In Figure 8 below the charge distribution of borane has been qualitatively represented. Green indicates a positive charge and red indicates negative. These results are in line with what is expected, Boron being a Lewis deficient atom due to its vacant low lying p orbital.
Summary of Natural Population Analysis:

                                       Natural Population
                Natural  -----------------------------------------------
    Atom  No    Charge         Core      Valence    Rydberg      Total
 -----------------------------------------------------------------------
      B    1    0.33161      1.99903     2.66936    0.00000     4.66839
      H    2   -0.11054      0.00000     1.11021    0.00032     1.11054
      H    3   -0.11054      0.00000     1.11021    0.00032     1.11054
      H    4   -0.11054      0.00000     1.11021    0.00032     1.11054
 =======================================================================
   * Total *    0.00000      1.99903     6.00000    0.00097     8.00000
Figure 9:Summary of Natural Population Analysis obtained from the text based .log file
Looking at the the summary of the population analysis, the natural charges for each atom have been given. These again show the boron to be positively charged (0.33161) and the hydrogens to all be equally charged and negative (-0.11054). The results then show the molecule to be neutral as the total charge of the three hydrogens and the charge of the boron cancel out to zero charge. This is in agreement with prediction.
       (Occupancy)   Bond orbital/ Coefficients/ Hybrids
 ---------------------------------------------------------------------------------
     1. (1.99853) BD ( 1) B   1 - H   2
                ( 44.48%)   0.6669* B   1 s( 33.33%)p 2.00( 66.67%)
                                            0.0000  0.5774  0.0000  0.0000  0.0000
                                            0.8165  0.0000  0.0000  0.0000
                ( 55.52%)   0.7451* H   2 s(100.00%)
                                            1.0000  0.0000
     2. (1.99853) BD ( 1) B   1 - H   3
                ( 44.48%)   0.6669* B   1 s( 33.33%)p 2.00( 66.67%)
                                            0.0000  0.5774  0.0000  0.7071  0.0000
                                           -0.4082  0.0000  0.0000  0.0000
                ( 55.52%)   0.7451* H   3 s(100.00%)
                                            1.0000  0.0000
     3. (1.99853) BD ( 1) B   1 - H   4
                ( 44.48%)   0.6669* B   1 s( 33.33%)p 2.00( 66.67%)
                                            0.0000  0.5774  0.0000 -0.7071  0.0000
                                           -0.4082  0.0000  0.0000  0.0000
                ( 55.52%)   0.7451* H   4 s(100.00%)
                                            1.0000  0.0000
     4. (1.99903) CR ( 1) B   1           s(100.00%)
                                            1.0000  0.0000  0.0000  0.0000  0.0000
                                            0.0000  0.0000  0.0000  0.0000
     5. (0.00000) LP*( 1) B   1           s(100.00%)
Figure 10:Extract from text based .log file giving information on orbitals and contributions to bonding
The data above show that all B-H bonds are equivalent as they all have the same occupancy (1.99853) and have the exact same contributions - B contributes 44.48% to each bond and each H contributes 55.52%. It can also be seen that for each bond, B has 33.33% s character and 66.67% p character, or in other words is sp2 hybridised. This is again in agreement with what is expected. The only contentious piece of data is at point 5, the LP* refers to the vacant low lying p orbital on boron, it is presented however as having 100% s character. Perhaps this is the default response of medium level basis sets such as LanL2DZ whenever a vacant orbital is computed.
Analysis of TlBr3
Optimisation
TlBr3 contains the two atoms thallium and bromine which are relatively heavy and therefore have a high number of electrons. This presents a problem when using computational methods based on solving the Schrodinger equation. A solution to this problem is to assume that only the valence electrons are really involved in bonding, subsequently modelling just the core electrons by use of pseudo potentials makes the calculations quicker and easier, without necessarily reducing the accuracy appreciably.
| TlBr3 Optimisation | |
|---|---|
| File Name | tlbr3_opt |
| File Type | .log |
| Calculation Type | FOPT |
| Calculation Method | RB3LYP |
| Basis Set | LANL2DZ |
| Charge | 0 |
| Spin | Singlet |
| E(RB3LYP) (a.u.) | -91.218 |
| RMS Gradient Norm (a.u.) | 9x10⁻⁷ |
| Imaginary Freq | |
| Dipole Moment (Debye) | 0 |
| Point Group | D3H |
The point group of the TlBr3 was restricted to D3h and the model then optimised using the B3LYP calculation method and LanL2DZ as the pseudopotential basis set. The structure was restricted and a medium level basis set was used to speed up and simplify calculations. The summary table shows TlBr3 has an energy of -91.2 Hartree and the RMS gradient is low enough to conclude a sufficient stationary point has been found. Analysis of the structure reveals the Tl-Br bond length to be 2.65Å and the Br-Tl-Br bond angle to be 120o. This is in line with the literature[2] value (2.52Å) and bond angles for a molecule with D3h symmetry.
Frequency Analysis
Like for BH3, a frequency analysis has been carried out to confirm that no negative frequencies have been obtained and therefore that the optimisation has completed properly. The same method and LanL2DZ basis set has been used as for the optimisation and the summary table below gives the same summary energy of -91.218 Hartree which indicates the same optimised model has undergone frequency analysis.
| TlBr3 Frequency | |
|---|---|
| File Name | cahaltlbr3_freq |
| File Type | .log |
| Calculation Type | FREQ |
| Calculation Method | RB3LYP |
| Basis Set | LANL2DZ |
| Charge | 0 |
| Spin | Singlet |
| E(RB3LYP) (a.u.) | -91.218 |
| RMS Gradient Norm (a.u.) | 8.8x10⁻⁷ |
| Imaginary Freq | 0 |
| Dipole Moment (Debye) | 0 |
| Point Group | D3H |

| Mode # | Motion Summary | Frequency | Intensity | Symmetry Label |
|---|---|---|---|---|
| 1 | Scissor | 46.43 | 3.6867 | E' |
| 2 | Rocking | 46.43 | 3.6867 | E' |
| 3 | Wagging | 52.14 | 5.8466 | A2 |
| 4 | Symmetric Stretch | 165.27 | 0.00 | A'1 |
| 5 | Asymmetric Stretch | 210.69 | 25.4830 | E' |
| 6 | Asymmetric Stretch | 210.69 | 25.4797 | E' |
Figure 3: List of vibrational modes of TlBr3 obtained through frequency analysis
Looking at the spectrum, there is the same occurence of degenerate frequencies as observed for BH3. Vibrational modes 1&2 and 5&6 have the same frequency and intensity, the four modes therefore appear as only two peaks on the spectrum. Again, like with the borane frequency analysis, there is a symmetric stretch which involves no change in dipole moment and so has zero intensity and will not give a peak in the IR spectrum.
Analysis of Mo(CO)4(PCl3)2
The aim of the following section is to investigate the cis-trans isomerism exhibited by Mo(CO)4L2 where L=PCl3, using computational techniques. This is building on from a second year lab experiment investigating the vibrational spectra of Mo(CO)4(PPh3)2, except this time round the phenyls have been replaced with less computationally demanding chlorines. Chlorines are still relatively big groups and should behave electronically similar to phenyl in this case.

Optimisation 1 (LanL2MB Basis Set)
To start with, both isomers were modelled in Gaussview and then subjected to a low level optimisation using B3LYP as the method, LanL2MB as the pseudopotential and setting loose convergence criteria. A pseudopotential is needed due to presence of heavier atoms (Mo, P and arguably Cl). This first optimisation provides a rough estimate of the optimised geometry and has ensured that convergence has been reached. Below are summary tables for this optimisation for both isomers.
Figure 2: Summary table for optimisation of CIS
|
Figure 3: Summary table for optimisation of TRANS
|
|---|
Both isomers have been calculated as having almost identical energies of -617.5 Hartree, although the cis is ever so slightly more stabilised. The trans isomer has been calculated as having no dipole moment whereas the dipole moment of the cis isomer has been given as 8.5D. This is an extremely high value for a transition metal complex, a value this high would be more familiar on a polar solvent. Although the cis isn't as highly symmetrical as the trans and could be predicted to have a slightly greater dipole moment, a value this high can most likely be put down to inaccuracies of the method. Both have been assigned C1 point group symmetry, this can be justified by reference to the data below. So as to proceed to the next optimisation, it has been confirmed that the RMS gradient is below 0.001 and both have converged successfully.
| Mo-C (trans) | Mo-C (cis) | Mo-P | C≡O (trans) | C≡O (cis) | P-Cl (average) | C-Mo-C (trans) | C-Mo-C (cis)(average) | C-Mo-P (average) | P-Mo-P | Mo-P-Cl (average) | Cl-P-Cl (average) | |
|---|---|---|---|---|---|---|---|---|---|---|---|---|
| CIS | 2.11 | 2.06 | 2.53 | 1.19 | 1.19 | 2.40 | 178 | 89.0 | 89.9 | 95.6 | 120 | 97.4 |
| TRANS | N/A | 2.11 | 2.48 | N/A | 1.19 | 2.40 | 180 | 90.0 | 90.0 | 180 | 120 | 97.6 |
The results of the first optimisation don't conclude very much about the relative geometries of the two isomers. The bond lengths are often the same or very close and no trends can be observed. The bond angles however show the trans isomer to have L-Mo-L bond angles of 90o 180o to 3 significant figures. The optimisation has therefore produced an optimum octahedral geometry with greater accuracy than for the cis isomer.
Optimisation 2 (LANL2DZ Basis Set)
For the second optimisation, the resulting geometries from the loose optimisation were altered as follows in order to increase the chances of finding the lowest energy minima as opposed to just any minima along the PES.
| CIS Alterations | TRANS Alterations | ||||||
|---|---|---|---|---|---|---|---|
|
|
For the cis isomer, one Cl on each of the PCl3 groups was lined up parallel with an axial Mo-C, with these Cls pointing in opposite directions. For the trans isomer, all Cls were eclipsed, with one pair of trans related Cls lying parallel with an Mo-C bond. Both altered geometries were then optimised again but using a higher level pseudopotential - LanL2DZ. The convergence criteria was also tightened.
Figure 6: Summary table for 2nd optimisation of CIS
|
Figure 7: Summary table for 2nd optimisation of TRANS
|
|---|
The second optimisation has once again predicted the cis isomer to be slightly more stabilised than the trans by approximately 0.001 Hartree. The dipole moment of the cis isomer is no longer as high as previously, this second optimisation has therefore corrected this inaccuracy. The dipole moment of the trans isomer has increased slightly above 0, this can be attributed to the alterations made at the start. This made the PCl3 groups more symmetrical with respect to one another and therefore would slightly increase the dipole moment of the overall complex. The RMS gradients are low enough to conclude another suitable optimisation.
| Mo-C (trans) | Mo-C (cis) | Mo-P | C≡O (trans) | C≡O (cis) | P-Cl (average) | C-Mo-C (trans) | C-Mo-C (cis)(average) | C-Mo-P (average) | P-Mo-P | Mo-P-Cl (average) | Cl-P-Cl (average) | |
|---|---|---|---|---|---|---|---|---|---|---|---|---|
| CIS | 2.06 | 2.01 | 2.51 | 1.17 | 1.18 | 2.24 | 178 | 88.6 | 90.2 | 94.2 | 118 | 99.5 |
| TRANS | N/A | 2.06 | 2.44 | N/A | 1.17 | 2.24 | 180 | 90.0 | 90.0 | 177 | 118 | 99.3 |
After the second optimisation the disparity between the bond lengths that make up the average has decreased, in other words bonds that may be considered equivalent or of equal length have now become more closely matched. This is evidence that the second optimisation has been effective in optimising the geometry. Once again the trans isomer has L-Mo-L bond angles closer to the perfect octahedral geometry. It is rational to assume though that the cis isomer experiences steric clashing between the PCl3 groups which would bend the geometry out of a perfect octahedron. If steric clashing is taken into account it might predict the trans isomer to be more stable as it avoids these interactions.
Optimisation 3 (Accounting for dAOs)
Phosphorus can be problematic when optimising using computational methods. In certain situations it may be necessary to use a pseudopotential as it is a heavier 3rd row element and because it is hypervalent, to increase the accuracy it is useful to account for its d orbitals. This has been done in the third optimisation summarised below.
Figure 9: Summary table for 3rd optimisation of CIS
|
Figure 10: Summary table for 3rd optimisation of TRANS
|
|---|
The results show that the overall energies have now reversed, the previous two optimisations predicted cis to be more stable whereas the third optimisation now predicts trans to be more stable. This results seems more in line with theory. The steric clashing introduced before would be likely to destabilise the cis slightly but there is also a possible trans effect at work. Carbonyls are likely to be destabilised when trans to PCl3, due to the withdrawing of electrons from the carbonyl. Despite this the difference in energy is only 2.6255kJ/mol, this is a very small value and so the isomers would be very likely to interconvert at room temperature.
Frequency Analysis
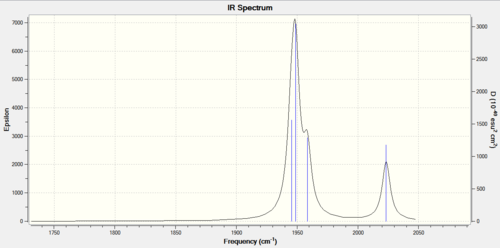
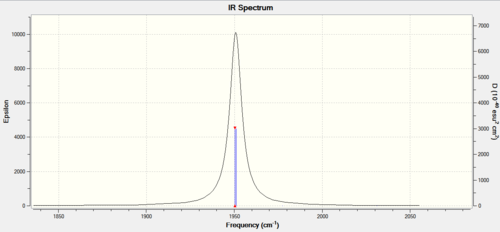
Using geometries from the third optimisation resulted in 5 negative frequencies for the cis and 4 for the trans, with one negative frequency as low as -82cm1. For this reason it was decided to repeat the frequency analysis with the optimised structures from the second LanL2DZ optimisation, this eliminated the problem. The results are set out below, with special consideration of the carbonyl stretches.
CIS
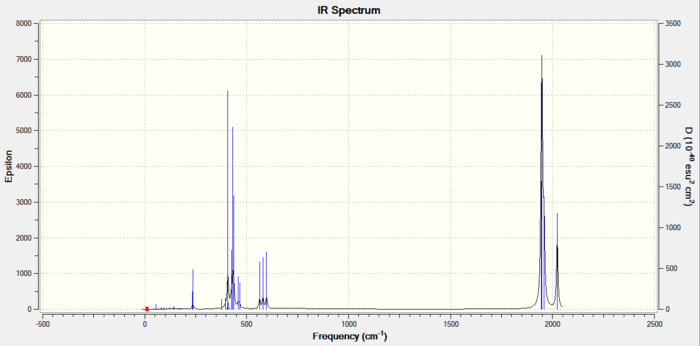
Figure 12: Carbonyl frequencies for CIS isomer |
 |
|---|
The spectrum shows four distinct carbonyl stretching frequencies, however the three lower frequency modes have overlapped to form just one peak. A brief summary of the Franck-Condon principle tells us that a vibrational mode will have a larger intensity when associated with a greater change in dipole moment. As the asymmetric stretches (specifically the asymmetric stretch of the carbonyls cis to phosphines) have greater intensities, it can be concluded that these separate the charges of the molecule slightly more.
TRANS
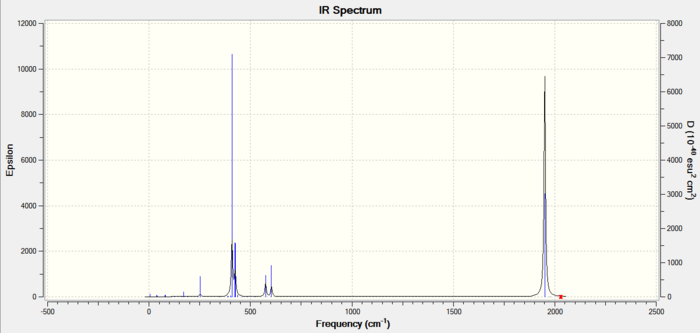
Figure 15: Carbonyl frequencies for TRANS isomer |
 |
|---|
The spectrum of the trans isomer shows only carbonyl peak made up of two overlapping peaks. The two asymmetric stretches can therefore be concluded to be equivalent. The other two carbonyl frequencies are too low in intensity to show on the spectrum, this is due to the high level of symmetry associated with them and so will not incur a great change in the already low dipole moment of the trans isomer.
Mini Project: Hexaaminecobalt(III) and Hexaaquacobalt(II)
Introduction & Aims
Group 9 transition metal Cobalt forms octahedral complexes with ammonia and water to form [Co(NH3)6]3+ and [Co(H2O)6]2+ respectively. Due to the nature of the two different ligands, the characteristics of the two complexes is likely to differ, but differ only slightly enough to allow some interesting comparisons to be made. Using techniques previously employed in this module, and some new ones that are particularly suited to this investigation, the two complexes will be optimised and subsequent frequency and MO analyses will be carried out.

Optimisation
Both molecules were modelled on Gaussview and then optimised using the B3LYP calculation method and a combination of pseudopotential and regular basis sets. Cobalt, being a heavy atom with 27 electrons, had the medium level pseudopotential LanL2DZ used on it and the remaining N/O and H atoms were optimised using the 6-311G(d,p) basis set. It should be noted that similar level basis sets and pseudopotentials should be used in conjunction with eachother. To further increase the accuracy, the convergence was tightened using the "int=ultrafine scf=conver=9" key words.
Figure 2: Summary table for optimisation of [Co(NH3)6]3+
|
Figure 3: Summary table for optimisation of [Co(H2O)6]2+
|
|---|
Noticable straight away from the summary tables is that the hexaaqua complex has not converged properly - the RMS gradient is much greater than 0.01581. Checking the text based log file revealed that neither the force or displacement components had converged. Further repeats were carried out with changes to the charge of the complex and with a maxcycle restriction, but similar results were produced. - DOI:10042/to-10969 DOI:10042/to-10970
Noted for the hexaamine optimisation was that the bond lengths were not entirely equal as would be predicted for the perfect geometry. The largest difference between any two bonds was however only 0.003Å, which is fairly accurate. Similarly the L-Mo-L bond angles were not perfect, despite all the ligands being the same.
Frequency Analysis
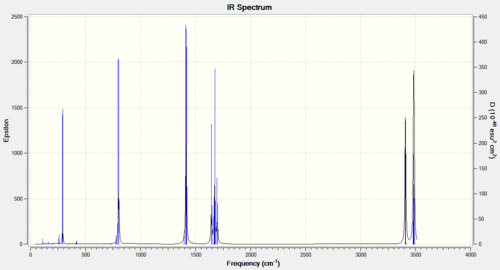
To try and gain any further conclusions regarding the optimisation of the hexaaqua complex, a frequency analysis was carried out. This was found to have 12 negative frequencies with one as low as -756.53cm-1 and as negative frequencies indicate a transition state, the complex hasn't nearly reached an optimised geometry. A frequency analysis was also carried out on the hexaamine complex using the same method, basis sets and convergence criteria.
Figure 4: Table of relevant frequency data for [Co(NH3)6]3+
|
 |
|---|
For the hexaamine complex, only three vibrational modes were calculated below 100cm-1, the lowest frequency being -96.41cm-1. These have been tabulated above in Figure 4. Visible in the animations is that the hydrogens appear to be rotating about the Co-N bonds, the pseudopotential and basis set have not been able to optimise these modes to a global minimum. Also animated and recorded are the metal-nitrogen bond stretches. These are in a fairly low region, concurrent with literature[3].
MO Analysis
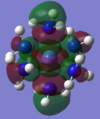
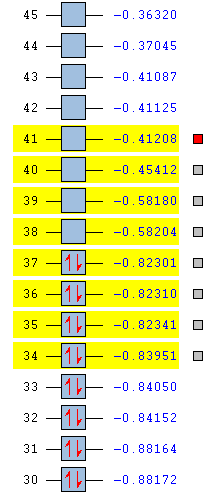
Due to the results of the optimisation and frequency analysis of hexaaqua, only the MOs of hexaamine were computed and visualised. The energy levels of the HOMO-LUMO region have been shown and a smaller section have been visualised to see if this shows anything.
 |
|
From inspection of the HOMO-LUMO region MOs there are a few observable trends. The HOMO-1 and HOMO-2 display bonding interactions between d orbitals of the cobalt and s orbitals of the hydrogens (or possibly N-H bonding orbitals). The LUMO+2 and LUMO+3 display much larger MOs which seem to encapsulate the entire complex. These appear to have antibonding interactions with s orbitals of the amine group. This suggests that these large orbitals result from the more diffuse cobalt atom, perhaps these are higher energy vacant f or d orbitals.
NBO Analysis

 Summary of Natural Population Analysis:

                                       Natural Population
                Natural  -----------------------------------------------
    Atom  No    Charge         Core      Valence    Rydberg      Total
 -----------------------------------------------------------------------
     Co    1    0.49223     17.99836     8.49664    0.01277    26.50777
      N    2   -0.86817      1.99946     5.85693    0.01178     7.86817
      H    3    0.42876      0.00000     0.56958    0.00167     0.57124
      H    4    0.42875      0.00000     0.56958    0.00167     0.57125
      N    5   -0.86690      1.99946     5.85569    0.01176     7.86690
      H    6    0.42825      0.00000     0.57005    0.00169     0.57175
      H    7    0.42825      0.00000     0.57006    0.00169     0.57175
      N    8   -0.86916      1.99946     5.85791    0.01179     7.86916
      H    9    0.42933      0.00000     0.56900    0.00167     0.57067
      H   10    0.42932      0.00000     0.56901    0.00167     0.57068
      N   11   -0.86657      1.99946     5.85533    0.01178     7.86657
      H   12    0.42689      0.00000     0.57132    0.00180     0.57311
      H   13    0.42689      0.00000     0.57131    0.00180     0.57311
      N   14   -0.86869      1.99946     5.85750    0.01173     7.86869
      H   15    0.43031      0.00000     0.56809    0.00161     0.56969
      H   16    0.42779      0.00000     0.57049    0.00172     0.57221
      N   17   -0.86868      1.99946     5.85749    0.01173     7.86868
      H   18    0.42779      0.00000     0.57049    0.00173     0.57221
      H   19    0.43031      0.00000     0.56808    0.00161     0.56969
      H   20    0.42982      0.00000     0.56850    0.00168     0.57018
      H   21    0.42795      0.00000     0.57024    0.00181     0.57205
      H   22    0.42872      0.00000     0.56953    0.00175     0.57128
      H   23    0.43038      0.00000     0.56800    0.00162     0.56962
      H   24    0.42872      0.00000     0.56953    0.00175     0.57128
      H   25    0.42772      0.00000     0.57047    0.00182     0.57228
 =======================================================================
   * Total *    3.00000     29.99511    53.89080    0.11410    84.00000
Using the same file from the MO analysis it is possible to show using colours the relative charges of each atom in the complex. As predicted the cobalt centre is positively charged - this would seem obvious as the complex itself has a total charge of 3. This can be seen as the natural charge total in the data below. The data also give values for the charges and further conclude the cobalt and hydrogen to be positively charged and the nitrogens to be negatively charged. This may help explain why the cobalt orbitals have shown interactions with the hydrogen orbitals.
Conclusion
Attempts at optimisation were successful for the hexaamine but not for the hexaaqua, this allows speculation as to why this may be the case. A likely possibility is that the basis set 6-311G(d,p) is not suitable for oxygen. Oxygen is more electronegative and will be less diffuse than nitrogen. This basis set calculates the effect of diffuse functions[4] and so perhaps they are not well matched. Both complexes are also fairly large and have a high number of electrons, this is more computationally demanding. Perhaps a lower level optimisation should have been carried out beforehand or more specifications added to the input file. Like with the optimisations of the molybdenum complex or the thallium tribromide, it may have been necessary to lock the geometry into octahedral or alter the position of the hydrogens in a particular way. The frequency analysis also showed that rotation of the hydrogens was a vibrational mode that gave negative frequencies, these results are likely to be linked.
Appendix: links to output files
BH3
TlBr3
[Mo(CO)4(PCl3)2]
CIS 1st optimisation DOI:10042/to-10919
TRANS 1st optimisation DOI:10042/to-10918
CIS 2nd optimisation DOI:10042/to-10920
TRANS 2nd optimisation DOI:10042/to-10921
CIS 3rd optimisation DOI:10042/to-10922
TRANS 3rd optimisation DOI:10042/to-10942
CIS frequency (accidentally deleted from SCAN)
TRANS frequency DOI:10042/to-10922
Mini Project
Hexaamine optimisation DOI:10042/to-10713
Hexaaqua optimisation DOI:10042/to-10896
Hexaamine frequency DOI:10042/to-10715
Hexaaqua frequency DOI:10042/to-10898
Hexaamine MOs and NBOs DOI:10042/to-10897
References
- ↑ M. Schuurman et al, The Ab Initio Limit Quartic Force Field of BH3, Wiley, Vol 26, Issue 11, 2005
- ↑ Blixt, J. et al. J. Am. Chem. Soc., 1995, 117 (18), pp 5089–5104
- ↑ Gill N.S., Kingdon H.J. Infrared Spectra of Transition Metal Complexes 1966 19 2197
- ↑ http://www.gaussian.com/g_tech/g_ur/m_basis_sets.htm Date accessed: 06/12/2011


