Rep:Mod:ckw082
Module 2: Christopher Wood
Introduction
In this module, various computational methods are going to be explored to help analyse various inorganic structures. The chosen software is GaussView due to its appropriateness to the problems and the ability to a take a problem further and take a much deeper analysis. Using GaussView, one can create a molecule and design a calculation that would be run by a sister program Gaussian. Once your calculation is complete, you get a combination of various files which can be viewed as a log in many word editing softwares and all the calculated values can be noted. If the results were then open once again in GaussView, and visual representation of your data will be shown.
This is a very powerful tool as this allows for visual representation of a multitude of data. MOs and vibrations can be visualised and spectra can be calculated. This type of computational chemistry can greatly help chemists in the understanding of reactions and properties of various molecules and this in turn can be used to along side practical experiments to compare your actual and predicted products. Comparison of the two could give surprising results.
GaussView Analysis of BH3
In this section the GaussView software was investigated using a simple molecule of BH3. The molecule was made and the bonds adjusted to a length of 1.50 Å. The molecule was then optimised using DFT, with the B3LYP method and 3-21G basis set. These parameters are used due to fast calculation time, but this affects the accuracy of the results. Since BH3 is a simple small molecule, these parameters are sufficient enough to achieve credible results.
In the calculation, the intermediates can be viewed. For those with a relatively large bond distance, GaussView would not display a bond. This is due to the program's settings and defaults for bonds with the corresponding atoms. With this in mind, the program would define bonds to be within a specific distance even though a bond of a longer length can exist. BH3 exists as a trigonal planar molecule, with D3h symmetry. The bond angles between the B-H bonds are 120.0o (1d.p.) with a bond length of 1.19 Å (2d.p.).
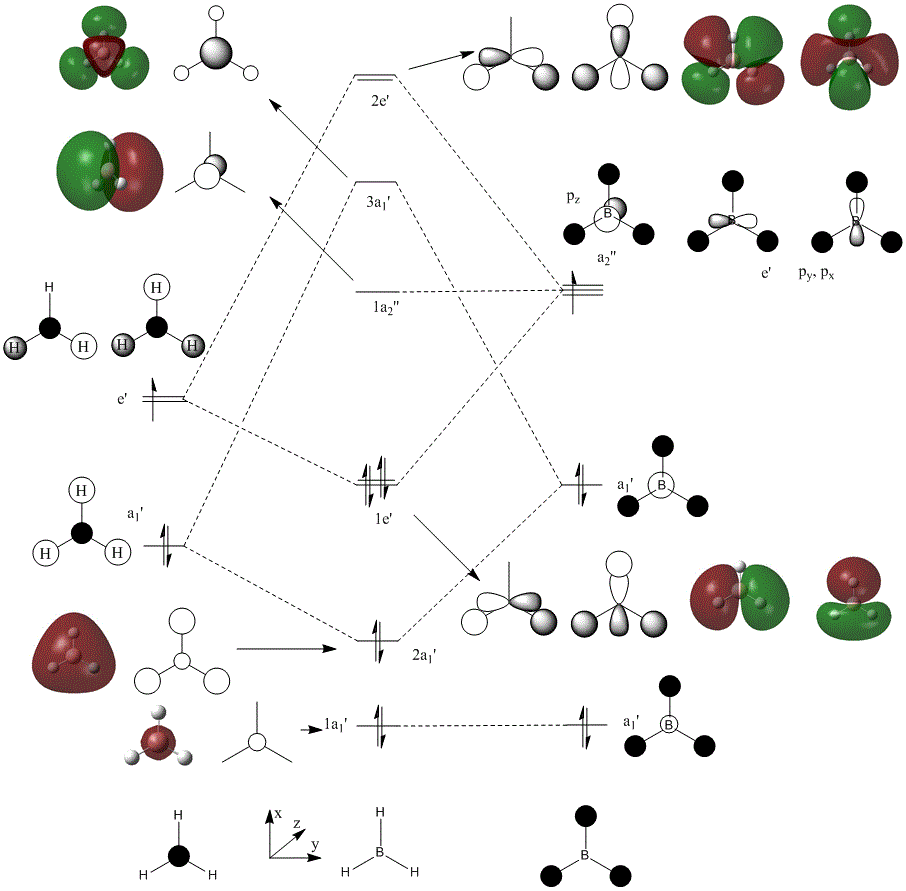
Once the molecule was optimized, the MO's can be calculated from the checkpoint file. In this calculation, pop=full was added to additional keywords and Full NBO was selected. These results can then be compared to LCAO for each of the MO's. Below is a diagram illustrating the LCAO and computed molecular orbitals for the first 8 MO's of BH3. The calculation file is located here: DOI:10042/to-6892


As you can see from the figure above, the shapes of the orbitals in LCAO fit well to the calculated MO's. The main difference between the two would be that overlapping lobes would either form an constructive or destructive interaction. With a constructive overlap, the lobes would combine to form a seamless lobe. For destructive overlaps, a nodal plane would form. This would exert a "pressure" on the lobes, squishing and distorting their shapes, like balloons packed into a confined and competing space. This is shown well by the 3a1' orbital. The inner boron s orbital is spherical, but since it is in an opposite phase to the surrounding hydrogen s orbitals, nodal planes form between them, and this highly distorts the once spherical boron orbital to more of a triangular prism in shape.
The big difference between the two methods however is the ordering of the MO energies. Using computational methods, the 3a1' MO is higher in energy in comparison to the 2e' MOs. This shown by figure 2 and contradicts LCAO theory. LCAO is only an approximation to determine MOs and cannot predict entirely relative energies. This is due to complex electrostatic interactions of the orbitals and their relative orientation and spacing.
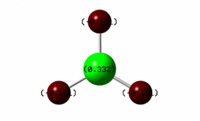
Another useful tool in using GaussView is the NBO analysis. This gives us information on the "atomic charges" of the individual atoms in the molecule. Figure 3 shows the pictorial results given by GaussView.
This leads onto one final very useful computational calculation and that determines the frequencies of various vibrations within the molecule. The software can then animate the vibrations to show visually what happens so that various movements of specific groups can be isolated, for example a distinction between stretching and scissoring motions can be identified. The same method was basis sets were applied, the only thing changed was the job type to frequency and in additional key words pop=(full,nbo). Below is a table that summarises the calculated vibrations.
| No. | Mode of Vibration | Description | Frequency/cm-1 (to the nearest 10 cm-1) | Intensity | Symmetry (D3h Point Group) | |||
| 1 |
|
Synchronised wagging of the hydrogen atoms in the same direction, with slight movement of the boron centre. | 1140 | 93 | a2" | |||
| 2 |
|
Bottom 2 hydrogen atoms scissor in-plane. The bond between the boron and the third hydrogen looks to remain at a fixed length, and the two atoms bob up and down very slightly. | 1200 | 12 | e' | |||
| 3 |
|
Rocking motion in-plane. The bottom 3 hydrogens appear to stay a at fixed distance from the boron and it looks to just rotate, whilst the top hyrogen rocks in the opposite direction in a much larger amplitude. | 1200 | 12 | e' | |||
| 4 |
|
Symmetric stretching of all 3 hydrogen atoms in relation to a fixed hydrogen. | 2600 | 0 | a1' | |||
| 5 |
|
Assymetric stretch where the bottom 2 hydrogens are alternating their streches, whist the boron wags very slightly in relation to the third, fixed, hydrogen. | 2740 | 104 | e' | |||
| 6 |
|
Asymmetric stretch where the bottom 2 hydrogens now in synchronised stretching motions whilst the third is dramatically stretching in response to the other 2. | 2740 | 104 | e' |

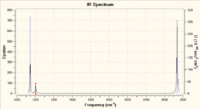
Using this data the IR spectrum can be predicted. Figure 4 shows the predicted spectrum. The biggest point to take from this is the number of observed peaks in comparison to the number calculated. There are 6 calculated vibrations and yet there are only 3 distinct peaks. There are two reasons for this, Firstly, 2 is degenerate with 3 whilst 5 is degenerate with 6. This means that their peaks combine since it is at the same frequency. And lastly, vibration 4 is a completely symmetric stretch. This means that it cannot be observed under IR due to there being no change in overall dipole in the vibration.
Now that the basics have been applied to a relatively simple molecule, the same analysis shall be applied to a much heavier molecule, using appropriate approximations to aid in the calculations.
GaussView Analysis of TlBr3

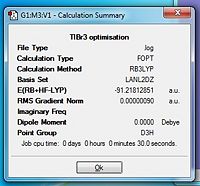
TlBr3 was modelled in GaussView as before, but now the symmetry was restricted to its D3h symmetry group and the tolerance was set to Very tight (0.0001). Again, an optimisation was run using DFT and B3LYP. This time the basis set of choice was LanL2DZ and this would yield far more accurate results than if the same calculation was run using the previous method set. The summary of the results are shown in figure 5. The optimisation data can be found here: https://wiki.ch.ic.ac.uk/wiki/images/f/f1/TLBR3_FREQ.LOG (this was not run on SCAN due to queue issues).
The optimised TlBr3 molecule had equilibrium bond lengths of 2.65 Å (2d.p.) which compares well to the literature of 2.762 Å[1]. The corresponding bond angles between the Tl-Br bonds were all 120.0o (1d.p.). To check that this is indeed the optimised structure, frequency analysis can be undertaken. This can determine whether your structure is indeed optimum by looking in the log file and examining the low frequencies. If the 6 low frequencies are within the range of +-10 cm-1 then the structure has be optimised to a reasonable degree. The closer the values to zero, the more accurate the optimisation.
To run the frequency analysis, the same method and basis set were used, but the job type now changed to frequency (as before with BH3). The same basis set has to be used because the molecule has been preoptimised using the previous set. If you change the basis set, the structure may not be optimised for the new set and this can drastically effect the frequency results. When considering molecular vibrations, a molecule can have 3N-6 vibrational frequencies. The "-6" are due to motions of the core. It is for this reason that they must be minimised in the optimised structure. The first "real" virbration is observed at 46.4289 cm-1. One major point to make is that with computational analysis and especially with the methods and basis sets I have used in this experiment, the frequencies cannot be expressed to this accuracy.
Isomers of Mo(CO)4L2
In this part of the module, the cis and trans isomers of MO(CO)4(PCl3)2 shall be investigated. First of all, both structures have to be optimized before any analysis can be taken. The method used for the calculations wasB3LYP with a pseudo-potential of LANL2MB and opt=loose in "Additional keywords".
This gave a partially optimised structures were then altered by instruction: for the cis conformer ensure that one Cl points up parallel to the axial bond, and that one Cl of the other group points down. Make sure you rotate the whole group and not just a single Cl atom for the trans conformer ensure that both PCl3 groups are eclipsed and that one Cl of each group lies parallel to one Mo-C bond
The optimisation was then run again but with a far more accurate basis set of LANL2DZ and int=ultrafine scf=conver=9 replaced opt=loose in the "Additional keywords". Once the molecules were fully optimised, the IR frequencies can be calculated. To do so, the job was changed to frequency and the additional keywords were kept the same to avoid negative frequencies. My calculations for both can be found here: cis (DOI:10042/to-6968 ), trans (DOI:10042/to-7080 ). Below are the fully optimized structures on which the frequency analysis was run.
When comparing the two structures, there aren't that many differences between the two (despite the obvious cis and trans). But the biggest difference, even though it is small, is the angle of the two trans CO ligands. Due to the two large ligands being cis to each other, this puts strain on the other CO ligands and pushes them away slightly. This changes the angle from 180.0o to 178.3o (1d.p.). This is not observed in the trans complex.
The energies of the cis and trans complex are calculated to be: -1637201.602 kJ/mol and -1637198.869 kJ/mol respectively. This is a difference of 2.733 kJ/mol, in favour of forming the cis complex. This contradicts literature, where the trans is favoured[2]. This would make more sense due to the larger separation of the bulky groups. The strain is observed in the structure of the cis, as mentioned above.
When undertaking vibrational analysis it was observed that there were vibrations of a very low frequency, ranging from frequencies of 4 to 18 cm-1. Below are tables to illustrate these vibrations.
| No. | Mode of Vibration | Description | Frequency/cm-1 | Intensity | |||
| 1 |
|
Twisting motion of the chlorine atoms around the phosphorus centre with a slight wag in the remainder of the complex. | 10.74 | 0.0264 | |||
| 2 |
|
Bottom 2 hydrogen atoms scissor in-plane. The bond between the boron and the third hydrogen looks to remain at a fixed length, and the two atoms bob up and down very slightly. | 17.59 | 0.0073 |
| No. | Mode of Vibration | Description | Frequency/cm-1 | Intensity | |||
| 1 |
|
Twisting motion of the chlorine atoms around the phosphorus centre accompanied with counter twisting of the remaining complex in the opposite direction. | 4.89 | 0.0941 | |||
| 2 |
|
Twisting of chlorine atoms around their corresponding phosphorus atom, but the PCl3 groups are rotating in opposite directions, so overall intensity of 0. | 6.13 | 0.0000 |
Now comparing the CO stretches in the complex, the following data was calculated:
| Calculated frequency (cm-1 | Calculated intensity | Literature frequency cm-1 |
| 1945 | 762 | 1986 |
| 1948 | 1499 | 1994 |
| 1958 | 633 | 2004 |
| 2023 | 597 | 2072 |
| Calculated frequency (cm-1 | Calculated intensity | Literature frequency cm-1 |
| 1950 | 1475 | 1896 |
| 1951 | 1467 | 1896 |
| 1977 | 1 | na |
| 2031 | 4 | na |
There are 2 frequencies for the trans complex that are unobservable via IR due to the symmetric nature of the vibrations, hence the low intensities which if totally symmetric would be zero. This shows how inaccuracy in computational methods can affect results.
Project
For my project I have decided to investigate Al2Br2Cl4. Due to massive queues of up to 16 hours or so, I havent had time to fully analyse everything but all my calculations I shall post as soon as I get them and I shall endevour to finish everything ASAP.
The molecules were preoptimised using DFT, B3LYP and 3-21G. Then optimised with LanL2DZ with int=ultrafine scf=conver=9. Finally frequency analysis adding pop=full.
Al2Cl6 frequency/MO result calculation http://hdl.handle.net/10042/to-7016
Al2Cl4Br2 frequency/MO result calculation (Br2 bridging)
http://hdl.handle.net/10042/to-7048
Al2Cl4Br2 frequency/MO result calculation (Br's diagonal)
http://hdl.handle.net/10042/to-7046
Al2Cl4Br2 frequency/MO result calculation (one side) http://hdl.handle.net/10042/to-7050
Al2Cl4Br2 frequency/MO result calculation (cis) http://hdl.handle.net/10042/to-7051
Al2Cl4Br2 frequency/MO result calculation (in and up)
http://hdl.handle.net/10042/to-7063
Al2Cl4Br2 frequency/MO result calculation (in and down)
http://hdl.handle.net/10042/to-7062
References
- ↑ A. Linden et al., Inorganica Chimica Acta, 2002, 332, 61-71.
- ↑ D. Darensbourg, Inorg. Chem., 1979, 18, 14-17. DOI:10.1021/ic50191a003
