Rep:Mod:ckl211inorg
Week 1: Year 3 Inorganic Computational Laboratory
Optimisation of trigal planar structures
Optimisation of BH3
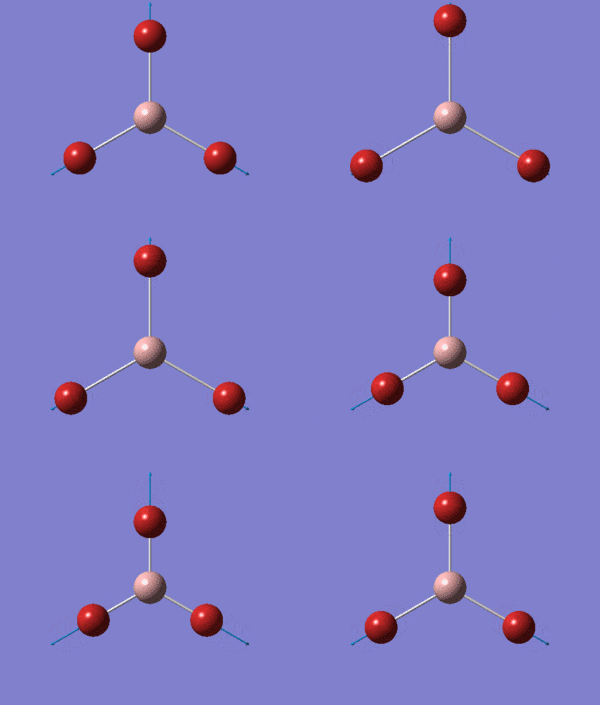
A BH3 molecule was created and drawn on Gaussian. Its 3 B-H bond lengths were specified to be 1.53, 1.54 and 1.55Å respectively in order to distort its geometry from a D3h symmetry. Calculations were then performed on the molecule using a B3LYP method and a low-accuracy basis set (3-21G), to optimise the molecule and determine its lowest energy conformation. The results of the optimisation is as stated below.
Optimisation using 3-21G basis set :

|
Optimised B-H bond length (all bond lengths equal) |

|
Optimised B-H bond angle (all bond angles equal) |
| Summary of results of the optimisation | |
|---|---|
| File Type | .log |
| Calculation Type | FOPT |
| Calculation Method | RB3LYP |
| Basis set | 3-21G |
| Final energy (a.u.) | -26.46226429 |
| Gradient (a.u.) | 0.00008851 |
| Dipole moment (Debye) | 0.00 |
| Point group | Cs |
| Length of calculation | 18.0 seconds |
         Item               Value     Threshold  Converged?
 Maximum Force            0.000220     0.000450     YES
 RMS     Force            0.000106     0.000300     YES
 Maximum Displacement     0.000709     0.001800     YES
 RMS     Displacement     0.000447     0.001200     YES
 Predicted change in Energy=-1.672479D-07
 Optimization completed.
    -- Stationary point found.
Analysis of the total energy and the gradient of the optimisation, it is observed that the BH3 molecule undergoes 7 different optimisation states before reaching its lowest energy state. We can see that by changing the bond lengths of the molecule, we have changed the symmetry of the BH3 molecule from D3hto Cs, although the change in bond lengths and bond angles remain largely minimal.
Further optimisation can be performed on the optimised molecule above and below, the results of using a better basis set, namely 6-31G (d,p) is recorded.
Further optimisation sing a 6-31G (d,p) basis set :

|
Optimised B-H bond length (all bond lengths equal) |

|
Optimised B-H bond angle (all bond angles equal) |
| Summary of results of the optimisation | |
|---|---|
| File Type | .log |
| Calculation Type | FOPT |
| Calculation Method | RB3LYP |
| Basis set | 6-31G(d,p) |
| Final energy (a.u.) | -26.61532360 |
| Gradient (a.u.) | 0.00000707 |
| Dipole moment (Debye) | 0.00 |
| Point group | Cs |
| Length of calculation | 6.0 seconds |
File:CKL211 BH3 OPT2TRIAL2.LOG
         Item               Value     Threshold  Converged?
 Maximum Force            0.000012     0.000450     YES
 RMS     Force            0.000008     0.000300     YES
 Maximum Displacement     0.000061     0.001800     YES
 RMS     Displacement     0.000038     0.001200     YES
 Predicted change in Energy=-1.069288D-09
 Optimization completed.
    -- Stationary point found.
In contrast to optimisation using the 3-21G basis set, it is observed that final molecule after the second optimisation using the 6-31G (d,p) basis set, the molecule directly optimises to its lowest energy state. There is also no change in the molecule's bond length, and only a very minimal increase in one of its bond angles. This suggests that the 3-21G basis set is accurate enough to predict the optimised geometry and properties of the small BH3 molecule. The lowest energy of the two results of optimisation cannot be compared with one another by virtue of our usage of different basis sets for the optimisation process.
Optimisation of GaBr3
We will attempt the optimisation process again, but using a bigger molecule, i.e. gallium which, like boron, is located in group 13 but is in row 3 instead of row 1. The location of gallium in Period 3 indicates that it has a large number of electrons, 31, and coupled with the 3 x 35 electrons of the 3 bromine atoms, this makes up a large number of electrons to be calculated by the quantum mechanics. This cannot be calculated with the quantum mechanics of our program (Gaussian) as before with BH3. This problem is overcome by considering only the valence electrons of each of the atoms and modelling them using a unique function called the pseudo-potential, which makes the calculations much easier. Hence, for this molecule for GaBr3, we will need to apply this pseudo-potential function.
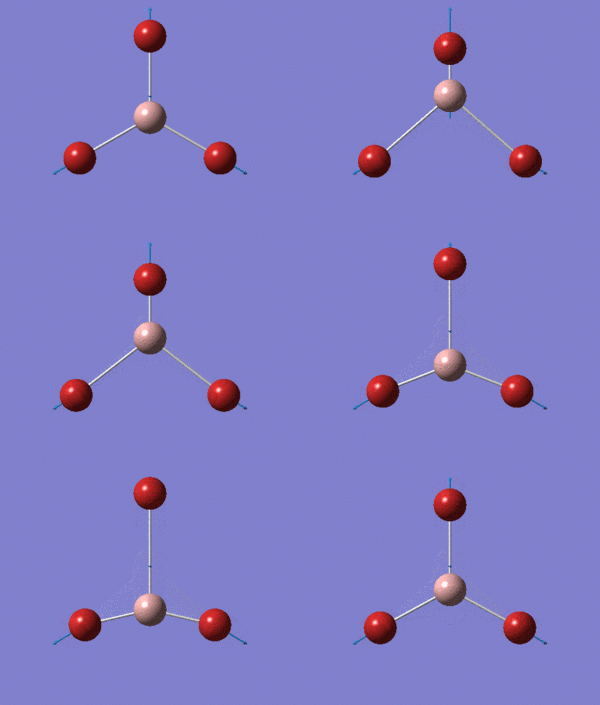
GaBr3 was modelled using the Gaussian computer program and its symmetry constrained to the D3h point group, with a very tight tolerance of 0.0001. We used all the same methods of optimisation as before, but with a different basis set now, LanL2DZ, a medium basis set corresponding to the pseudo-potentials of heavier elements.

|
Optimised Ga-Br bond length (all bond lengths equal) |

|
Optimised Ga-Br bond angle (all bond angles equal) |
The simulated optimised bond lengths and and angles of the constrained D3h GaBr3 molecule above was compared to the literature[1] whereby the Ga-Br bond length is 2.249Å (cf: optimised bond length 2.3501Å). There is no reported bond angle in the CRC handbook for GaBr3 but there is a bond angle reported for its correponding dimer to be 123° (cf: optimised <BrGaBr = 120°). The optimised bond lengths and angles seems to show a reasonable correlation with the literature and variances may to due to the differences in obtaining the data as that in the literature was obtained from gas phase electron diffraction and that the bond angle cited in the literature is for a 4-coordinate gallium in its dimer state, rather than a 3-coordinate gallium.
| Summary of results of the optimisation | |
|---|---|
| File Type | .log |
| Calculation Type | FOPT |
| Calculation Method | RB3LYP |
| Basis set | LanL2DZ |
| Final energy (a.u.) | -41.70082783 |
| Gradient (a.u.) | 0.00000016 |
| Dipole moment (Debye) | 0.00 |
| Point group | D3h |
| Length of calculation | 12.0 seconds |
File:CKL211 GaBr3 OPTIMISATION.LOG
      Item               Value     Threshold  Converged?
 Maximum Force            0.000000     0.000450     YES
 RMS     Force            0.000000     0.000300     YES
 Maximum Displacement     0.000003     0.001800     YES
 RMS     Displacement     0.000002     0.001200     YES
 Predicted change in Energy=-1.282689D-12
 Optimization completed.
    -- Stationary point found.
Optimisation of BBr3
BBr3 is a molecule containing one light atom (boron) and three heavy atoms (bromine). This means that to optimise this molecule, we would need to use a mixture of the two methods above, namely a pseudo-potential for the heavy atoms and a full basis set for the light atom.
The molecule of BBr3 was created using modifying the hydrogen atoms of the optimised file of BH3 earlier. The basis set was set to Gen and the pseudo-potentials specified for each atom.

|
Optimised B-Br bond length |

|
Optimised B-Br bond angle |
Comparing the optimised bond length to that reported in the CRC handbook, 1.893Å, which is a fairly close correlation to the optimised bond lengths of approximately 1.93Å. Differences in the values might be due to the way in which data is obtained (by quantum mechanical calculations and assumptions specified in Gaussian for the optimised bond lengths and by gas phase electron diffraction for the CRC handbook).
| Summary of results of the optimisation | |
|---|---|
| File Type | .log |
| Calculation Type | FOPT |
| Calculation Method | RB3LYP |
| Basis set | Gen |
| Final energy (a.u.) | -64.43644667 |
| Gradient (a.u.) | 0.00000934 |
| Dipole moment (Debye) | 0.00 |
| Point group | Cs |
| Length of calculation | 10.0 seconds |
File:CKL211 BBr3 OPTIMISATION 1.LOG
         Item               Value     Threshold  Converged?
 Maximum Force            0.000023     0.000450     YES
 RMS     Force            0.000011     0.000300     YES
 Maximum Displacement     0.000145     0.001800     YES
 RMS     Displacement     0.000082     0.001200     YES
 Predicted change in Energy=-2.320689D-09
 Optimization completed.
    -- Stationary point found.
Comparing the results of BH3, GaBr3 and BBr3
| Molecule | BH3 | BBr3 | GaBr3 |
| Bond lengths (Å) | 1.20 | 1.93 | 2.35 |
From the above table, we can make two major observations :
(i) the bond lengths increase as you change the ligand from BH3 to BBr3
(ii) the bond lengths increase as you change the central atom from B to Ga
(i) can be explained by studying the sterics and electronic structure of the molecules. Obviously bromine is a much bigger atom than hydrogen and hence, are less able to pack as well as the hydrogen molecules. The B-Br bond therefore has to be longer to accommodate the bigger bromine atoms around the central boron atom. The bigger the ligand, the longer the bond would be. This also can be understood by studying the inherent electronic structures of the hydrogen and bromine atoms. The hydrogen atom comprises of one electron only whereas the bromine atom has 35 valence electrons in total. This means that the bromine atoms will experience a greater repulsion due to the larger number of electrons they have and hence the minimum distance at which they can approach each other without significant repulsion (i.e. their van der Waals' distance) is expected to be larger than for a H-H bond. Indeed, this is observed in their diatomic bond lengths, with H2 having a shorter bond length of 74pm and Br2 having a longer bond length of 228pm. This would explain why the Br atom forms a longer bond with other molecules compared to H in order to optimise the space around the central atom that would allow it to adopt positions that would minimise the steric and electronic repulsion between other molecules and each other.
Bromine is also a highly electronegative atom and hydrogen is a highly electropositive atom. This would result in very different bond polarities formed between boron. The B-H bond would be largely covalent and the B-Br bond more ionic, due to the electronegative property of bromine that causes the electrons in the bond to become more polarised towards the bromine atom. Therefore, these two ligands form different types of bonds with boron.
H and Br are similar in that both of them donates one electron each to form a covalent bond with the central atom. However, hydrogen only has 1 valence electron so would only achieve stability of its 1s valence orbital whereas the bromine, having 7 valence electrons, forms a covalent bond with the central atom in order to complete its octet and fill up its 2p valence orbital. The hydrogen atom is closer to the nuclear core and therefore its valence electron is more tightly held by the nucleus than bromine, whose valence electrons are shielded from the nuclear charge by the inner electrons of the 1s and 2s electrons. This implies that hydrogen would form stronger bonds to the boron center than bromine. This is reflected in experimental data, where the B-H bond strength is 389 kJ/mol, higher than the corresponding B-Br bond strength of 377 kJ/mol.
Increasing the size of the central atom would yield similar results to increasing the size of the ligand. Boron and gallium are located in the same group in the Periodic Table and so have the same number of valence electrons. However, galium is located at Period 3 unlike boron (Period 1). This means that galium is a heavier atom and contains more protons and electrons than boron. Both elements are able to form 3 covalent bonds with other molecules with their 3 valence electrons to form an compound which is electron-deficient, containing only 6 valence electrons. This means that these compounds will be likely to act as Lewis acids or dimerise, forming multicentre bonds to alleviate their electron deficiency, with boron being a better Lewis acid by virtue of its electrons being more tightly held in its 1p valence orbital (relative to galium having its valence electrons in a 3p orbital), enabling it to form stronger bonds with a Lewis base.
Upon increasing the size of the central atom from boron to gallium, an increase in bond length if observed. The bigger the central atom, the substituents will be located at larger angles to each other upon packing around the central atom. Atoms with a larger radii also tend to have a larger number of electrons located in their structures, leading to greater repulsions and increased van der Waals' distance with other molecules due to this greater repulsion. This increases the bond length of the R-Br molecule (R being a Group 13 element) in order to attain the optimum bond length that renders the two groups to have an attractive, rather than repulsive interaction.
Galium and bromine are located in the same Period 3 of the Periodic Table and have a more similar size, as with boron and hydrogen. This means that Ga-Br and B-H would have a better orbital overlap due to them having similar sized orbitals, and hence increasing bond strength and hence, leads to increased bond lengths. B-Br has very different orbital sizes and hence experience less efficient orbital overlap, resulting in a weaker bond and corresponding increased bond length.
Chemical bonds and GaussView
A chemical bond is the interaction between two molecules at an optimum distance at which the two molecules are attractive. The force that governs a bond is electrostatic and can occur between oppositely charged ions, electrons and nuclei or oppositely-charged dipoles. There are many different types of bonds, of varying strengths, ranging from ionic and covalent bonds to van der Waals' interaction and hydrogen bonding. This means that the bonds formed between molecules are not actual lines that can be observed as lines when analysis of the molecule by e.g. X-ray crystallography. These lines we draw as the bonds between molecules are drawn merely for ease of visualing the geometry of the molecule. A bond is merely the interaction between molecules and these interactions cannot be observed by the naked eye!
When we use GaussView to draw chemical molecules, we need to understand that GaussView draws these molecules and their bonds based on a distance criteria and so sometimes after optimisation of the molecule, these bonds disappear. This does not mean that the bonds are not present. It merely means that the bond lengths have exceeded a certain pre-defined internal criteria. (Although in reality, bonds are not observed as clearly defined lines between molecules).
Frequency analysis of trigonal planar structures
Frequency analysis of BH3
Vibrational analysis is a technique that calculates the second derivative of a potential energy surface (PES). If the result is negative, there is a maximum in the PES and there is a transition state. If the result if positive, there is a minimum is the PES and the ground state of the molecule is present. Vibrational or frequency analysis was performed on the optimised BH3 structure from earlier using the 6-31G (d,p) basis set in order to confirm the presence of the minimum ground state structure of BH3. The summary energies of the optimisation and the frequency analysis was compared to ensure the structure has not changed during the frequency energies. The energies were exactly the same in this case, namely -26.61532360 a.u..
| Summary of results of the frequency analysis | |
|---|---|
| File Type | .log |
| Calculation Type | FOPT |
| Calculation Method | RB3LYP |
| Basis set | 6-31G(d,p) |
| Final energy (a.u.) | -26.61532360 |
| Gradient (a.u.) | 0.00000703 |
| Dipole moment (Debye) | 0.00 |
| Point group | Cs |
| Length of calculation | 7.0 seconds |
          Item               Value     Threshold  Converged?
 Maximum Force            0.000014     0.000450     YES
 RMS     Force            0.000007     0.000300     YES
 Maximum Displacement     0.000088     0.001800     YES
 RMS     Displacement     0.000045     0.001200     YES
 Predicted change in Energy=-1.482703D-09
 Optimization completed.
    -- Stationary point found.
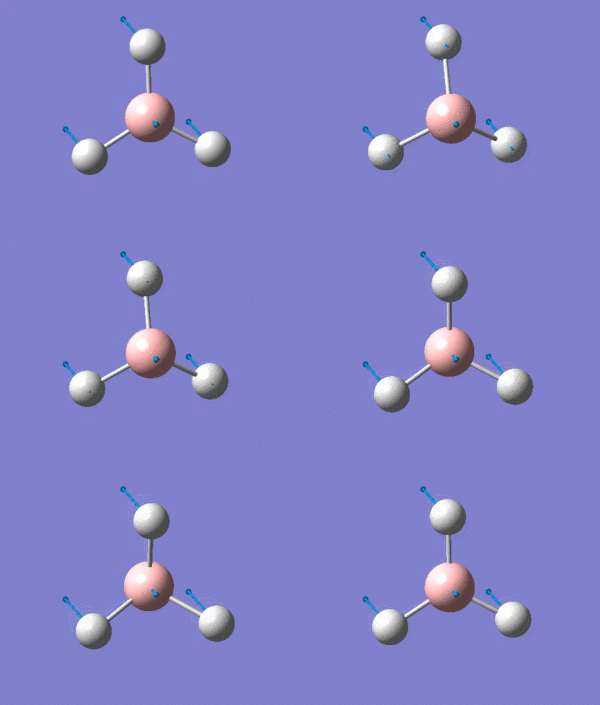
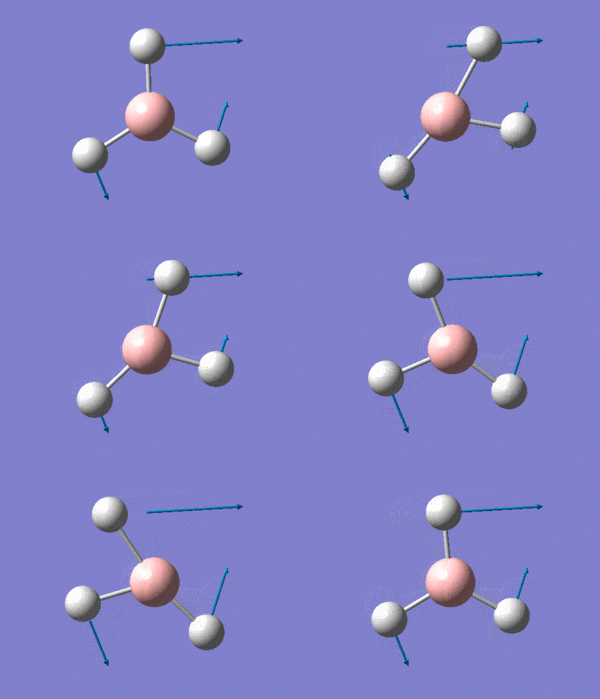
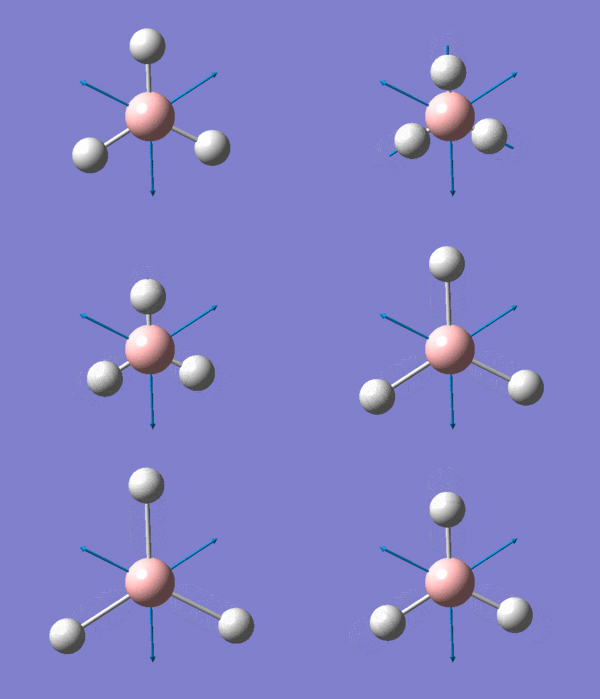
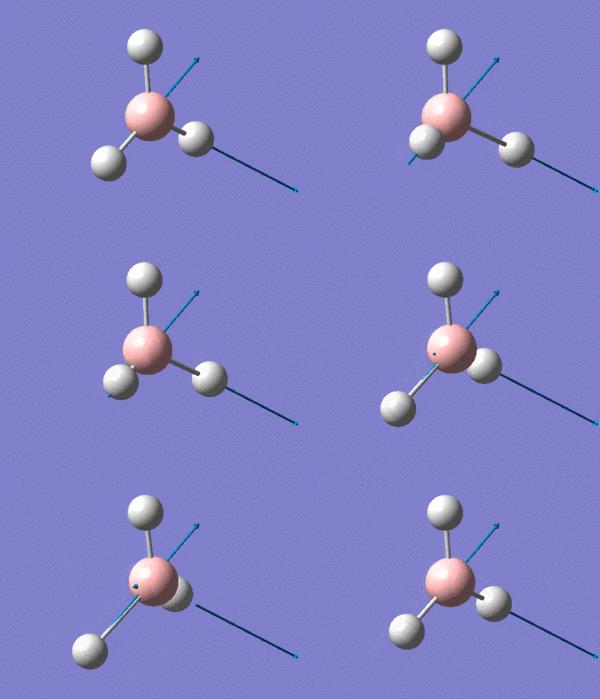
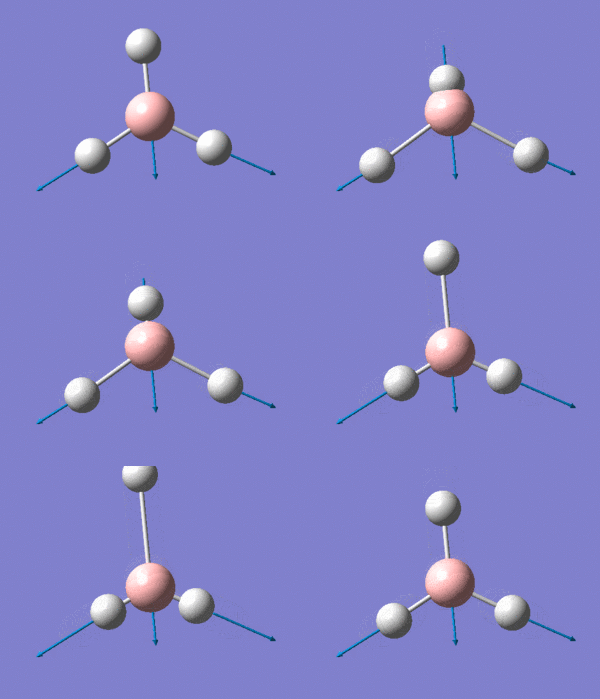
For a non-linear molecule like BH3, they have 3N-6 vibrational modes, where N is the number of atoms in the molecule. We would therefore expect BH3 to have 6 vibrational modes. This is reflected in the six frequency values on the first row of the table below.
 Low frequencies ---  -24.9563  -13.1428   -0.0009   -0.0009   -0.0005   15.1819
 Low frequencies --- 1162.9975 1213.0240 1213.1458
The expected frequency values should lie between +/- 15cm-1. However, the values above are from -24 to 15cm-1, which is higher than expected.
Another attempt at frequency analysis was made, but this time with tight constrainment of the symmetry of the molecule to D3h. There was a ever so slight change in the energy, but only by the last decimal place so we can assume that as negligible.
| Summary of results of the frequency analysis | |
|---|---|
| File Type | .log |
| Calculation Type | FOPT |
| Calculation Method | RB3LYP |
| Basis set | 6-31G(d,p) |
| Final energy (a.u.) | -26.61532363 |
| Gradient (a.u.) | 0.00000294 |
| Dipole moment (Debye) | 0.00 |
| Point group | D3h |
| Length of calculation | 5.0 seconds |
         Item               Value     Threshold  Converged?
 Maximum Force            0.000006     0.000450     YES
 RMS     Force            0.000003     0.000300     YES
 Maximum Displacement     0.000023     0.001800     YES
 RMS     Displacement     0.000012     0.001200     YES
 Predicted change in Energy=-2.033740D-10
 Optimization completed.
    -- Stationary point found.
Low frequencies ---   -0.9453   -0.8692   -0.0055    5.6918   11.6978   11.7360
 Low frequencies --- 1162.9961 1213.1825 1213.1852
The frequencies now have been attained to be between +/- 15cm-1. Each vibrational mode was then studied in further detail below, and their relationship with the simulated IR spectrum established.
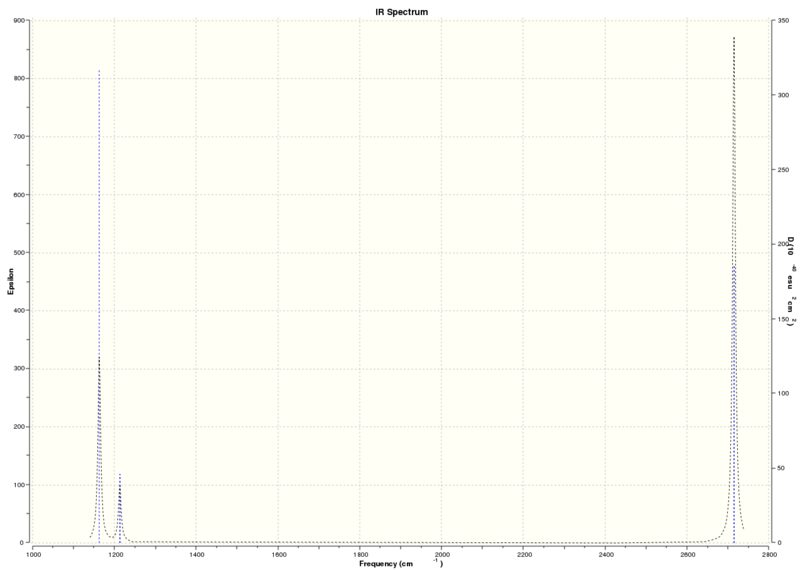
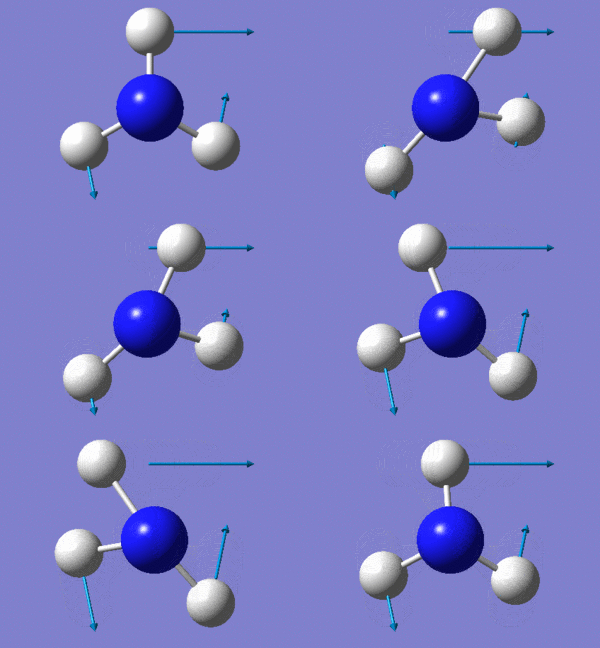
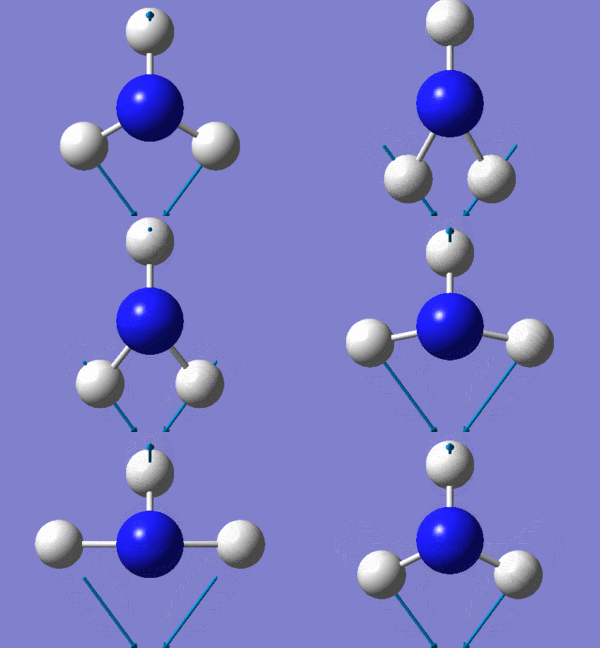
Because there are 6 vibrational modes of BH3, we would expect 6 peaks in its IR spectrum for each of the vibrational mode present. However, some of these peaks are degenerate and hence, only appear as one peak e.g. the peaks at 1213.18, 1213.19, 2715.45, 2715.45cm-1 appear as 2 peaks instead of 4 due to degeneracy. This degenerate peaks have almost the same intensity (the difference in intensities can be assumed as negligible) and hence appear as one peak. There is one totally symmetric vibrational mode (#4 in the table above), which results in that vibrational mode having no net dipole moment and therefore cannot absorb infrared radiation. This means that this peak will not IR active and hence will not appear in the resulting infrared spectrum. This is reflected in it having an intensity of 0, as seen above.
Both reasons above lead to less than expected numbers of peaks in the IR spectrum. In this case, only 3 peaks are observed, instead of the expected 6 peaks.
Frequency analysis of GaBr3
We will now carry out vibrational analysis on a heavier molecule, GaBr3, which was optimised using pseudo-potentials to check if the analysis will yield a positive result, proving that GaBr3 is present in its minimum energy ground state. Again, the symmetry group is restricted to D3h. The energy of the frequency analysis was checked with that of the optimisation and were found to be exactly the same value of -41.70082783a.u., confirming that the structure of the molecule is the same.
| Summary of results of the frequency analysis | |
|---|---|
| File Type | .log |
| Calculation Type | FOPT |
| Calculation Method | RB3LYP |
| Basis set | LanL2DZ |
| Final energy (a.u.) | -41.70082783 |
| Gradient (a.u.) | 0.00000011 |
| Dipole moment (Debye) | 0.00 |
| Point group | D3h |
| Length of calculation | 6.0 seconds |
         Item               Value     Threshold  Converged?
 Maximum Force            0.000000     0.000450     YES
 RMS     Force            0.000000     0.000300     YES
 Maximum Displacement     0.000002     0.001800     YES
 RMS     Displacement     0.000001     0.001200     YES
 Predicted change in Energy=-6.142796D-13
 Optimization completed.
    -- Stationary point found.
Low frequencies ---   -0.5252   -0.5247   -0.0024   -0.0010    0.0235    1.2011
Low frequencies ---   76.3744   76.3753   99.6982
Although the Gaussian program records the low frequencies to a minimum of -0.5252 above, the lowest "real" mode that is observed in our simulated IR spectrum for GaBr3 is 76.3744cm-1 (the first value located in the second row of the low frequencies table). However, it is worth noting that most IR machines are usually set to measure frequencies to a minimum of 500cm-1 so all the peaks for GaBr3 will not be seen when recording IR spectra in laboratories. The 400-10cm-1 region lies next to the microwave region and it might be more useful to use Raman spectroscopy to characterise GaBr3.
Like BH3, we would expect 6 vibrational modes for GaBr3, as it is a non-linear molecule having the same number of atoms.
Simulated IR spectrum of GaBr3
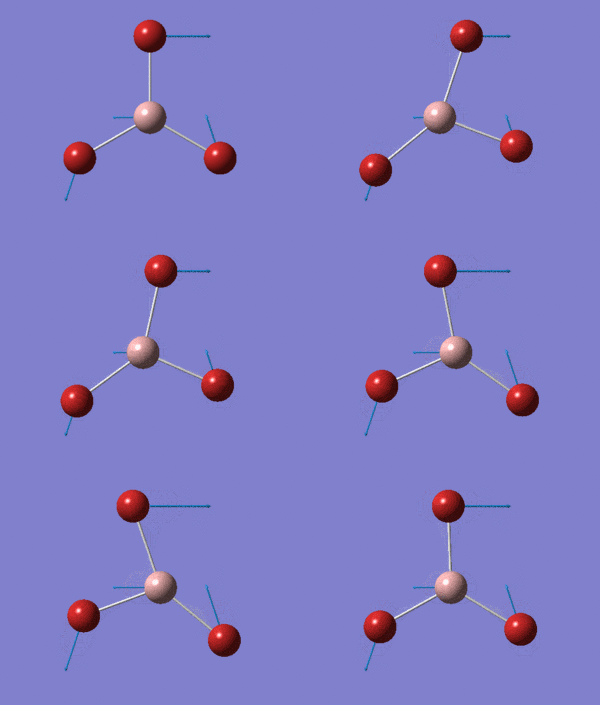
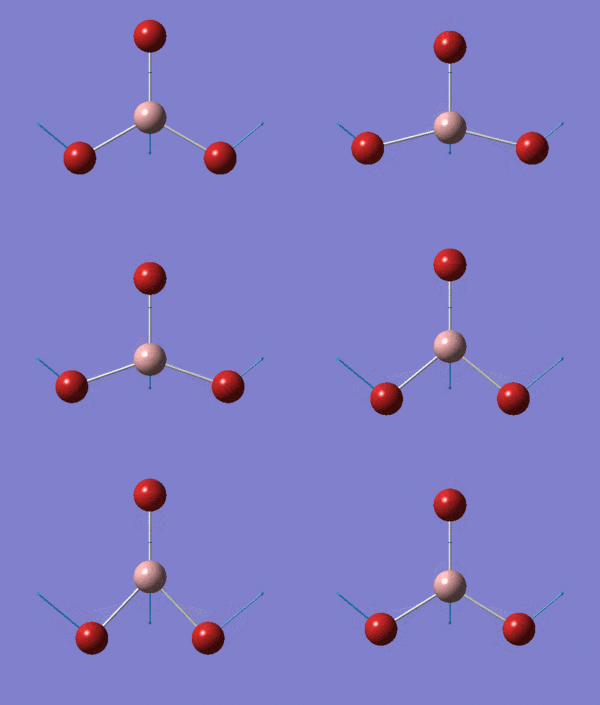
As before, we expect 6 peaks due to the 6 vibrational modes but the frequencies at 76.37, 76.38 and 316.18, 316.19cm-1 form two pairs of degenerate peaks and the peak at 197.34cm-1 does not absorb IR radiation and hence does not show up in the spectrum.
Comparing the vibrational analysis of BH3 and GaBr3
| Vibrational mode no. | Frequencies of BH3/cm-1 | Frequencies of GaBr3/cm-1 |
| 1 | 1163 | 76 |
| 2 | 1213 | 76 |
| 3 | 1213 | 99 |
| 4 | 2582 | 197 |
| 5 | 2715 | 316 |
| 6 | 2715 | 316 |
Comparison of the IR frequencies of BH3 and GaBr3, it is obvious that the GaBr3 molecule absorbs IR radiation at a much lower frequency than BH3 (more than 1000cm-1 difference!).This has to do with the basic theory of IR spectroscopy and Hooke's Law. IR radiation is absorbed by a molecule when the frequency of the IR radiation is the same as the frequency of the vibrating bond. Hooke's Law can help to explain why the frequency of the molecule in the IR spectrum is high or low by assuming the harmonic oscillator approximation.
Hooke's Law states that :
- the vibrational frequency is directly proportional to the strength of the bond
- the vibrational freqeuncy is inversely proportional to the mass of the atoms in the vibrating bond.
Heavier atoms therefore absorb at much lower frequencies than lighter atoms. In terms of molecular mass, GaBr3 is much heavier than BH3, having a mass of 309.435g/mol compared to BH3's mass of 13.836g/mol. This means that it is more than 20 times heavier than BH3. Each Ga-Br molecule weighs 149.627g/mol and each B-H molecule weighs only 11.811g/mol. This great difference in weight would mean that the Ga-Br bonds in GaBr3 would absorb IR radiation at a much, much lower frequency compared to the B-H bonds in BH3 according to Hooke's Law.
In terms of bond strength, molecules with larger bond strengths are expected to absorb at higher frequencies relative to molecules with weaker bonds. Both Ga-Br and B-H form single bonds and their bond energies are approximately 444 and 340kJ/mol respectively. The difference between their bond strengths are therefore not as significant as the difference between their masses. The stronger bond energy of the Ga-Br bond would mean that it is a stronger bond than the B-H bond and would therefore would have a higher frequency in the resulting IR spectrum. This contradicts what is observed simulated IR spectra.
The two factors affecting the vibrational frequency of molecules provide contradicting expectations of the frequencies of the molecules. We can assume that the mass factor plays a greater role in determining the frequency of the molecule in this case because the resulting IR frequencies of GaBr3 is much lower than that of BH3. As frequency and energy is directly proportional to one another from the Einstein's famous equation E=hν, where E is energy, h is Planck's constant and ν is the (vibrational) frequency in this case, this would also explain the vastly different frequencies and energies of the B-H and Ga-Br vibrational modes.
| Vibrational mode no. | Symmetry labels of each BH3 vibrational mode | Symmetry labels of GaBr3 vibrational mode |
| 1 | A2" | E' |
| 2 | E' | E' |
| 3 | E' | A2" |
| 4 | A1' | A1' |
| 5 | E' | E' |
| 6 | E' | E' |
The table above is written in increasing energy as the vibrational mode number increases. At first glance, it would seem as though only the A2" and one of the low energy E' modes has been reordered in GaBr3 relative to BH3. However, closer analysis of the motions of the vibrational modes would show that the "degenerate" modes (they have a very small difference in energy!) have also changed their energies. If before, mode A is higher in energy than its corresponding degenerate partner, in GaBr3 it is lower in energy. However, these peaks are meant to be degenerate so these very small shift in their energy levels may be negligible but is interesting to note.
In general, both BH3 and GaBr3 show the trend that their stretching modes are of higher energy than their bending modes. This is the cause for the large jump in frequency (and hence energy) because much more energy is required to stretch a molecule than it is to bend it. This jump in frequency values occurs from the 3rd to the 4th vibrational mode in both cases. However, the bending modes are close in energy, as with the case for the stretching modes.
The two simulated IR spectra of BH3 and GaBr3 show exactly the same shape and pattern except that for BH3, the two peaks to the left of the spectrum is more prominent. We can see that there are peaks which are very close together (these represent either the bending or stretching modes, depending on the molecule) and that there is a big difference between the peaks for the stretching modes and the bending modes. This reiterates the point earlier, where there would always be a big difference between the energies of the stretching and bending modes.
Why must you use the same method and basis set for the optimisation and frequency analysis calculations?
In order to compare the results of the optimisation and frequency analysis calculations, we used the exact same basis set and method for the molecules being compared. This is to ensure that any differences in any of the calculated values is due to differences in the molecules itself and that the difference in results is not due to different computational calculations, which would make the results invalid for comparison with one another.
What is the purpose of carrying out a frequency analysis?
A frequency or vibrational analysis is a second derivative of a potential energy surface (PES) which tells us if the molecule is at ground state or a transition state. If the frequency analysis yields all positive frequencies, there is a minimum in the PES and the molecule at the ground state. Similar, if one of the frequencies are negative, there is a maximum in the PES and the molecule is at a transition state. If there are more than one negative frequencies, this means that the program has failed to find a critical point and the optimisation has not run to completion or failed. So, the frequency analysis is important to help us identify and confirm that the structure is at a minimum point. The frequency analysis also predicts an IR and Raman spectra of a molecule that we can use to compare with our experimental data.
What do the "low frequencies" represent?
When doing a frequency analysis, the log file of this analysis has two rows for the low frequencies. The first row represents the small motions in the centre of mass of the molecule while the low frequencies in the second row represents the frequencies corresponding to each vibrational mode of the molecule. The total number of frequencies there are in the second row corresponds to the total number of vibrational modes of the molecule.
Computing the MOs of BH3
The MOs of the optimised BH3 molecule was simulated using GaussView and the shapes of these MOs compared to our predicted MOs using MO theory in the MO diagram above.
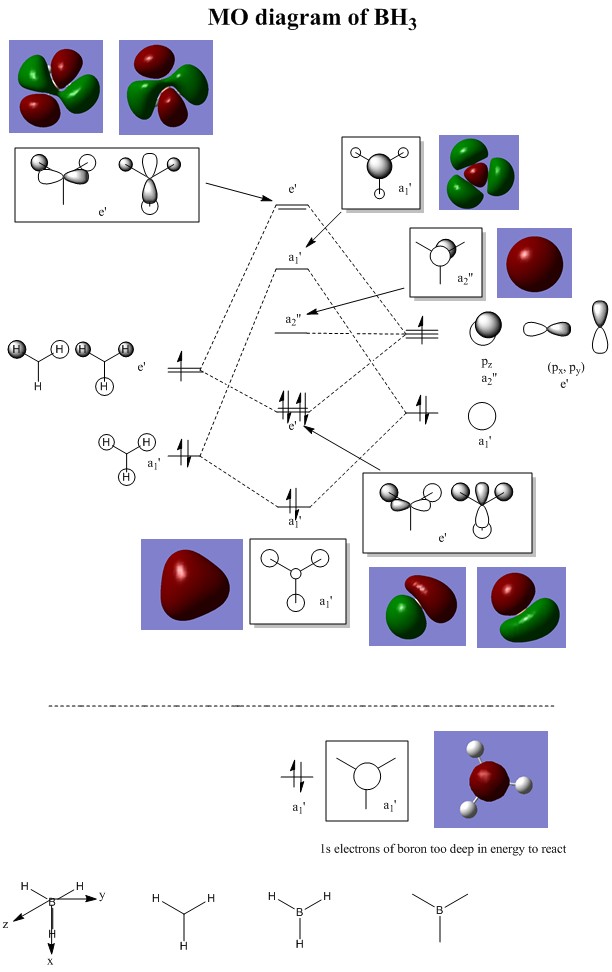
We can see that although some of these simulated MOs show slight differences in their structures compared to the predicted MOs, they mostly show a fairly similar picture of electron density like what we have predicted using MO theory. This means that prediction of MO shapes using MO theory is fairly accurate, with minor differences in the actual structures of the MOs. Therefore, qualitative MO theory is quite a good approximation of predicting MOs and useful as a starting point for predicting the structures of MOs using the LCAO theory.
NBO analysis of NH3
Optimisation of NH3
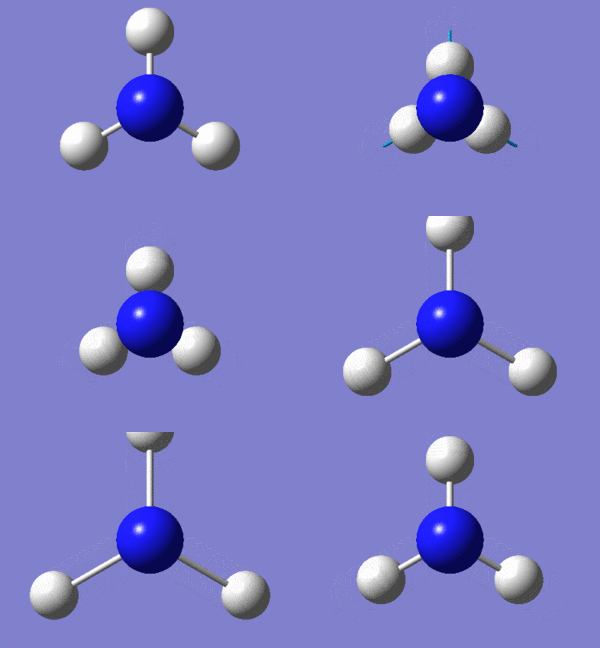
A molecule of NH3 was drawn and optimised using a 6-31G(d,p) basis set as before with BH3. The results of the optimisation were as stated below.

|
Optimised N-H bond length (all bond lengths equal) |

|
Optimised N-H bond angle (all bond angles equal) |
| Summary of results of the optimisation | |
|---|---|
| File Type | .log |
| Calculation Type | FOPT |
| Calculation Method | RB3LYP |
| Basis set | 6-31G(d,p) |
| Final energy (a.u.) | -56.55776863 |
| Gradient (a.u.) | 0.00000289 |
| Dipole moment (Debye) | 1.85 |
| Point group | C3v |
| Length of calculation | 14.0 seconds |
         Item               Value     Threshold  Converged?
 Maximum Force            0.000005     0.000450     YES
 RMS     Force            0.000003     0.000300     YES
 Maximum Displacement     0.000010     0.001800     YES
 RMS     Displacement     0.000007     0.001200     YES
 Predicted change in Energy=-7.830780D-11
 Optimization completed.
    -- Stationary point found.
Frequency analysis of NH3
| Summary of results of the frequency analysis | |
|---|---|
| File Type | .log |
| Calculation Type | FOPT |
| Calculation Method | RB3LYP |
| Basis set | 6-31G(d,p) |
| Final energy (a.u.) | -56.55776873 |
| Gradient (a.u.) | 0.00000323 |
| Dipole moment (Debye) | 1.85 |
| Point group | C3v |
| Length of calculation | 6.0 seconds |
         Item               Value     Threshold  Converged?
 Maximum Force            0.000006     0.000015     YES
 RMS     Force            0.000004     0.000010     YES
 Maximum Displacement     0.000014     0.000060     YES
 RMS     Displacement     0.000009     0.000040     YES
 Predicted change in Energy=-1.141607D-10
 Optimization completed.
     -- Stationary point found.
Low frequencies ---   -0.0130   -0.0028   -0.0003    7.1032    8.1046    8.1049
Low frequencies --- 1089.3834 1693.9368 1693.9368
6 vibrational modes are expected for the non-linear NH3 molecule with 4 atoms.
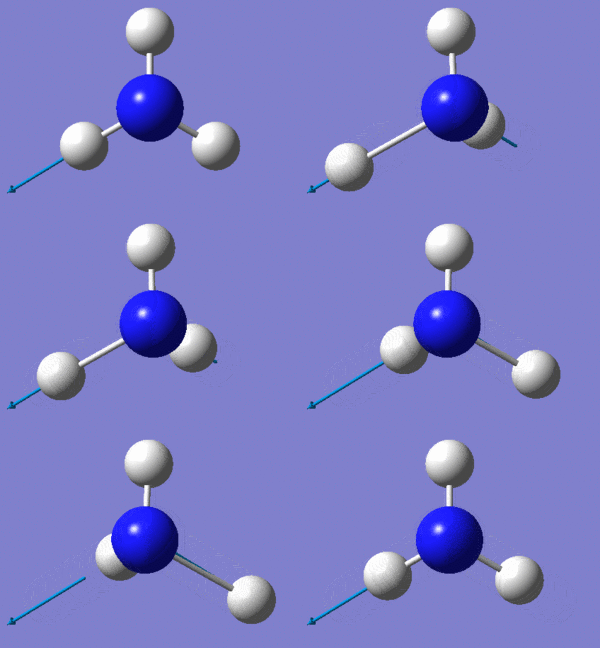
The simulated IR spectrum only shows 2 out of the expected 6 peaks. This is due to the 2 peaks at 1694cm-1 being degenerate and thus forming only 1 peak, and the 3 peaks at 3461.30, 3590 and 3590cm-1 have intensities that are too low and so do not appear in the IR spectrum.
Population analysis of NH3
File:CKL211 NH3 energy 631G.chk
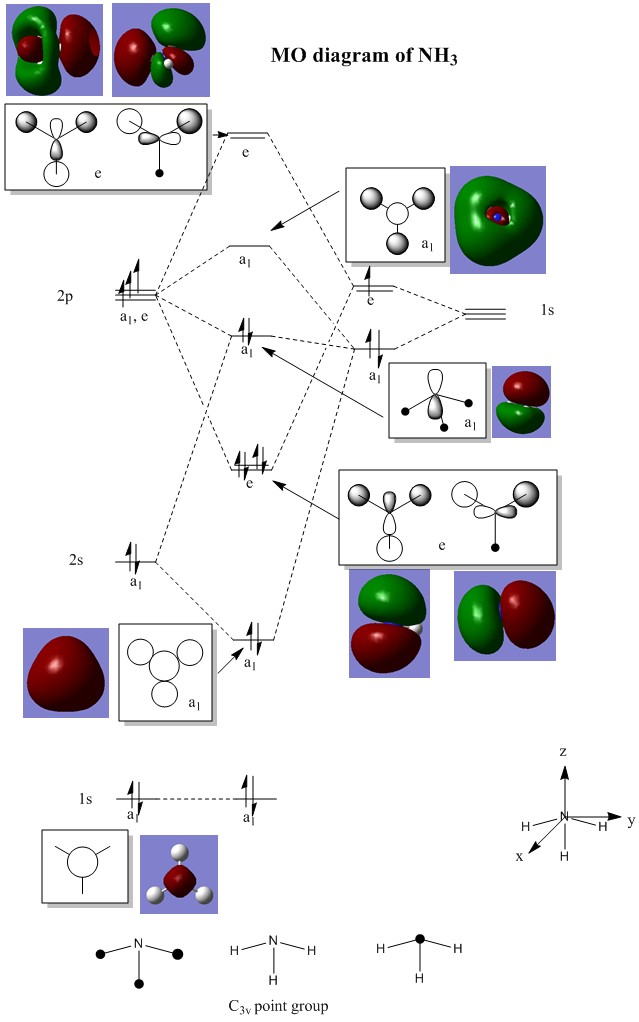
NBO analysis of NH3
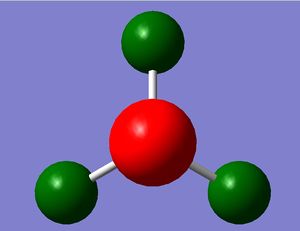
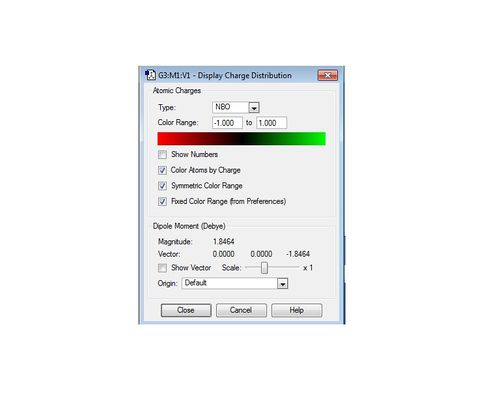
Natural Bond Orbital (NBO) analysis is used to study the charge distribution of the NH3 molecule. The diagram below shows the different electronegativities of the atoms in the molecule. As expected, nitrogen is bright green, meaning that it is highly electronegative and hydrogen is red, indicating that it is highly electropositive. The colour range is also identified and runs from -1 (red) to 1 (green).
The information of charge distribution can also be shown in numbers by Gaussian, as shown below. This gives a much more quantitative view of the charge distribution in the NH3 molecule compared to using a colour range to identify electronegativities of individual atoms relative to each other.
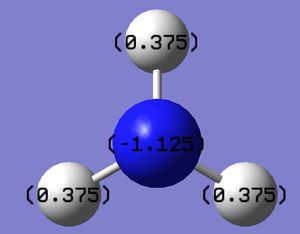
Although NBO analysis can tell us much more detail about the bonding in molecules, it does not give us much detail about the NH3 molecule, so we shall not be delving into further analysis of the NBO of NH3.
Association energies : Ammonia-Borane
Optimisation of NH3BH3
We have already analysed the optimised structures and vibrational analysis of ammonia and borane in our calculations above. These are the reactants in forming the ammonia-borane product. Now, we shall use that data to calculate the association energy of forming ammonia-borane (NH3BH3), a Lewis acid-base pair. In order for us to use the data above, we shall optimise the structure of ammonia-borane using the same basis set (6-31G(d,p)) and optimisation method as before.

|
Optimised N-H, B-H and B-N bond lengths in NH3BH3 |

|
Optimised N-H, B-H and B-N bond angles in NH3BH3 |
| Summary of results of the optimisation | |
|---|---|
| File Type | .log |
| Calculation Type | FOPT |
| Calculation Method | RB3LYP |
| Basis set | 6-31G(d,p) |
| Final energy (a.u.) | -83.22468908 |
| Gradient (a.u.) | 0.00000054 |
| Dipole moment (Debye) | 5.5646 |
| Point group | C1 |
| Length of calculation | 1 minute 4.0 seconds |
          Item               Value     Threshold  Converged?
 Maximum Force            0.000002     0.000015     YES
 RMS     Force            0.000001     0.000010     YES
 Maximum Displacement     0.000018     0.000060     YES
 RMS     Displacement     0.000009     0.000040     YES
 Predicted change in Energy=-2.871405D-11
 Optimization completed.
    -- Stationary point found.
Frequency analysis of NH3BH3
| Summary of results of the frequency analysis | |
|---|---|
| File Type | .log |
| Calculation Type | FOPT |
| Calculation Method | RB3LYP |
| Basis set | 6-31G(d,p) |
| Final energy (a.u.) | -83.22468900 |
| Gradient (a.u.) | 0.00000063 |
| Dipole moment (Debye) | 5.5646 |
| Point group | C1 |
| Length of calculation | 52.0 seconds |
         Item               Value     Threshold  Converged?
Maximum Force            0.000002     0.000450     YES
RMS     Force            0.000001     0.000300     YES
Maximum Displacement     0.000019     0.001800     YES
RMS     Displacement     0.000007     0.001200     YES
Predicted change in Energy=-3.352425D-11
Optimization completed.
   -- Stationary point found.
Low frequencies ---   -6.0031   -5.4203   -2.6168   -0.0013   -0.0009   -0.0008
Low frequencies ---  263.3568  632.9873  638.3676
Association and dissociation energies of NH3BH3

The energies of each respective reactant and product was found from the optimisation of each molecule using the same optimisation method and the same 6-31G(d,p) basis set. These energies are as below and can be used to calculate the association (and corresponding dissociation) energy of the formation of ammonia-borane molecule.
| Molecule | Energy (a.u.) |
| NH3 | -56.55776863 |
| BH3 | -26.61532360 |
| NH3BH3 | -83.22468908 |
| ΔE(Products-Reactants) | -0.05159685 (-135.47 kJ/mol) |
The energy difference between the reactants and the ammonia-borane product corresponds to the association energy, which has a value of -135.47kJ/mol. Conversely, the dissociation energy for ammonia-borane would then be +135.47 kJ/mol. Therefore, the formation of ammonia-borane is highly favoured as it reduces the energy of the ammonia-borane adduct product by a significant amount, stabilising the products relative to the reactants. Ammonia-borane has been suggested as a medium of transport for hydrogen in hydrogen fuel cells and therefore, interest in this molecule has been increasing in recent years.
Week 2:Year 3 Inorganic Computational Laboratory Mini Project (Lewis acids and bases)
With the methods we have used previously on Gaussian, we will now apply these to the studying a main group mixed halide, a Lewis acid-base pair, aluminium chlorobromide, AlCl2Br, which readily dimerises to form Al2Cl4Br2. Aluminium, a group 3 element, has 3 valence electrons which can form 3 bonds with 3 other elements to attain a 6-electron valence structure. Aluminium does not attain the stable octet structure and hence is electron deficient and would prefer to dimerise to alleviate their electron deficiency, as with boron. Hence, aluminium halides are excellent Lewis acids, accepting a pair of electrons from a Lewis base to attain the stable octet structure.
We shall be investigating the structure, bonding and possible isomers of the dimer AlCl2Br formed and explaining why the product forms a certain structure preferentially.
Optimising the monomer AlCl2Br
Optimising AlCl3
AlCl3 was first optimised using a 6-31G basis set on Gaussian. The results of the optimisation are as shown below.

|
Optimised Al-Cl bond lengths (all bond lengths equal) |

|
Optimised <ClAlCl bond angles (all bond angles equal) |
| Summary of results of the optimisation | |
|---|---|
| File Type | .log |
| Calculation Type | FOPT |
| Calculation Method | RB3LYP |
| Basis set | 6-31G(d,p) |
| Final energy (a.u.) | -1623.23327220 |
| Gradient (a.u.) | 0.00000026 |
| Dipole moment (Debye) | 0.00 |
| Point group | D3h |
| Length of calculation | 20.0 seconds |
        Item               Value     Threshold  Converged?
Maximum Force            0.000001     0.000015     YES
RMS     Force            0.000000     0.000010     YES
Maximum Displacement     0.000003     0.000060     YES
RMS     Displacement     0.000002     0.000040     YES
Predicted change in Energy=-2.203236D-12
Optimization completed.
   -- Stationary point found.
AlCl2Br cannot be optimised using this method because it is a heavy atom with 35 electrons and hence can only be calculated using a pseudo-potential which is what we shall be doing now.
Optimising AlCl2Br
One of the Cl atoms in the optimised AlCl3 molecule was replaced with a Br atom and the resulting AlCl2Br molecule optimised on Gaussian using a LanL2DZ basis set.

|
Optimised Al-Cl and Al-Br bond lengths |

|
Optimised <ClAlBr and <ClAlCl bond angles |
| Summary of results of the optimisation | |
|---|---|
| File Type | .log |
| Calculation Type | FOPT |
| Calculation Method | RB3LYP |
| Basis set | LanL2DZ |
| Final energy (a.u.) | -45.21899455 |
| Gradient (a.u.) | 0.00000031 |
| Dipole moment (Debye) | 0.52 |
| Point group | C2v |
| Length of calculation | 17.0 seconds |
         Item               Value     Threshold  Converged?
 Maximum Force            0.000001     0.000015     YES
 RMS     Force            0.000000     0.000010     YES
 Maximum Displacement     0.000007     0.000060     YES
 RMS     Displacement     0.000004     0.000040     YES
 Predicted change in Energy=-4.787363D-12
 Optimization completed.
    -- Stationary point found.
Some observations seen from changing one of the substituents on the trigonal planar aluminium trichloride from chlorine to bromine is that there is a longer Al-Br bond length (2.34Å) and shorter Al-Cl bond length (2.18Å), compared to the Al-Cl bond lengths (2.24Å) in AlCl3. The increase in bond length can be rationalised as before in the previous example comparing BH3 and BBr3 above. The slightly larger bond angle of <BrAlCl (120.4°) due to the larger radius of the bromine atom causes a slight compression of the bond angle between the two chlorine atoms (119.3°) from its ideal bond angle of 120.0° in a fully trigonal planar molecule. These two changes results in a change of symmetry of the molecule from D3h to C3v by increasing the size of one of the substituents on the trivalent aluminium from chlorine to bromine.
Dimerisation of the monomer AlCl2Br to AlCl4Br2
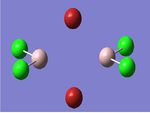
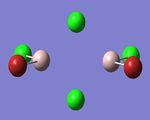
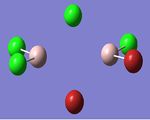
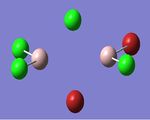
The dimerisation of AlCl2Br is expected to yield 5 possible isomers, as shown below.

The bridging atoms are expected to be out of the plane from the terminal atoms and hence isomers 4 and 5 above are expected to be energetically very similar and to be conformers of one another. This shall be studied by studying the energies of each of the 5 isomers.
Optimising the isomers of the dimers
The dimers were optimised using the same optimisation method and basis set (LanL2DZ) as the AlCl2Br dimer before.
Isomer 1:
        Item               Value     Threshold  Converged?
Maximum Force            0.000002     0.000015     YES
RMS     Force            0.000001     0.000010     YES
Maximum Displacement     0.000038     0.000060     YES
RMS     Displacement     0.000013     0.000040     YES
Predicted change in Energy=-1.349849D-10
Optimization completed.
   -- Stationary point found.
Isomer 2:
         Item               Value     Threshold  Converged?
Maximum Force            0.000000     0.000015     YES
RMS     Force            0.000000     0.000010     YES
Maximum Displacement     0.000015     0.000060     YES
RMS     Displacement     0.000006     0.000040     YES
Predicted change in Energy=-1.569231D-12
Optimization completed.
   -- Stationary point found.
Isomer 3:
         Item               Value     Threshold  Converged?
Maximum Force            0.000001     0.000015     YES
RMS     Force            0.000001     0.000010     YES
Maximum Displacement     0.000015     0.000060     YES
RMS     Displacement     0.000006     0.000040     YES
Predicted change in Energy=-4.319725D-11
Optimization completed.
   -- Stationary point found.
Isomer 4:
         Item               Value     Threshold  Converged?
Maximum Force            0.000001     0.000015     YES
RMS     Force            0.000000     0.000010     YES
Maximum Displacement     0.000031     0.000060     YES
RMS     Displacement     0.000010     0.000040     YES
Predicted change in Energy=-6.699512D-12
Optimization completed.
   -- Stationary point found.
Isomer 5:
         Item               Value     Threshold  Converged?
Maximum Force            0.000001     0.000015     YES
RMS     Force            0.000000     0.000010     YES
Maximum Displacement     0.000031     0.000060     YES
RMS     Displacement     0.000010     0.000040     YES
Predicted change in Energy=-6.698978D-12
Optimization completed.
   -- Stationary point found.
Isomers 4 and 5 show exactly the same values for all the parameters of the calculations and we can therefore assume that they are the exact same isomer, and the structures of these two isomers are essentially the same. This means that there are only four isomers from the dimerisation of AlCl2Br, namely isomers 1-4, as isomers 4 and 5 are the same. We shall therefore only consider isomers 1-4 in all further calculations.
Determining the lowest energy isomer of the dimer
From the optimisations perfomed on the isomers of the dimer above, we can deduce that isomer 3 has the lowest ground state energy and hence is the most stable isomer that forms. The energy differences between the 4 isomers can be calculated relative to isomer 3, the lowest energy conformer and are presented in the table below.
| Energy difference (a.u.) | Energy difference (kJ/mol) | |
| Isomer 1 | 0.01051438 | 27.61 |
| Isomer 2 | 0.00002227 | 0.06 |
| Isomer 4 | 0.00516296 | 13.56 |
Studying the relative energies of the isomers relative to isomer 3, we can observe that when using bromine as a bridging atom increases the energy of the conformer significantly that when the bromine are terminal atoms in the dimer form. Isomers 1 and 4 have 2 and 1 bromine atoms as the bridging atoms for the dimer and this increases the energy of the ground state conformer significantly (approx. 27.61 and 13.56 kJ/mol). This energy difference is very large compared to when chlorine atoms are used as bridging atoms, which produce the lowest energy conformer, which only needs 0.06 kJ/mol to produce another isomer with bridging chlorine atoms, namely isomer 2. Even changing one of the bridging atoms to bromine caused a significant increase in the energy of the dimer by more than 10 fold of the initial energy. Changing both bridging atoms to bromine atoms causes a 2-fold increase in the energy of the dimer compared to using 1 bromine bridging atom. This means that the molecule is more stable when chlorine is used as bridging atoms and that the use of bromine atoms as bridging atoms destabilises the molecule quite significantly and results in a corresponding increase the energy of the dimer.
This implies that chlorine is a significantly better bridging ligand compared to bromine. This is likely to be due to the fact that bromine has a bigger radius than chlorine and more diffuse orbitals. Aluminium and bromine also have a bigger size mismatch in terms of orbital size (Al and Cl are in Period 2 and bromine is in Period 3) and hence they have less efficient orbital overlap. This would be especially unfavourable when bromine is the bridging ligand because bridging ligands form 3c-2e bonds relative to when it is a terminal atom, forming a 2c-2e bond with Al.
Dissociation energy of AlCl4Br
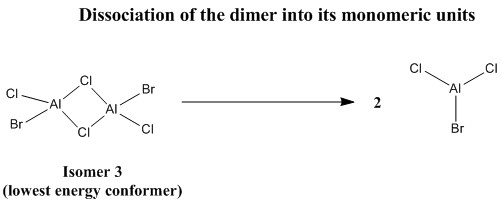
The dissociation energy of the dimer to its monomeric units can be calculated by calculating the energy difference between the reactants and the products of the reactants. This shall be illustrated in the table below.
| Molecule | Energy (in a.u.) |
| AlCl2Br | -45.21899455 |
| Al2Cl4Br2 | -90.47287740 |
| ΔE(Products-Reactants) | +0.0348883 |
The dissociation energy corresponds to the energy difference, ΔE, between the reactants and products of the equation above. This is +0.0348883a.u. which corresponds to approximately +91.60 kJ/mol. This means that the dissociation of the dimer to its monomeric units causes an increase in the energy of the molecule, which destabilises it. The difference in energy is very large (approx. 91.60kJ/mol) and this means that the dimer is significantly more stable than its constituent monomers. This is due to the fact that the monomers dimerise to alleviate their electron deficiency at its aluminium centre and by dimerising, it achieves the stable octet structure, which stabilises the dimer relative to the monomers.
Frequency analysis of each of the isomers of the dimer
A frequency analysis was then conducted on all the isomers (Isomers 1-4) to confirm that a minimum energy ground state structure has been formed.
Isomer 1:
        Item               Value     Threshold  Converged?
Maximum Force            0.000003     0.000450     YES
RMS     Force            0.000001     0.000300     YES
Maximum Displacement     0.000033     0.001800     YES
RMS     Displacement     0.000014     0.001200     YES
Predicted change in Energy=-1.403875D-10
Optimization completed.
   -- Stationary point found.
Low frequencies ---   -1.9098   -1.5299   -0.8071    0.0000    0.0001    0.0002
Low frequencies ---   15.8975   52.6156   72.9791
Isomer 2:
        Item               Value     Threshold  Converged?
Maximum Force            0.000000     0.000450     YES
RMS     Force            0.000000     0.000300     YES
Maximum Displacement     0.000015     0.001800     YES
RMS     Displacement     0.000007     0.001200     YES
Predicted change in Energy=-1.555773D-12
Optimization completed.
   -- Stationary point found.
Low frequencies ---   -0.0004    0.0000    0.0000    1.1304    1.5700    2.8318
Low frequencies ---   17.4806   42.2308   69.7910
Isomer 3:
      Item               Value     Threshold  Converged?
Maximum Force            0.000003     0.000450     YES
RMS     Force            0.000001     0.000300     YES
Maximum Displacement     0.000067     0.001800     YES
RMS     Displacement     0.000034     0.001200     YES
Predicted change in Energy=-1.985548D-10
Optimization completed.
   -- Stationary point found.
Low frequencies ---   -0.0001   -0.0001    0.0000    0.8699    1.6112    2.6969
Low frequencies ---   18.0718   40.6712   64.5202
Isomer 4:
        Item               Value     Threshold  Converged?
Maximum Force            0.000002     0.000450     YES
RMS     Force            0.000001     0.000300     YES
Maximum Displacement     0.000078     0.001800     YES
RMS     Displacement     0.000029     0.001200     YES
Predicted change in Energy=-6.214326D-11
Optimization completed.
   -- Stationary point found.
Low frequencies ---    0.0000    0.0000    0.0000    0.5387    0.5911    1.5053
Low frequencies ---   16.9747   46.4587   71.6724
Discussion of the simulated IR spectra of each of the isomers
From the frequency analysis, we can simulate the IR spectra of each of the 4 isomers above. As the dimer is a non-linear molecule with 8 atoms in total, from the formula 3N-6, we expect each isomer to have 18 vibrational modes. A quick glance through the 4 IR spectra shows that none of the isomers show the expected 18 peaks due to the 18 vibrational modes.
Simulated IR spectrum of Isomer 1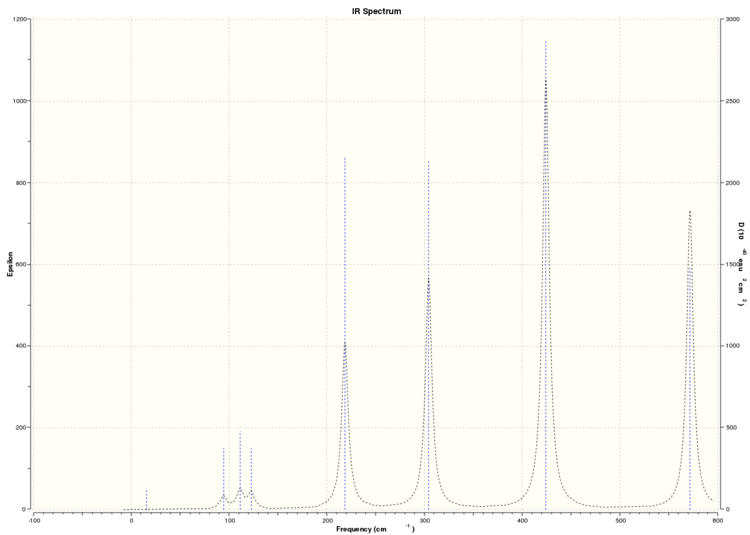
Simulated IR spectrum of Isomer 2
Simulated IR spectrum of Isomer 3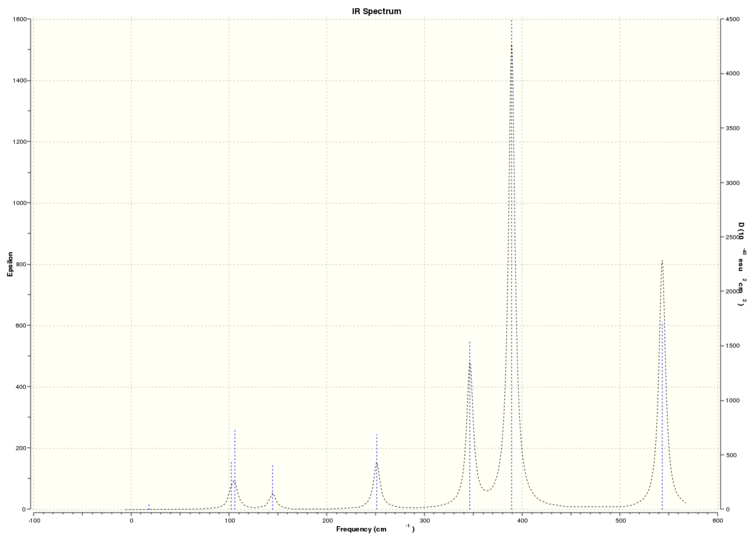
Simulated IR spectrum of Isomer 4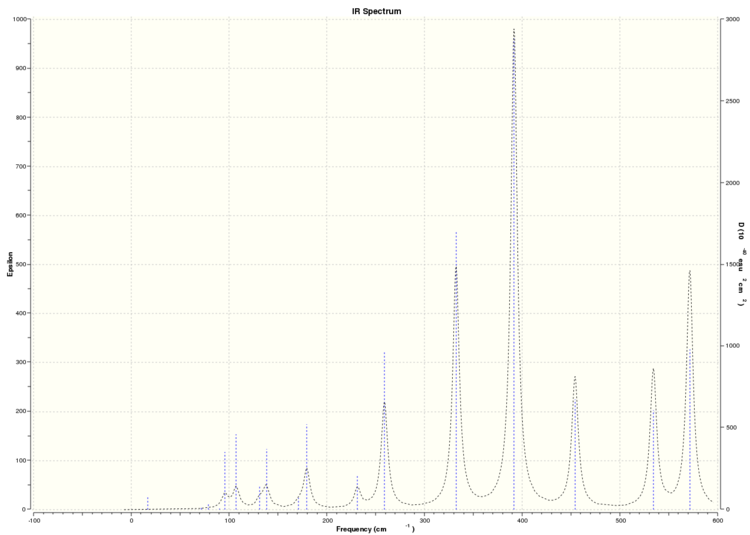
This can be understood by studying the symmetry of each of these isomers. As they are isomers, the only things that differentiates each isomer from each other are the position of the atoms in the dimer and the symmetry of the overall molecule. From calculations performed before, we can see that each of the isomers have different point groups, and hence they each have different symmetries. This would affect the symmetry of the vibrational modes of the molecule. A vibrational mode can only be IR active if there is a net change in the molecular dipole moment when the atoms vibrate. This would mean that the change in the net dipole moment of the molecular vibrations of each of these isomers would differ, leading to different numbers of bands of each IR spectrum, with the more symmetric isomers producing less IR active bands, and hence having less peaks in their IR spectra. It is worthwhile noting that the point group of isomer 4 is C1, and hence, we would expect it to have the most peaks in its IR spectrum due to its asymmetry. This is verified by its IR spectrum, where it has more than 10 visible peaks relative to the other 3 isomers, which have less than 10 visible peaks in their IR spectra because they are more symmetry (having D2h, C2v and C2h symmetry respectively).
Because not all the modes are IR active, we observe less than 18 peaks in all the IR spectra of each of the isomers.
In order to understand the relationship of the position of the bromine atoms (terminal or bridging) with its vibrational motion and hence its IR spectra, we shall now analyse some key stretching vibrations of the isomers.
| Type of stretching vibration | Al-Br terminal atoms (Isomers 2/3) | Frequency (cm-1) | Br-Br bridging atoms (Isomer 1) | Frequency (cm-1) |
| Asymmetric stretch |  |
387 | 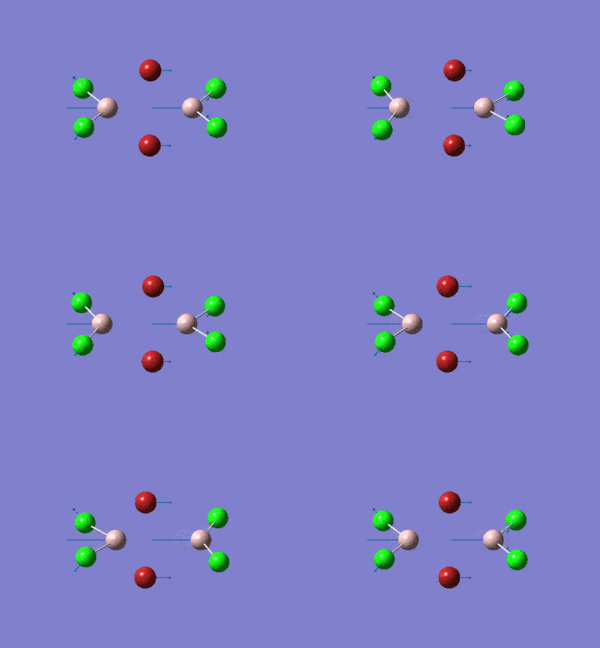 |
218 |
| Symmetric stretch | 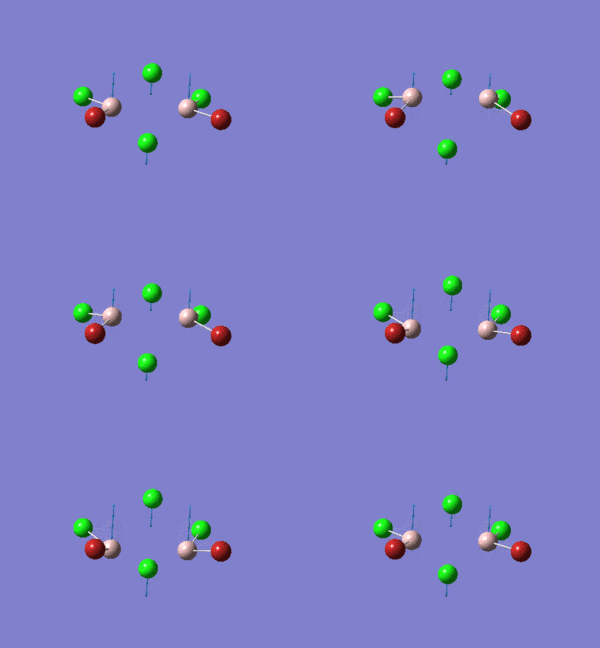 |
347 | 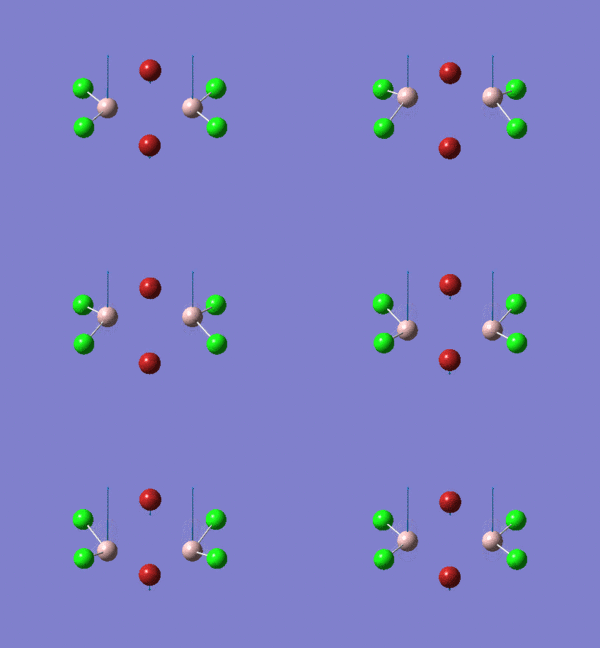 |
304 |
The vibrations compared above are one of those that are visible in the IR spectra of the isomers. Here, we compared the vibrational motions of the isomers that have the same stretching motions (symmetric or asymmetric). It is found that in general, for the same vibrational motion, the terminal bromine atoms have a higher stretching frequency than the isomer with the bridging bromine atoms. It is most likely to be due to the weaker bond strength of the bridging atoms as they form 3c-2e Br-Al-Br, compared to the terminal bromines which form much stronger 2c-2e Al-Br bonds. The lower frequency of the bridging bromine atoms can also be attributed to the heavy atom effect, whereby heavier atoms absorb at much lower frequencies because it is energetically more difficult to vibrate a bond between two heavy atoms than it is to vibrate a bond between two lighter atoms. (Recall the relationship between frequency and energy : E=hν). We can see that when there are two chlorine atoms which bridge the dimer, the frequencies are higher.
This is likely to be a main contributor to the reason why isomer 3 with the two chlorine bridging atoms is the most stable isomer (-90.47287740 a.u.)and the reason why the isomer with the two bridging bromine atom is the most energetically unstable (-90.46236302 a.u.).
(Mr of Cl=35.5 g/mol, Mr of Br=79.9 g/mol)
Studying the non-core MOs of the AlCl4Br2
Now that we have established the lowest energy isomer of the dimer (isomer 3), its molecular structure and vibrations, we now turn our attention to its reactivity. The reactivity of this dimer can be understood by studying its non-core MOs. We will study the non-core MOs as it is these MOs that are responsible for the reactivity of the dimer, and these are mostly located around the HOMO-LUMO region.
We shall analyse the interactions between some of the non-core MOs and these MOs are arranged in order of highly antibonding to highly bonding below.
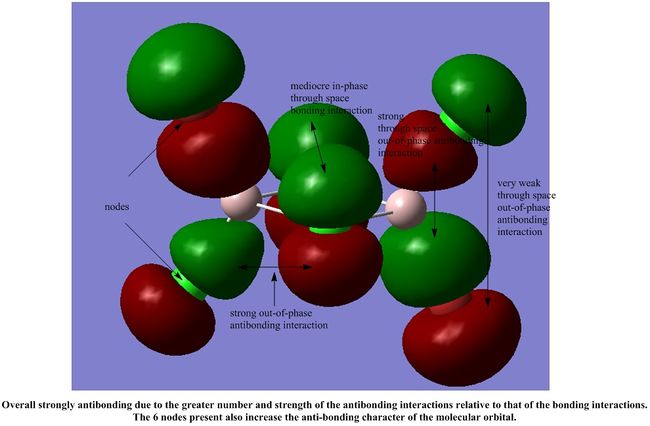
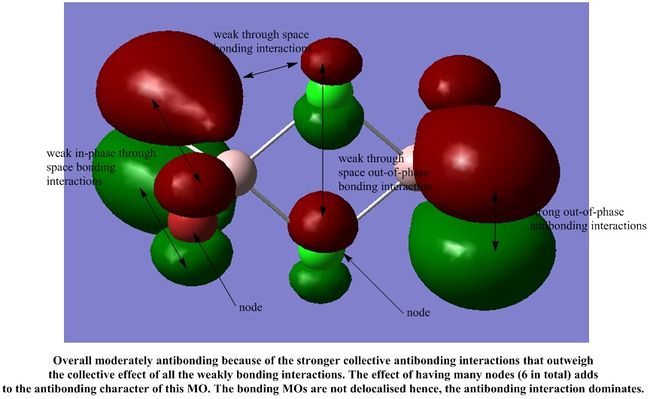
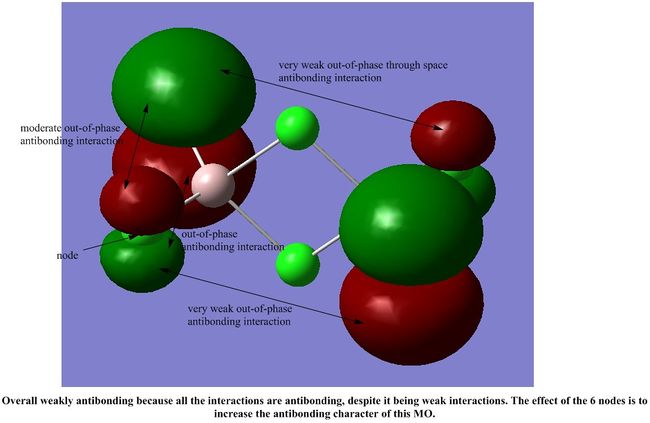
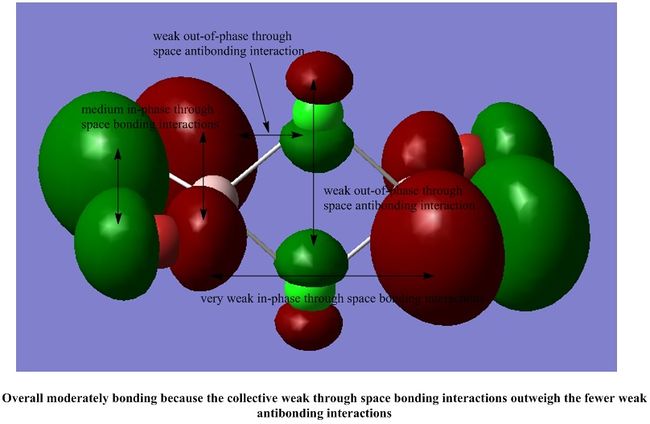
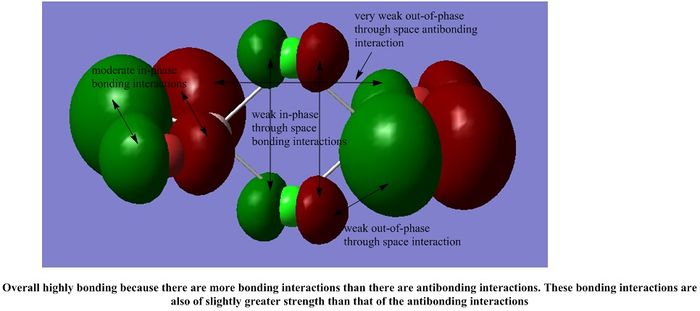
It is interesting to note that most of the interactions in all the MOs shown are weak through space interactions. This seems to suggest that the dimer itself is made up of a collection of weak interactions between its molecular orbitals. Although each individual interaction is not that strong, the large number of these weak interactions gives rise to a collectively stronger interaction, which stabilises the dimer, as we have seen in our calculations above.
However, each MO does not have such a significant number of weak interactions, so we would expect the dimer to be fairly reactive.
In this project, we have shown that this aluminium compound does follow the trend of Group 3 elements to dimerise in order to achieve the stable octet structure and alleviate electron deficiency. In order for the aluminium to dimerise, it behaves as a Lewis acid and accepts an electron pair from a Lewis base to form a Lewis acid-base adduct. It usually achieves this in this case via bridging ligands which form 3c-2e bonds because it cannot form a +4 Al compound due to it having only 3 valence electrons and it dimerises because there is no other compound present to its electron pair to it. The resulting dimer is more stable than its monomeric units, as we have seen from this example above. We have identified that the most stable isomer is the one with having two chlorine atoms as the bridging ligands and the two terminal bromine atoms each joined to a different Al atom in a trans-configuration. We have also shown that chlorine is a much better bridging ligand than bromine as it forms stronger Al-Cl bonds because Al and Cl have similar orbital sizes, leading to more efficient orbital overlap. Overall, we have proven that the dimerisation of AlCl2Br is a favourable process.
References
- ↑ "Structure of Free Molecules in the Gas Phase", CRC Handbook of Chemistry and Physics, ed. W.M. Hayes and D.R. Lide, 94th edition, 2013-2014

