Rep:Mod:ck2917
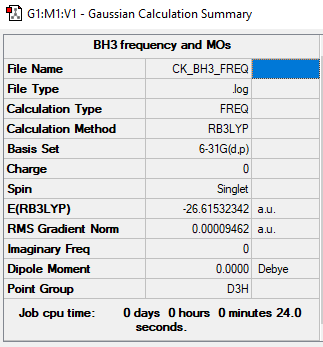
BH3 section
Method and Basis Set
RB3LYP, 6-31G(d.p)
Summary Table
Item Table
Item               Value     Threshold  Converged?
 Maximum Force            0.000189     0.000450     YES
 RMS     Force            0.000095     0.000300     YES
 Maximum Displacement     0.000746     0.001800     YES
 RMS     Displacement     0.000373     0.001200     YES
 Predicted change in Energy=-2.116143D-07
 Optimization completed.
    -- Stationary point found.
Link to frequency .log file
Low Frequencies
Low frequencies ---   -0.2263   -0.1037   -0.0055   47.9770   49.0378   49.0383
Low frequencies --- 1163.7209 1213.6704 1213.6731
BH3 |
Additional Information
| Vibrations | Frequency | Intensity | Symmetry | Mode | IR activity | |
|---|---|---|---|---|---|---|
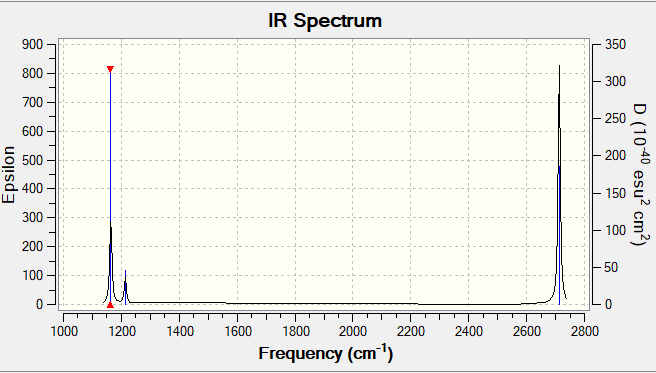
| 1 | 1163.72 | 92 | A2" | out of plane bend | Yes | |
| 2 | 1213.67 | 14 | E' | bend | Yes | |
| 3 | 1213.67 | 14 | E' | bend | Yes | |
| 4 | 2579.75 | 0 | A1' | symmetric stretch | No | |
| 5 | 2712.67 | 126 | E' | asymmetric stretch | Yes | |
| 6 | 2712.67 | 126 | E' | assymetric stretch | Yes |
IR spectrum
Using the 3N-6 rule, 6 vibrational modes are expected to arise. Modes of the same frequency are degenerate. Modes 4,5 and 6 are stretching as they vibrate at much higher frequencies compared to modes 1,2 and 3 which are bending. This deduction can be done since stretching modes require higher energies to form (hence higher frequencies). 3 peaks are present in the BH3 IR spectrum. Peaks are present as the molecule has vibrations which cause a change in the dipole moment and hence are IR active. Mode 1 is known as the "umbrella" mode. The first peak occurs due to Mode 1. The second peak occurs due to modes 2 and 3 which are degenerate bends and appear as one peak. These 2 peaks almost correspond to the actual IR spectrum even though broadness and relative intensities are not exactly reflected by the approximation. Mode 4 being highly symmetric is IR inactive. The last peak is due to modes 5 and 6 being degenerate stretches appearing as one peak.
Molecular Orbital Diagram
MO Diagram (Using the MO diagram from the linkː http://www.huntresearchgroup.org.uk/teaching/teaching_MOs_year2/P1_BH3_MO_diagram.pdf)
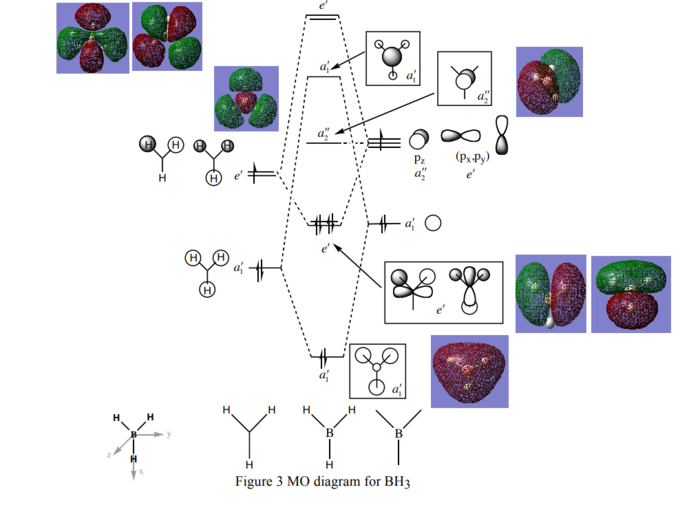
The computed MOs (real) match the MO drawings (theoretical) pretty well, except the a'1 antibonding MO where some of the theoretical orbitals drawn(white ones) are found to be smaller than the real ones. Hence qualitative MO theory is found to be relatively useful.
NH3 section
Method and Basis Set
RB3LYP, 6-31G(d.p)
Summary Table
Item Table
Item               Value     Threshold  Converged?
 Maximum Force            0.000006     0.000450     YES
 RMS     Force            0.000004     0.000300     YES
 Maximum Displacement     0.000012     0.001800     YES
 RMS     Displacement     0.000008     0.001200     YES
 Predicted change in Energy=-9.843886D-11
 Optimization completed.
    -- Stationary point found.
NH3BH3 section
Ng611 (talk) 00:46, 22 May 2019 (BST) You're missing your low frequency table, log files, and jmol image.
Method and Basis Set
RB3LYP, 6-31G(d.p)
Summary Table
Item Table
Item               Value     Threshold  Converged?
 Maximum Force            0.000122     0.000450     YES
 RMS     Force            0.000058     0.000300     YES
 Maximum Displacement     0.000531     0.001800     YES
 RMS     Displacement     0.000296     0.001200     YES
 Predicted change in Energy=-1.655549D-07
 Optimization completed.
    -- Stationary point found.
Calculations
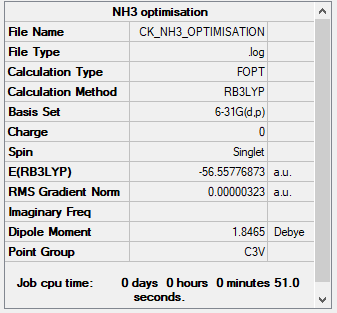
E(NH3) = -56.55776873 a.u.
E(BH3) = -26.61532342 a.u.
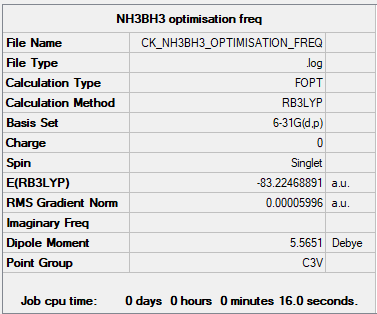
E(NH3BH3) = -83.22468891 a.u.
Association Energy
Determining the energy of association of the acid base pair
NH3 + BH3 -> H3B:NH3
ΔE = E(NH3BH3) - [E(NH3)+E(BH3)]
ΔE = -0.05159676 a.u.
ΔE = -135 kJ/mol
Ng611 (talk) 00:48, 22 May 2019 (BST) Good calculation!
As shown by the calculation, a negative value for the dative covalent bond illustrates a favourable process and intereaction. As a result, when NH3 and BH3 come together to form an adduct, the energy of the system is lowered. Upon comparison to a Carbon-Carbon single bond (appx ~90 kJ/mol) and Carbon-Oxygen double bond (appx. ~180 kJ/mol), the B-N dative covalent single bond in BH3NH3 can be considered a bond of medium strength. The origins of the strength is due to the electronegativity difference of Boron and Nitrogen, increasing the ionic character of the bond.
Ng611 (talk) 00:47, 22 May 2019 (BST) Cite your literature values!
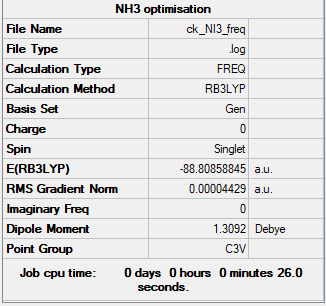
NI3 section
Link to frequency .log file
Summary Table
Item Table
Item               Value     Threshold  Converged?
 Maximum Force            0.000088     0.000450     YES
 RMS     Force            0.000044     0.000300     YES
 Maximum Displacement     0.000858     0.001800     YES
 RMS     Displacement     0.000481     0.001200     YES
 Predicted change in Energy=-1.191918D-07
 Optimization completed.
    -- Stationary point found.
Low Frequencies
Low frequencies ---  -12.3847  -12.3783   -5.6131   -0.0040    0.0194    0.0711
Low frequencies ---  100.9307  100.9314  147.2333
NI3 |
Optimised N-I bond distance = 2.18424 Angstroms
Mini Project section - Ionic Liquids
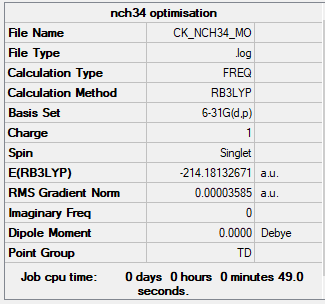
[N(CH3)4]+
Method and Basis Set
RB3LYP, 6-31G(d.p)
Summary Table
Ng611 (talk) 00:48, 22 May 2019 (BST) Where are your jmols?
Item Table
Item               Value     Threshold  Converged?
 Maximum Force            0.000072     0.000450     YES
 RMS     Force            0.000036     0.000300     YES
 Maximum Displacement     0.000710     0.001800     YES
 RMS     Displacement     0.000407     0.001200     YES
 Predicted change in Energy=-2.953830D-07
 Optimization completed.
    -- Stationary point found.
Link to frequency .log file
Low Frequencies
Low frequencies ---   -0.0010   -0.0009   -0.0003   34.5756   34.5756   34.5756
Low frequencies ---  216.6755  316.0300  316.0300
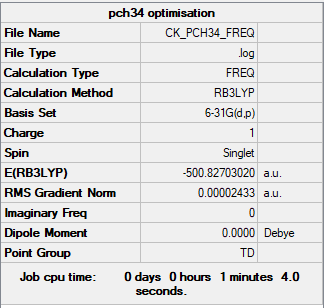
[P(CH3)4]+
Method and Basis Set
RB3LYP, 6-31G(d.p)
Summary Table
Item Table
Item               Value     Threshold  Converged?
 Maximum Force            0.000035     0.000450     YES
 RMS     Force            0.000024     0.000300     YES
 Maximum Displacement     0.000469     0.001800     YES
 RMS     Displacement     0.000414     0.001200     YES
 Predicted change in Energy=-1.901853D-07
 Optimization completed.
    -- Stationary point found.
Link to frequency .log file
Low Frequencies
Low frequencies ---   -0.0017   -0.0002    0.0015   26.3535   26.3535   26.3535
Low frequencies ---  161.2375  195.6884  195.6884
NBO Charge Analysis
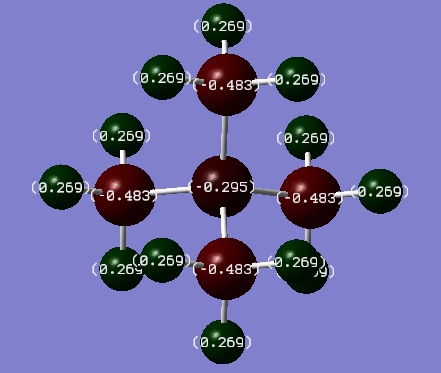
[N(CH3)4]+ charge distribution
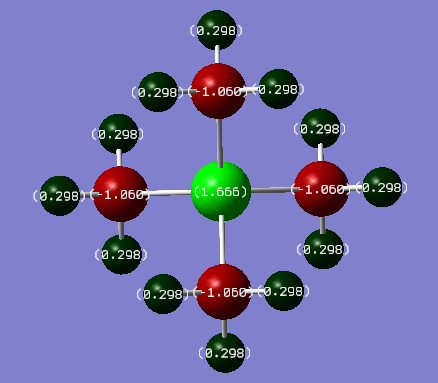
[P(CH3)4]+ charge distribution
| Atom | Charge(Debye)/in N and P complex respectively | Electronegativity | |
|---|---|---|---|
| Carbon | -0.483/-1.060 | 2.55 | |
| Hydrogen | 0.269/0.298 | 2.20 | |
| Nitrogen | -0.295 | 3.04 | |
| Phosphorous | 1.666 | 2.19 |
The formal positive charges on Nitrogen and Phosphorous are placed on them just for simplicity. Assuming that electrons are shared between atoms within chemical bonds (ignoring electronegativities). As electrons are thought to be localised in bonds, the formal positive charges in the valence bond model represent an electron count around the central atom. From NBO analysis it was found that charges are delocalised throughout the whole molecule. In N(CH3)4]+ positive charge is only shown on the hydrogens while Nitrogen being highly electronegative bears a negative charge. NBO analysis is in disagreement with VSEPR theory and bond localisation predict due to MOs spanning through the entire real life molecules leading to a delocalisation of charge. When comparing the two molecules, the P-C bond has a much greater charge separation than the N-C bond due to the difference in electronegativities between the two molecules present in the bond (C-P ΔΧ = 0.36, C-N ΔΧ = -0.49). P bears a positive charge as it is more electropositive than C and N, hence most of the positive charge in the molecule resides on that central atom.
Valence Molecular Orbital Analysis
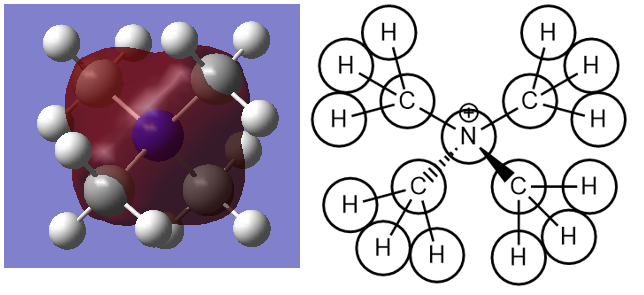
This is the lowest energy valence MO6 with energy of -1.19646 a.u. It is totally symmetric with a1 symmetry. It arises from contributions of H 1s, C 2p and N 2p atomic orbitals. Direct through bond bonding interactions between C and N centres as well as C and H centres.
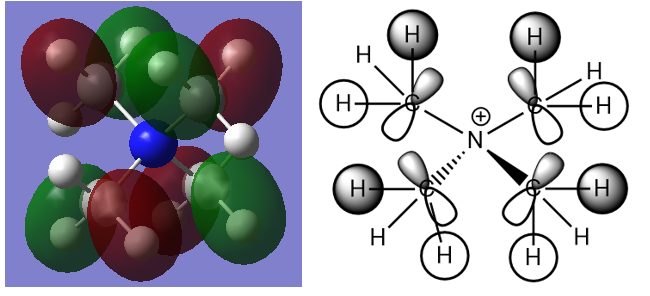
This is a triply degenerate MO16 with energy of -0.58034 a.u. There isn't any contribution from nitrogen AOs in this valence MO (making the nitrogen non-bonding). Several nodes are present hence rasing the energy of this occupied valence MO. Most are due to C 2p orbitals. It arises from direct bonding interactions between C 2p and H 1s orbitals. Moreover, through space anti-bonding interactions are present between lobes on different atoms. However, this anti-bonding character is small compared to the through bond bonding interactions. It can be deduced that this orbital is bonding overall as there aren't any nodes present between bonds.
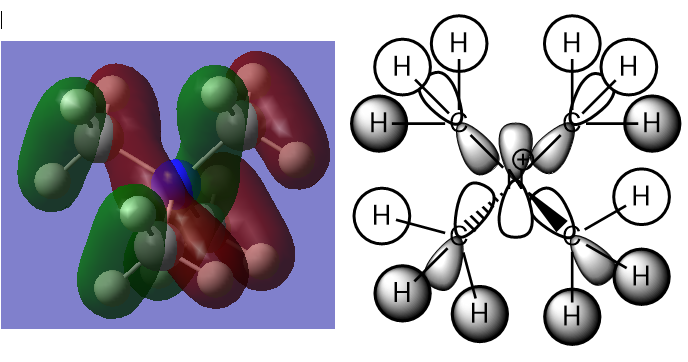
This is a triply degenerate MO19 with energy of -0.57934 a.u. Many nodes are present raising the energy of this occupied MO. It arises from contributions of H 1s, C 2p and N 2p AOs. Strong direct through bond interactions are present between 2 H 1s and C 2p orbitals as well as C 2p and N 2p orbitals. Some weak through space interactions are present between H 1s orbitals that are out of phase. Overall this valence MO is considered bonding as the bonding interactions are greater and stronger than the antibonding
Ng611 (talk) 00:52, 22 May 2019 (BST) These are all correct, well done! I would represent your methyl group orbitals with appropriate FOs, rather than having every MO in your diagram. Also, instead of writing a massive paragraph, annotate your LCAO diagrams.

