
Rep:Mod:cjmodule2
Module 2
Introduction
In the classical method, ie. Chembio 3D, the molecule is considered as a ball/stick model, and the optimisation (MM2) is simply worked on minimisation of the spatial arrangement and the stretching/vibrational forces with each associated bond.
In this module, we are using a more accurate optimisation by using ab initio method, rather than the classical method, it also considers the stereoelectronics and quantum mechanics factor. The programme uses the Shrõdinger Equation by solving the inter-nuclear separation R, as a consequence, the inter-nuclear repulsion is sacrificed to accomplish a full electrostatic interaction.
BH3
Optimised bond length and angle
 |
What is the optimised B-H bond distance? |
| 1.194Å | |
| What is the optimised H-B-H bond angle? | |
| 120.0°C |
BH3 optimisation summary
 |
What is the calculation type? FOPT |
| What is the calculation method? RB3LYP | |
| What is the basis set? 3-21G | |
| What is the final energy in atomic units (au)? -26.46226438 a.u. | |
| What is the gradient? 0.00000083 a.u. | |
| What is the dipole moment? 0.0000 D | |
| What is the point group of your molecule? D3h | |
| How long did your calculation take? 17s |
Comment: the gradient of optimised BH3 is 0.00000083, which is much less than 0.001 and very close to zero, this indicates a successful optimisation of this molecule.
Total Energy and RMS Gradient tracking

From both graphs above, we can see the lines went nearly horizontal and reached to approximately zero (i.e. zero gradient), consider about the Potential Surface diagram, this indicates a successful optimisation of the molecule as it reaches the lowest point on the ‘’inversed-bell-shaped’’ PES graph in order to optimise to the equilibrium structure. ie. the equalibrium inter-nuclear separation R is achieved.
As mentioned above, the RMS gradient can only be near to zero, but it can never reach exact zero. Normally, the programme will go through the other configuration with higher energy first before it finds the lowest. However, sometimes the programme believes a molecule can be optimised to even lower energetic configuration when the molecule is already in the lowest point of the PES graph, and so the optimisation ends by the RMS gradient reaches its minimum, which will not be the accurate configuration.
BCl3
In comparison with BH3, Cl has 17 electrons where as H only has 1. and therefore, in this optimisation, a basis set of LANL2MB is used rather than 3-21G or 6-31G, and also the pseudo optiential, this is due to a much larger number of electron are presented in this system, and the new setting can remove the complication of effect from core electrons.
(A) BCl3 optimisation
Restricting the Symmetry of BCl3
 |
All the results were adjusted to their accuracy level. |
| What is the optimised B-Cl bond distance? 1.87 Å | |
| What is the optimised Cl-B-Cl bond angle? 120.0 °C |
BCl3 optimisation summary
 |
What is the calculation type? FOPT |
| What is the calculation method? RB3LYP | |
| What is the basis set? LANL2MB | |
| What is the final energy in atomic units (au)? -69.43928112 a.u., 182312 J/mol | |
| What is the gradient? 0.00005905 a.u. | |
| What is the dipole moment? 0.00 D | |
| What is the point group of your molecule? D3h | |
| How long did your calculation take? 10s |
Graphical representation of optimised molecule:
Comment
- The gradient of optimised BCl3 is less than 0.0001, which indicates a successful optimisation of this molecule.
Comparison with BH3
- The B-H bond is stronger than B-Cl bond, and as expected, the total energy after optimisation of BH3 is higher than BCl3.
- BH3 has a shorter bond length of 1.19 Å, whereas BCl3 has longer bond length of 1.87 Å, this is due to hydrogen has much smaller atomic size relative to chlorine.
- In order to minimise the repulsion interation (ie. minimium energy configuration), both BH3 and BCl3 are having trigonal planar stucture and adopting the same point group of D3h, therefore, the dipole moments were cancelled out due to the structure. And hence, the angles of Cl-B-Cl and H-B-H are the same (120.0°C) although they have different number of valence electrons.
Own molecule optimisation – H2O
(A) 1st optimisation in B3LYP/3-21G
The Jmol structure of optimised water by 3-21G basis set:
What is the optimised O-H bond distance? 0.9968 ≈ 1.00 Å
What is the optimised H-O-H bond angle? 103.991 ≈ 104.0°C
Summary of 1st optimisation

What is the file type? .log
What is the calculation type? FOPT
What is the calculation method? RB3LYP
What is the basis set? 3-21G
What is the final energy in atomic units (au)? -75.97396516 a.u.
What is the gradient? 0.00011752 a.u.
What is the dipole moment? 0.00 D
What is the point group of your molecule? C2V
How long did your calculation take? 20s
the xyz coordinates of your molecule? [center number 1 = oxygen, 2 = hydrogen(1), 3 = hydrogen(2)]

(B) 2nd optimisation in B3LYP/6-31G (finer)
- the magnitude of RMS gradient is bigger than 0.0001 in previous optimisation, and so the H2O molecule was once again optimised by 6-21G basic set.
The Jmol structure of optimised water by 6-31G basis set:
What is the optimised O-H bond distance? 0.98Å
What is the optimised H-O-H bond angle? 108.4 °C
Summary of 2nd optimisation

What is the file type? .log
What is the calculation type? FOPT
What is the calculation method? RB3LYP
What is the basis set? 6-31G
What is the final energy in atomic units (au)? -76.38611661 a.u.
What is the gradient? 0.00003532 a.u.
What is the dipole moment? 0.00 D
What is the point group of your molecule? C2V
How long did your calculation take? 16s
the xyz coordinates of your molecule? [center number 1 = oxygen, 2 = hydrogen(1), 3 = hydrogen(2)]

Comment: the gradient of optimised H2O is less than 0.001, which indicates a successful optimisation of this molecule. The second optimisation with 6-31G basis set broght the molecule to a lower enery conformation, which 1082.1 kJ/mol less than the first optimisation.
BH3 Vibrational Frequency
BH3 Summary after frequency running:

final energy from frequency: -26.46226468 a.u.
final energy from optimisation: -26.46226438 a.u.
They are matching well enough to carry on for further analysis.
IR results of BH3

There is no negative frequency shown on IR, this is indicates a successful optimisation of BH3 by B3LYP/6-31G.
BH3 freq summary table
| Frequency/cm-1 | Intensity | Form of Vibration | Symmetry D3h Point Group |
|---|---|---|---|
| 1145.7 | 92.7008 |  |
A’’ |
| 1204.65 | 12.3783 |  |
E' |
| 1204.65 | 12.3808 |  |
E' |
| 2592.85 | 0 |  |
A1’ |
| 2731.37 | 103.836 |  |
E' |
| 2731.37 | 103.829 |  |
E' |
MOs diagram of BH3
In the Gaussview programme, the system generates the graphical representations of MO by solving the Schrőedinger equation; this includes all the occupied molecule orbitals as well as the LUMO. However, the Gaussview cannot take into all the electron-electron repulsion into account of the Hamiltonian operators, and so these graphical representations are only approximations.
| No. of orbital | Fragment orbital Surface (computational) | Symmetry |
|---|---|---|
| 1 |  |
a1’, This is the S-orbital of boron and it has the lowest energy overall, as the energy (-6.73 a.u.)is too lower to interact with any other orbitals, and so it is not presents in the MOs diagram in next section |
| 2 |  HOMO-2 HOMO-2 |
a1’, This is the first interacting bonding orbital of boron, as present in the graphical representation, all three hydrogen s-orbital's are in phase it, and this results a very strong sigma-overlapping. |
| 3 |  HOMO-1 HOMO-1 |
e', Orbital number 3 and 4 are degenerated. |
| 4 |  HOMO HOMO |
e' |
| 5 |  LUMO LUMO |
a2’, This is the LUMO orbital and much more diffused than other orbitals as it is unfilled. Its orbital energy is a bit higher than the others, and so, any electron added into this orbital will result a stabilisation, thus BH3 can act as a Lewis acid charactor. |
| 6 |  LUMO+1 LUMO+1 |
a1’ |
| 7 |  |
E' |
| 8 |  |
A'1 |
MO diagram of BH3 (Chemdraw)

Metal ligand Mo(CO)4L2 Isomers – cis and trans
The set of isomer (cis- and trans-)of molybdenum complex Mo(CO)4L2 were optimised twice due to large structure they have, and the optimisation were carried out firstly by B3LYP/LANL2MB, and further optimised by B3LYP/LANL2DZ. The optimised Mo-isomers were used to predict the IR vibrations by Gaussview Frequency.
(A) Summary and Disscution of optimisation results
Both cis and trans isomer have a symmetry of C1, which means they don't have any symmetry at all.
Optimised structure of cis-isomer of Mo(CO)4P(CH3)3
- First optimisation by LANL2MB (http://hdl.handle.net/10042/to-1840)
- Second optimisation by LANL2DZ (http://hdl.handle.net/10042/to-1714)
Optimised structure of trans-isomer of Mo(CO)4P(CH3)3
- First optimisation by LANL2MB (http://hdl.handle.net/10042/to-1841)
- Second optimisation by LANL2DZ (https://www.ch.ic.ac.uk/wiki/index.php/Image:CSJIN_Metalligand_trans_LANL2DZ_method_result.out)
Optimised Total Energy and RMS Gradient
| First Optimisation (DFT/B3LYP/LANL2MB) | cis-isomer of Mo(CO)4P(CH3)3 | -2007154 kJ/mol | RMS gradient = 0.00009691 a.u. |
| trans-isomer of Mo(CO)4P(CH3)3 | -2007129 kJ/mol | RMS gradient = 0.00042413 a.u. | |
| Second Optimisation (DFT/B3LYP/LANL2DZ) | cis-isomer of Mo(CO)4P(CH3)3 | -2030457 kJ/mol | RMS gradient = 0.00004122 a.u. |
| trans-isomer of Mo(CO)4P(CH3)3 | -2030450 kJ/mol | RMS gradient = 0.00004961 a.u. |
The results from both first and second optimisations showed that the energy of cis-isomer has lower energy than trans-isomer. This result is not quite expected, as the trans-isomer is sterically much less hindered. In cis configuration, the bulky PMe3 groups (95.322°) are next to each other, whereas in trans, these groups (178°) are orthogonal to each other. Although the cis-isomer is sterically unstable, but it is electronically more stable than trans-isomer, the computational result proves that the electronic stabilisation overcomes the steric destabilisaiton.
(B) cis-isomer of Mo(CO)4P(CH3)3 - Bond Distances and Bond Angles
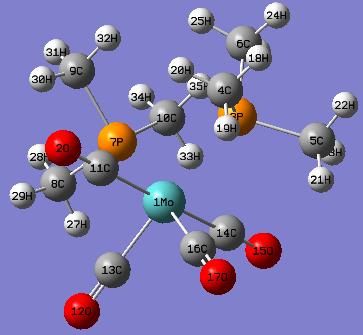

Comparison of the optimised bond distances of cis- Mo(CO)4P(CH3)3 and the experimental values of cis- Mo(CO)4(PMe3Ph)2
| Bond | Bond Distance (after optimisation) | Bond DIstance (experimental literature) |
|---|---|---|
| Mo(1)-P(7) | 2.65208 | 2.533 |
| Mo(1)-P(3) | 2.64784 | 2.525 |
| Mo(1)-C(11) | 2.03248 | 1.998 |
| Mo(1)-C(13) | 1.98297 | 1.983 |
| Mo(1)-C(14) | 2.03253 | 2.034 |
| Mo(1)-C(15) | 1.98102 | 1.981 |
| P(3)-C(4) | 1.89039 | 1.819 |
| P(3)-C(5) | 1.89042 | 1.837 |
| P(3)-C(6) | 1.89564 | 1.862 |
| P(7)-C(8) | 1.89003 | 1.815 |
| P(7)-C(9) | 1.89298 | 1.836 |
| P(7)-C(10) | 1.89296 | 1.863 |
| C(11)-O(2) | 1.18794 | 1.150 |
| C(13)-O(12) | 1.19127 | 1.125 |
| C(14)-O(15) | 1.18796 | 1.150 |
| C(16)-O(17) | 1.19236 | 1.163 |
Comparison of the optimised bond angles of cis- Mo(CO)4P(CH3)3 and the experimental values of cis- Mo(CO)4(PMe3Ph)2
| Bond | Bond Angle (after optimisation) | Bond Angle (experimental literature) |
|---|---|---|
| P(3)-Mo(1)-P(7) | 95.322 | 94.75 |
| P(7)-Mo(1)-C(14) | 88.900 | 89.7 |
| P(7)-Mo(1)-C(11) | 88.707 | 87.8 |
| P(7)-Mo(1)-C(13) | 89.485 | 94.0 |
| P(7)-Mo(1)-C(16) | 178.439 | 176.3 |
| P(3)-Mo(1)-C(14) | 89.567 | 87.1 |
| P(3)-Mo(1)-C(11) | 89.813 | 87.8 |
| P(3)-Mo(1)-C(13) | 175.192 | 175.5 |
| P(3)-Mo(1)-C(16) | 86.236 | 89.3 |
| Mo(1)-C(11)-O(2) | 179.347 | 178.0 |
| Mo(1)-C(13)-O(12) | 178.900 | 178.0 |
| Mo(1)-C(14)-O(15) | 179.406 | 178.5 |
| Mo(1)-C(16)-O(17) | 179.774 | 179.1 |
| C(11)-Mo(1)-C(14) | 177.462 | 177.0 |
| C(11)-Mo(1)-C(13) | 90.412 | 89.9 |
| C(11)-Mo(1)-C(16) | 91.193 | 89.9 |
| C(14)-Mo(1)-C(16) | 91.223 | 92.9 |
| C(14)-Mo(1)-C(13) | 90.412 | 89.2 |
(C) trans-isomer of Mo(CO)4P(CH3)3 - Bond Distances and Bond Angles
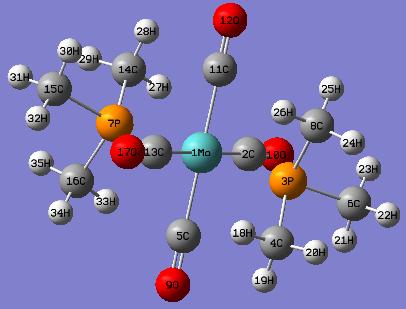
Comparison of the optimised bond distances of trans- Mo(CO)4P(CH3)3 and the experimental values of trans-Mo(CO)4(Ph)2PNHMe2
| Bond | Bond Distance (after optimisation) | Bond DIstance (experimental literature) |
|---|---|---|
| Mo(1)-P(3) | 2.57199 | 2.4584 |
| Mo(1)-C(5) | 2.02877 | 2.035 |
| Mo(1)-C(11) | 2.02843 | 2.024 |
| C(5)-O(9) | 1.18967 | 1.135 |
| C(11)-O(12) | 1.18997 | 1.144 |
| P(3)-C(6) | 1.88955 | 1.819 |
| P(3)-C(8) | 1.88979 | 1.826 |
| P(3)-C(6) | 1.89564 | 1.840 |
Comparison of the optimised bond angles of trans- Mo(CO)4P(CH3)3 and the experimental values of trans-Mo(CO)4(Ph)2PNHMe2
| Bond | Bond Angle (after optimisation) | Bond Angle (experimental literature) |
|---|---|---|
| P(3)-Mo(1)-C(2) | 90.976 | 89.21 |
| P(3)-Mo(1)-C(11) | 91.081 | 90.82 |
| P(3)-Mo(1)-C(13) | 88.527 | 88.34 |
| P(3)-Mo(1)-C(5) | 89.241 | 89.26 |
| Mo(1)-C(11)-O(2) | 179.449 | 178.8 |
| Mo(1)-C(13)-O(17) | 179.566 | 178.9 |
| Mo(1)-C(5)-O(9) | 179.737 | 179.2 |
| Mo(1)-C(2)-O(10) | 179.777 | 179.3 |
| Mo(1)-P(3)-C(4) | 115.585 | 113.95 |
| Mo(1)-P(3)-C(6) | 117.431 | 119.77 |
(D) IR anaylsis of Mo(CO)4P(CH3)3

![]()
A negative frequency shows in both IR spectrum, by using animation, it indicates that this frequency arises from partially twist along P-Mo-P axis (highlighted in green), which means the molecule was in its transition states rather than the most optimised orientation. However, this negative frequency is quite far away from the stretching we are majorly interested (ie. C=O stretch), and therefore, it will be feasible to carry on for further IR analysis.
IR spectrum of cis-isomer


IR spectrum of trans-isomer
![]()
![]()
The trans and cis isomer had a set of similar major peaks except the weak peak at 1930cm-1. The major peak is contributed by the C=O stretches, and these stretches overlap with each other since they are very close in energy.
The cis and trans isomers seem like having very similar vibrational frequencies, but actually they are different by meaning of vibrational form, and this can explain that why the frequencies are slightly not the same.For the C=O stretches, the trans-isomer shows one frequency less than the cis one from the IR spectrum, but therotically, the trans is possible to have this symmetric stretch of C=O. This is due to the symmetry of trans is such that this stretch did not make a change in dipole, and so the IR cannot detect this vibration.
How to favour formation of cis-isomer
- Presence of cation or NH pi-interaction to the transition metal complex. (can be done by inerting phenyl ring or pyridinium ring to the TM complex as ligands)
- Presence of intramolecular H-bonding to the transition metal complex. (can be done by inserting lone pairs of O, F or N)
How to favour formation of trans-isomer
- Presence of large ligand group. (when the transition metal is in liquid or solid phase, minimise the sterically disfavourable factor)
NH3
(A) NH3 optimisation with B3LYP/6-31G method
(1) Standard NH3

(2) Stretched NH3
The above NH3 molecule was modified by stretching one N-H bond from 1.00 to 1.01Å, which destroyed the original symmetry. The optimised result is shown below:

(3) NH3 with pink dummy atom
By using the provided txt. file, the standard NH3 molecule generated a pink dummy atom in order to restrict the symmetry.

- pink dummy atom disappears after optimisation.

(B) NH3 further optimisation with 6-311+G(d,p) basis set and the MP2 method
(1) Standard NH3
Without using the dummy atom, the initial normal NH3 with C3v is optimised by higher basis set, 6-311+G(d,p) :

(2) NH3 with pink dummy atom
Same as in the previous part, by using the provided txt. file, the standard NH3 molecule generated a pink dummy atom in order to restrict the symmetry.

- pink dummy atom disappears after optimisation.

Calculation time: The time used for this method was longer than previous method, this is majorly due to a more complex and accurate basis set was used, which means a more detailed calculation was carried out.
Energy difference: (56.43444511-56.42664911)*2625.5 = 20.468398 KJ/mol, this energy difference means the conversion between these two point groups is 20.47 kJ/mol, which is fairly closed to the literature result. Literature result: 24.3 KJ/mol
Energy change between the B3LYP/6-31G and MP2/6-311+G(d,p) sets: For the normal NH3, the total energy of primary method sent is approximately 255.83 kJ/mol higher than MP2/6-311+G(d,p) method. This proves that the use of suitable basis set is essential in optimisation calculation.
(C) Inversion mechanism of NH3
Another provided file was used to convert the NH3 with C3v to D3h. The molecule shows a flapping motion as changing between different point groups. The total energy and RMS gradient diagrams below show the variation while the molecule was converted.


(D) Vibrations
The normal NH3 C3v and dummy NH3 D3h molecules have been optimised by B3LYP/6-31G method, now use them to predict the IR spectrums.
IR spectrum for NH3 C3v

| Frequency/cm-1 | Intensity | Form of Vibration | Symmetry C3V Point Group |
|---|---|---|---|
| 452.302 | 599.472 |  |
A1 |
| 1680.47 | 41.7256 |  |
E |
| 1680.47 | 41.7245 |  |
E |
| 3635.71 | 0.0688 |  |
A1 |
| 3775.76 | 7.0892 |  |
E |
| 3775.76 | 7.0884 |  |
E |
IR spectrum for NH3 D3h

| Frequency/cm-1 | Intensity | Form of Vibration | Symmetry D3h Point Group |
|---|---|---|---|
| -318.051 | 849.113 |  |
A2’’ |
| 1640.59 | 55.9828 |  |
E' |
| 1640.59 | 55.9805 |  |
E' |
| 3635.71 | 0 |  |
A1’ |
| 3854.27 | 19.5951 |  |
E' |
| 3854.27 | 19.5963 |  |
E' |
References (for section 1.1 - 1.6)
1. "Steric contributions to the solid-state structures of bis(phosphine) derivatives of molybdenum carbonyl. X-ray structural studies of cis-Mo(CO)4[PPh3-nMen]2 (n = 0, 1, 2)", F. Albert Cotton, Donald J. Darensbourg, Simonetta Klein, and Brian W. S. Kolthammer, Inorg. Chem., 21, (1982), p294-299
2. "Intramolecular hydrogen bonding and cation &pi-interactions affecting cis to trans isomerization in tungsten hexacarbonyl derivatives of 2-pyridyldiphenylphosphane and triphenylphosphane", Leeni Hirsivaara, Matti Haukka and Jouni Pursiainen, Inorg. Chem. Comm., 3 (2000) p508-510
3. "The crystal and molecular structure of trans-tetracarbonylbis(triphenyl-phosphine)chromium(0) in a new unit cell: Is the trans conformer more stable than the cis?", Dennis W. Bennett, Tasneem A. Siddiquee, Daniel T. Haworth, Shariff E. Kabir and Farzana Camellia. J. Chem. Cryst., 34 (6) (2004) p353-359
4. L. HirsiÍaara et al.r, Inorg. Chem. Comm. 3 (2000) 508–510
Mini Project - Ab initio study of Dibromodiammine Complex of Platinum (II)
Abstract
The cis-Pt(NH3)2Br2 and trans-Pt(NH3)2Br2 are calculated by using ab initio quantum method in GaussView, starting with the B3LYP-LANL2MB basis set to higher basis set of B3LYP-LANL2DZ, and further calculation to a single point optimisation with MP2-LANL2DZ. The computational outputs are than used to predict the bond distances, bond angles, vibrational frequencies and molecular orbitals. These data are also compared and discussed with reference computational data and reference empirical data.
Introduction

Optimisation Procedure
Setting of 1st optimisation
Job Type: Optimisation
Method: Ground State-DFT-Default Spin-B3LYP
Basis Set: LanL2MB
Charge: 0 Spin: Singlet
Setting of 2nd optimisation
Job Type: Optimisation
Method: Ground State-DFT-Default Spin-B3LYP
Basis Set: LanL2DZ
Charge: 0 Spin: Singlet
Setting of 3rd optimisation
Job Type: Energy
Method: Ground State-MP2-Default Spin (All electrons include)
Basis Set: LanL2DZ
Charge: 0 Spin: Singlet
Summary of Each Optimisation
(A) cis-Pt(NH3)2F2
1st optimisation (http://hdl.handle.net/10042/to-1818)
Jmol for optimised cis-isomer:
Summary

2nd optimisation (http://hdl.handle.net/10042/to-1825)
Jmol for 2nd optimised cis-isomer:
Summary

From the view file option, we can see that the molecule has been optimised successfully:

IR (http://hdl.handle.net/10042/to-1827)
Although this is not the final optimisation, a frequency calculation was carried out in order to test whether the optimisation was calculated fully. As there are no negative peak detect, the optimisation with B2LYP/LANL2DZ was successful and can be used for further calculation.

3rd optimisation (http://hdl.handle.net/10042/to-1826 )
Summary

(B) cis-Pt(NH3)2Br2
1st optimisation (http://hdl.handle.net/10042/to-1793)
Jmol for 1st optimised cis-isomer:
Summary

2nd optimisation (http://hdl.handle.net/10042/to-1794)
Jmol for 2nd optimised cis-isomer
Summary

IR (http://hdl.handle.net/10042/to-1797)
As explained in cis-Pt(NH3)2F2, there is no negative frequency shown, so the optimisation result with B3LYP/LANL2DZ can be used for further optimisation.

3rd optimisation (http://hdl.handle.net/10042/to-1804)
Please see result and discussion section for the following
IR of 3rd optimisation (http://hdl.handle.net/10042/to-1828)
MOs (http://hdl.handle.net/10042/to-1854)
(C) trans-Pt(NH3)2F2
1st optimisation (job ID 13208)(https://www.ch.ic.ac.uk/wiki/index.php/Image:Trans_f_b3lyp_LANL2MB_opt_result.out)
Jmol for optimised trans-isomer:
Summary
![]()
2nd optimisation (http://hdl.handle.net/10042/to-1819)
Jmol for 2nd optimised trans-isomer:
Summary
![]()
IR (http://hdl.handle.net/10042/to-1822)
As explained in cis-Pt(NH3)2F2, there is no negative frequency shown, so the optimisation result with B3LYP/LANL2DZ can be used for further optimisation.
![]()
3rd optimisation (http://hdl.handle.net/10042/to-1824)
Jmol for 3rd optimised trans-isomer:
Summary
![]()
(D) trans-Pt(NH3)2Br2
1st optimisation: (job ID 13305) (https://www.ch.ic.ac.uk/wiki/index.php/Image:Trans_br_b3lyp_LANL2MB_opt_result.out)
Jmol for 1st optimised trans-isomer:
Summary
![]()
2nd optimisation (http://hdl.handle.net/10042/to-1805)
Jmol for 2nd optimised trans-isomer:
Summary
![]()
IR (http://hdl.handle.net/10042/to-1806)
As explained in cis-Pt(NH3)2F2, there is no negative frequency shown, so the optimisation result with B3LYP/LANL2DZ can be used for further optimisation.
![]()
3rd optimisation (http://hdl.handle.net/10042/to-1823)
Please see result and discussion section for the following
IR of 3rd optimisation (job ID 13424) (https://www.ch.ic.ac.uk/wiki/index.php/Image:Trans_br_MP2_LANL2DZ_freq_result.out)
MOs calculation (http://hdl.handle.net/10042/to-1855 )
Result and Discussion
- Only cis-Pt(NH3)2Br2 and trans-Pt(NH3)2Br2 are analysed due to more experimental data provided and also time limitation.
(1)Calculation
![]()
Geometry optimisation is the most essential part in the theoretical treatment of IR analysis for heavy TM complexes. The transition metal involves in this calculation, platinum, is from the third row of TM, and so, the optimisations were carrying out all way from optimisation with B3LYZ/LANL2MB, to optimisation with B3LYZ/LANL2DZ, and finished with energy calculation with MP2/LANL2DZ (since there is no change in basis set, only energy calculation was carried out rather than energy and optimisation together). The RMS gradient of all four optimisations are lower than 0.0001 and very close to zero, which means the optimisations were carried out successfully.
As shown above in these optimisation summary tables, for both isomers, the optimised total energy decrease for approximately 1.5 a.u. (3938.25kJ/mol) after the second optimisation, which means the structures were optimised to a lower energy position on PES graph.
The total energies of trans-isomer are lower than cis-isomer for both calculations (-87.18kJ/mol and -69.44kJ/mol). The trans-isomer is sterically less hindered than cis-isomer, the big electronegative Br atoms are located 179.99° to each other, whereas in cis-isomer, they are only 94.06° degrees apart, this also applies to the attached NH3 groups. The calculation times of LANL2DZ were not longer than LANL2MB as expected, this is due to the optimisation with LANL2DZ were carried out using the result (log.) file from LANL2MB basis set, which means the molecule has already been optimised to a lower energy conformation and the second optimisation is just improve the first one, rather than starting from the beginning.
(2)Bond Distances and Bond Angles
- The most optimised set (MP2/LANL2DZ) of cis- and trans-isomer are used here for comparing results with the reference data, which obtained from optimisation with calculation method, ie. RHF/LANL2DZ.
cis-Pt(NH3)2Br2
The optimised structure of cis-Pt(NH3)2Br2 in Jmol:
The labelled and numbered cis-Pt(NH3)2Br2 structure:


trans-Pt(NH3)2Br2
The optimised structure of trans-Pt(NH3)2Br2 in Jmol:
The labelled and numbered trans-Pt(NH3)2Br2 structure:
![]()
![]()
(3)IR analysis

cis-Pt(NH3)2Br2


trans-Pt(NH3)2Br2
![]()
![]()

MOs analysis of trans-Pt(NH3)2Br2
| Molecular Orbital | Fragment orbital Surface (computational) | Assign |
|---|---|---|
| LUMO+1 | There are two very large electron densities above and below the plane of the trans-isomer, this may caused by strong overlap between the in-phase p-orbitals and d-orbitals. | |
| LUMO | This is the LUMO orbital. The sign has changed from negative in HOMO orbital (-0.345 a.u.) to a positive energy sign (0.066a.u.) here , the energy gap is much bigger compare to others, the addition of electron to this orbital will result a destabilisation of the molecule. And hence this molecule is having its most optimised molecular orbital structure, as all the occupied orbitals are having negative energy (ie. stabilisation). There are two very large electron densities cloud around the ammine groups, this may caused by the lone pairs on nitrogen. | |
| HOMO | This is the HOMO orbital. It has a negative energy, which means it will be favoured to add electron since this can stabilised the structure. This graphical representation shows the d-orbital of Pt and p-orbitals of these two bromines. There is no electron density shown on both ammine group, which means these groups are in its anti-bonding state. | |
| HOMO-1 | Same as the HOMO orbital, the d-orbital of Pt and p-orbitals of these two bromines, but they are all in the orthogonal position of HOMO’s, and so they have a much smaller energy difference (0.013 a.u.) compare to the others. |
References
1. G. Bombieri, G. Bruno, Inorg. Chim. Acta 86 (1984) 121.
2. C.H. Perry, D.P. Athans, E.F. Young, Spectrachim. Acta 23A(1967) 1137.
3. N. Kazuo, J.M. Paul’, F. Junnosuke, A.C. Robert, T.B.
4. George, Inorg. Chem. 4 (1965) 36.
5. L.Zhang, H.Wei, Y.Zhang, Z.Guo, L. Zhu,Spectrachim. Acta A58 (2002) 217-223
6. D.M. Root, C.R. Landis, T. Cleveland, J. Am. Chem. Soc. 115 (1993) 4201.
7. A. Sunderman, W.W. Schoeller, J. Am. Chem. Soc. 22(2000) 4729.
8. C.H. Martin, M.C. Zerner, Inorg. Electron. Struct. Spectrosc.1 (1999) 555.
9. N. Frohlich, C. Frenking, Phys. Organomet. Chem. 2(1999) 173.
10. G. Frenking, U. Pidun, J. Chem. Soc. Dalton Trans. 10(1997) 1653.
11. Z. Lin, M.B. Hall, Inorg. Chem. 31 (1992) 2791.
12. J. Li, G. Schreckenbach, T. Ziegler, J. Am. Chem. Soc. 117 (1995) 486.
13. S. Mecking, L.K. Johnson, L. Wang, M. Brookhart, P.S. White, J. Am. Chem. Soc. 120 (1998) 888.
14. M.D. Su, S.Y. Chu, Inorg. Chem. 37 (1998) 3400.
15. Density functional theory, http://en.wikipedia.org/wiki/Density_functional_theory
16. Møller-Plesset perturbation theory, http://en.wikipedia.org/wiki/M%C3%B8ller-Plesset_perturbation_theory
17. Ab initio quantum chemistry methods, http://en.wikipedia.org/wiki/Ab_initio_quantum_chemistry_methods