Rep:Mod:civi710
Computational Physical lab - Module 3
Introduction
As one of the choices available to us in computational labs, this physical module aims to give us some confidence in manipulating data which is obtained through Gaussian using different methods. The module is divided into two parts, during the first part different transition structures are studied for the Cope rearrangement, and in the second part the knowledge and practice gained is applied to explore Diels-Alder cycloadditions. A previous understanding of potential energy surfaces is very helpful in order to analyse different transition structures.
The Cope Rearrangement
This cope rearrangement is an example of a [3,3]-sigmatropic shift - see mechanism in fig.1 below.

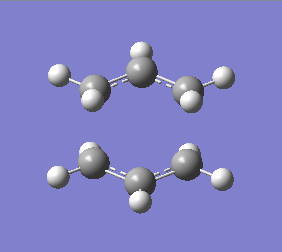
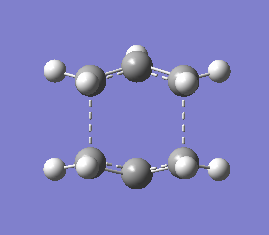
Here, we will be using this reaction as an example to gain some familiarity with the different methods available on Gaussian and also the different 'types' of information which can be obtained from them. For example, we know that the energies of the molecules change with temperature, this information is accessible via a frequency analysis which allows us to monitor these energy change through thermochemistry studies.
Each time the calculations executed are run on Gaussian 5.0 as well as submitted to the Gaussian software on the SCAN server, the link to Dscpace is provided for each calculation.
Optimising the Reactants and Products
(a) 1,5-hexadiene - anti linkage
A molecule of 1,5-hexadiene with an anti linkage was drawn using Gaussview and before optimising the molecule it was 'cleaned' through a function which is part of Gaussian. The structure was then optimised using the Hartree Fock method and the 3-21G basis set, the percentage memory was limited to 250MB.
Below is a table summarising the optimisation, Energy= -231.69260237 a.u.
| File Name | hexadiene_anti |
| File Type | .chk |
| Calculation Type | FOTP |
| Calculation Method | RHF |
| Basis Set | 3-21G |
| Charge | 0 |
| Spin | Singlet |
| Total Energy | -231.69260237 a.u. |
| RMS Gradient Norm | 0.00000783 |
| Imaginary Freq | |
| Dipole Moment | 0.2022 Debye |
| Point Group | C2 |
Below is a section of the output file which proves that the optimisation run was successful. Each time the output file is checked to ensure that the results obtained are correct.
         Item               Value     Threshold  Converged?
 Maximum Force            0.000015     0.000450     YES
 RMS     Force            0.000005     0.000300     YES
 Maximum Displacement     0.000926     0.001800     YES
 RMS     Displacement     0.000301     0.001200     YES
 Predicted change in Energy=-7.943931D-09
 Optimization completed.
    -- Stationary point found.
The molecule has C2 symmetry, this was determined using the symmetrize function.
Link to optimisation: http://hdl.handle.net/10042/21023
(b) 1,5-hexadiene - gauche linkage
A second structure of the same molecule was drawn, this time with a gauche linkage. It is expected that gauche conformers have higher energies than antiperiplanar structures although both have staggered arrangements. Without computational methods it is quite difficult to determine which of these two conformers is preferred; factors such as orbital interactions and Van der Waals forces have to be taken into account. The same method and basis set were employed for the optimisation (HF/3-21G).
The energy value below was read off the summary table of the optimisation. E = -231.69153035 a.u.
Below is a section of the output file showing that the calculations converged and thus that the optimisation was successful.
Item               Value     Threshold  Converged?
 Maximum Force            0.000016     0.000450     YES
 RMS     Force            0.000004     0.000300     YES
 Maximum Displacement     0.000493     0.001800     YES
 RMS     Displacement     0.000165     0.001200     YES
 Predicted change in Energy=-4.384205D-09
 Optimization completed.
    -- Stationary point found.
We can see in the fig. 4 below that the optimised molecule has symmetry, it belongs to the C2 point group.
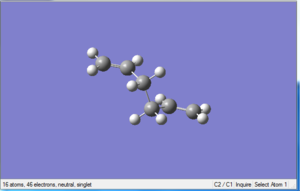
Link to optimisation: http://hdl.handle.net/10042/21047
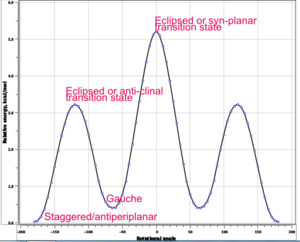
(c) & (d) & (e) As we can see in fig. 5 below, the anti-periplanar conformation is expected to be the one with the lowest energy. After drawing the same molecule with an anti-periplanar conformation and optimising it using the same method and basis set as before, the energy obtained was E= -231.69253529 a.u. Checking with appendix 1, the anti2 conformer was obtained.
An interesting fact to note is that when looking at appendix 1, we see that the gauche 3 conformer has the lowest energy (E = -231.69266 a.u.) even though this clearly goes against our 'chemistry intuition'. Furthermore it has been demonstrated that the anti-periplanar conformoer of butane is around 2 kcal/mol lower in energy than the gauche conformation. How can this be explained? This disagreement is possibly due to a computational error arising from the fact that a basis set with a low level theory is being used to run the optimisation.
The molecule belongs to the Ci point group.
Below is a section of the output file which shows that the optimisation was succesful, all the calculations converged.
         Item               Value     Threshold  Converged?
 Maximum Force            0.000028     0.000450     YES
 RMS     Force            0.000006     0.000300     YES
 Maximum Displacement     0.000393     0.001800     YES
 RMS     Displacement     0.000170     0.001200     YES
 Predicted change in Energy=-9.397448D-09
 Optimization completed.
    -- Stationary point found.
Link to otpimisation: http://hdl.handle.net/10042/21088
(f)
The same anti2 conformer drawn and optimised above was reoptimised using a higher level basis set: 6-31G(d) and this time choosing the DFT/B3LYP method instead of HF/3-21G. The value obtained for the energy was: E = -234.61171035 a.u.
This value is now lower than the value obtained when optiming the gauche conformer at the same level of theory. E = -234.61051916 a.u.
Below is a section of the output file showing that the optimisation of the anti-periplanar conformer was successful as the calculations converged. Below it we can see the excerpt of the optimisation file of the gauche conformer.
         Item               Value     Threshold  Converged?
 Maximum Force            0.000016     0.000450     YES
 RMS     Force            0.000007     0.000300     YES
 Maximum Displacement     0.000266     0.001800     YES
 RMS     Displacement     0.000090     0.001200     YES
 Predicted change in Energy=-1.682429D-08
 Optimization completed.
    -- Stationary point found.
         Item               Value     Threshold  Converged?
 Maximum Force            0.000015     0.000450     YES
 RMS     Force            0.000004     0.000300     YES
 Maximum Displacement     0.000797     0.001800     YES
 RMS     Displacement     0.000320     0.001200     YES
 Predicted change in Energy=-5.148953D-09
 Optimization completed.
    -- Stationary point found.
The molecule belongs to the same point group as the one optimised at a lower level of theory: Ci
Overall the geometries look the same. Even though a much lower energy was obtained using the higher level basis set, we cannot compare these energy values since they are extremely dependent on the quality of the basis sets used. However, we can compare the gauche and anti2 conformer which were optimised using the same basis set. As expected,the anti-periplanar conformer has a lower energy due to the ability of its allyl fragments to overlap with each other which is obviously not observed in the gauche conformer because there are no antiperiplanar relationaships present between these two fragments. Steric strain also has a significant contribution to the instability of the gauche conformer compared to anti2.
Link to optimisation of anti2 conformer: http://hdl.handle.net/10042/21091
Link to optimisation of gauche conformer: http://hdl.handle.net/10042/21407
(g)
A frequency analysis was also done on the anti2 conformer which was optimised using the B3LYP/6-31G(d) level of theory. This was done so that the resulting energy values could be compared with experimental ones and also to ensure that a minimum was reached.
Below is an excerpt of the file showing that the vibrational frequencies obtained are real and positive, this means that the job was successful in optimising the structure to a minimum.
Low frequencies ---   -9.4843    0.0001    0.0003    0.0005    3.7557   13.0233
 Low frequencies ---   74.2879   80.9995  121.4183
 Harmonic frequencies (cm**-1), IR intensities (KM/Mole), Raman scattering
 activities (A**4/AMU), depolarization ratios for plane and unpolarized
 incident light, reduced masses (AMU), force constants (mDyne/A),
 and normal coordinates:
                     1                      2                      3
                     A                      A                      A
 Frequencies --    74.2879                80.9995               121.4116
 Red. masses --     2.7381                 2.6590                 2.4735
 Frc consts  --     0.0089                 0.0103                 0.0215
 IR Inten    --     0.0199                 0.1169                 0.0000
In figure 6 below we can see the infra-red spretrum.
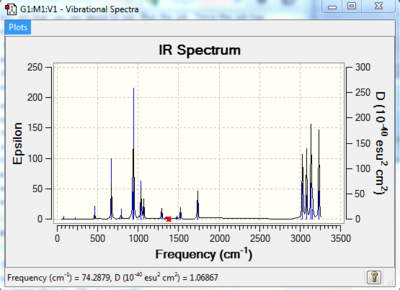
The carbon carbon double bonds are stretching symmetrically and asymmetrically giving rise to a medium intense peak at 1734.31 cm-1 which is a slightly higher frequency than the typical C=C stretches. The other peaks observed are due to CH and CC stretching and bending modes.
From this frequency analysis it was also possible to obtain the information listed below:
E (Eelec+ZPE)= -234.469204 a.u. This is the potential energy at 0K including the zero-point vibrational energy. E (E+Evib+Erot+Etrans)= -234.461857 a.u. this is energy at 298.15K, p=1 atm which comprises translational, rotational and vibrational energy modes. E= -234.460913 a.u. This is the sum of electronic and thermal enthalpies and includes a correction term (H= E+RT) which becomes increasingly important when studying dissociation reactions. E= -234.500777 a.u. This is the sum of electronic and thermal free energies which includes the entropy contribution to the Gibbs free energy (G = H - TS).
Link to frequency analysis: http://hdl.handle.net/10042/21093
Optimising the Chair and Boat Transition Structures
The cope rearrangement reaction has been the subject of many discussions but it is widely accepted that the reaction proceeds in a concerted manner via a either a boat or chair transition structure. In the following section, these transition structures are optimised using different techniques. The intrinsic reaction coordinate will also be run and activation energies calculated.
Chair Transition Structure - Using the HF/3-21G method & TSBerny
Firstly a CH2CHCH2 allyl fragment was drawn and optimised using the HF/3-21G method and basis set.
Link to allyl fragment optimisation: http://hdl.handle.net/10042/21098
This optimised fragment was then copied and both fragments were positioned so that the terminal atoms were approximately 2.2Å away from each other. This transition state was then optimised using, as before, the HF/3-21G method and basis set but this time a frequency job was also run; in this case we are optimising a transition state (TS Berny) instead of optimising to a minimum like it had been done previously. This can be quite hard to achieve depending on the accurateness of the transition state geometry. The calculation needs to be aware of the location of the reaction coordinate, after deciding to calculate the force constants once (option available on Gaussian), the words 'Opt=NoEigen' were written in the additional keywords box - this prevents the job from crashing if more than one imaginary frequency is present which is likely to occur if the transition state structure isn't precise enough.
Link to optimisation and frequency analysis: http://hdl.handle.net/10042/21112
The calculation was succesful, below is a section of the file showing the frequencies obtained. We can see that an imaginary frequency of -817.9224 cm-1 was obtained which is very close to the value listed in appendix 1 of 818cm-1. The vibrations could be animated, this is particularly useful as it gives some insight into what is happening to the molecule and also allows us to check that the Cope rearrangement is in fact taking place. The fact that a negative frequency was obtained means that the transition state was reached, the gradient is not positive on both sides i.e. it's going down again and a maximum was reached (the TS).
Low frequencies --- -817.9224   -1.2942   -1.1179   -0.0008   -0.0005   -0.0004
 Low frequencies ---    0.9918  209.5446  396.0060
 ******    1 imaginary frequencies (negative Signs) ******
 Harmonic frequencies (cm**-1), IR intensities (KM/Mole), Raman scattering
 activities (A**4/AMU), depolarization ratios for plane and unpolarized
 incident light, reduced masses (AMU), force constants (mDyne/A),
 and normal coordinates:
                     1                      2                      3
                     A                      A                      A
 Frequencies --  -817.9224               209.5446               396.0060
 Red. masses --     9.8856                 2.2190                 6.7657
 Frc consts  --     3.8965                 0.0574                 0.6251
 IR Inten    --     5.8577                 1.5757                 0.0000
 Raman Activ --     0.0000                 0.0000                16.9164
 Depolar (P) --     0.3084                 0.7026                 0.3839
 Depolar (U) --     0.4714                 0.8253                 0.5548
  Atom  AN      X      Y      Z        X      Y      Z        X      Y      Z
     1   6     0.43  -0.07  -0.06     0.04   0.03   0.15     0.33   0.00  -0.04
     2   1    -0.20  -0.05   0.05     0.16   0.20   0.15     0.16  -0.02  -0.01
     3   1     0.00   0.02   0.04     0.02  -0.05   0.33     0.25   0.01  -0.02
     4   6    -0.43  -0.07   0.06    -0.04   0.03  -0.15     0.33   0.00  -0.04
     5   1     0.00   0.02  -0.04    -0.02  -0.05  -0.33     0.25  -0.01  -0.02
     6   1     0.20  -0.05  -0.05    -0.16   0.20  -0.15     0.16   0.02  -0.01
     7   6     0.00   0.13   0.00     0.00  -0.06   0.00     0.20   0.00  -0.01
     8   1     0.00   0.05   0.00     0.00  -0.21   0.00     0.26   0.00  -0.04
     9   6    -0.43  -0.07   0.06    -0.04   0.03  -0.15    -0.33   0.00   0.04
    10   1     0.20  -0.05  -0.05    -0.16   0.20  -0.15    -0.16  -0.02   0.01
    11   1     0.00   0.02  -0.04    -0.02  -0.05  -0.33    -0.25   0.01   0.02
    12   6     0.43  -0.07  -0.06     0.04   0.03   0.15    -0.33   0.00   0.04
    13   1     0.00   0.02   0.04     0.02  -0.05   0.33    -0.25  -0.01   0.02
    14   1    -0.20  -0.05   0.05     0.16   0.20   0.15    -0.16   0.02   0.01
    15   6     0.00   0.13   0.00     0.00  -0.06   0.00    -0.20   0.00   0.01
    16   1     0.00   0.05   0.00     0.00  -0.21   0.00    -0.26   0.00   0.04
Chair Transition Structure - Freezing the Reaction Coordinate
The initially optimised CH2CHCH2 allyl fragment was copied and again positioned so that the terminal ends were 2.2Å apart. This time the frozen coordinate mehtod was used to optimise the transition state, this was done through the redundant coordinate editor function in Gaussian. Two of the terminal carbons which form/break a bond were frozen, the same was done for the opposite terminal fragments. The optimisation was set-up as if it were a minimum and the job run.
Link to optimisation using frozen coordinate method: http://hdl.handle.net/10042/21118
Below is a section of the output file showing that the optimisation was successful as the calculations did converge.
         Item               Value     Threshold  Converged?
 Maximum Force            0.000020     0.000450     YES
 RMS     Force            0.000003     0.000300     YES
 Maximum Displacement     0.000540     0.001800     YES
 RMS     Displacement     0.000111     0.001200     YES
 Predicted change in Energy=-1.087772D-07
 Optimization completed.
    -- Stationary point found.
The structure obtained is very similar to the one obtained when optimising to a transition state instead of a minimum except that some distances were fixed.
The fixed distances of the two terminal fragments were optimised using the redundant coordinate function again. The force constants were not calculated even though an optimisation to a transition state was being executed, instead a normal Hessian matrix was computed.
Link to optimisation: http://hdl.handle.net/10042/21123
Bond forming/bond breaking bond lengths: 2.01922Å The bond lengths obtained are very close to 2.2Å which was the initial guess distance.
Below is a section of the output file showing that the optimisation was successful, this is a confirmation that the value obtained for bond distances is good in terms of optimising transition structures.
         Item               Value     Threshold  Converged?
 Maximum Force            0.000047     0.000450     YES
 RMS     Force            0.000012     0.000300     YES
 Maximum Displacement     0.001193     0.001800     YES
 RMS     Displacement     0.000264     0.001200     YES
 Predicted change in Energy=-5.224668D-07
 Optimization completed.
    -- Stationary point found.
The main point to note is that the distance between the ends of the allyl fragements that were to bond to each other decreases to approximately 2.02Å, which was also the case when optimisting a transition state using TS Berny, just before.
Boat Transition Structure - Using the QST2 method
After optimising the chair transition structure, the boat transition state was optimised using a different method: QST2 The reactant and product of the reaction were specified and Gaussian will incorporate both structures when calculating the transition state which is located somewhere between the two.
The optimised anti-periplanar conformer of the reactant (1,5-hexadiene) was copied so that two molecules of the same conformation could be numbered. This was done in such a way that the product corresponded to the reactant molecule and showed that none of the atoms have moved during the rearrangement although bonds have changed.
The geometries of both molecules were then modified so that they resembled the boat transition state more closely. Firstly the dihedral angle of the central carbon atoms was changed to 0o and then the inside C-C-C angle was reduced to 100o. The same was done for the product molecule.
An optimisation and frequency were executed (HF/3-21G), choosing to optimise to a transition state QST2. The result was a molecule with a boat transition structure, the frequencies were checked as well as the vibrations. One negative frequency value was obtained (-839.85cm-1) which means that the transition structure was successfully reached.
The distance between the two bonding ends of the transition state is 2.13921Å. For some reason, sometimes Gaussview does not 'show' a bond which can be quite misleading if one is not aware of the fact that Guassian has a pre-defined value of what a bond 'is' and if this value is exceeded it simply does not recongize that there is a connection between those two atoms.
The forces converged, therefore the optimisation was successful.
         Item               Value     Threshold  Converged?
 Maximum Force            0.000230     0.000450     YES
 RMS     Force            0.000048     0.000300     YES
 Maximum Displacement     0.001740     0.001800     YES
 RMS     Displacement     0.000486     0.001200     YES
 Predicted change in Energy=-5.364413D-07
 Optimization completed.
    -- Stationary point found.
Low frequencies --- -839.8532   -6.3590   -4.7641   -0.0007   -0.0005   -0.0005
 Low frequencies ---    5.5354  155.5034  382.4986
 ******    1 imaginary frequencies (negative Signs) ******
Link to optimisation and frequency: http://hdl.handle.net/10042/21163
Overall this method is quite useful but only if the reactants and products are close to transition structure. For this to be possible there has to be some previous knowledge of what the transition state looks like.
The Intrinsic Reaction Coordinate Method
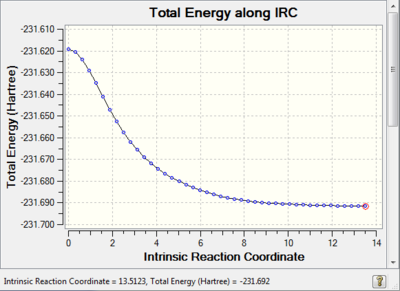
The Intrinsic reaction coordinate method was chosen to run on one of the previously optimised chair transition structures. This method allows for a more in depth understanding of the potential energy surface of a molecule, the minimum energy path can be monitored from the transition state to the local minimum.
The reaction coordinate is symmetrical in this case therefore it is only necessary to compute it in one direction, the forward direction was chosen. The force constants were calculated at every step along the IRC to ensure that the minimum geometry is reached, this 'setting' was chosen because a frequency analysis had already been run previously. This method works by creating several points in the direction where the gradient of the energy surface is the steepest, the number of points was increased from 6 to 50.
 |
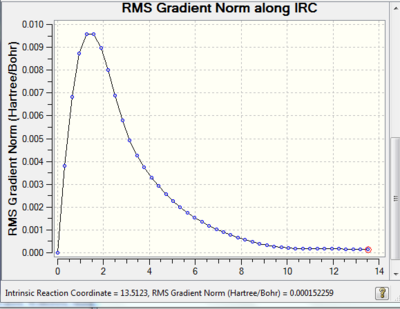 |
Link to IRC: http://hdl.handle.net/10042/21196
Reoptimising the Transition Structures at a Higher Level Theory
Firstly the boat transition structure was reoptimised using the 6-31G(d)/B3LYP method and then a frequency analysis was also carried out.
Below is a section of the output file showing that the calculations converged.
         Item               Value     Threshold  Converged?
 Maximum Force            0.000016     0.000450     YES
 RMS     Force            0.000003     0.000300     YES
 Maximum Displacement     0.000621     0.001800     YES
 RMS     Displacement     0.000148     0.001200     YES
 Predicted change in Energy=-7.012915D-09
 Optimization completed.
    -- Stationary point found.
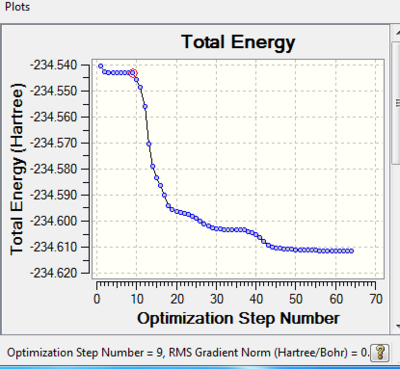
Link to reoptimisation: http://hdl.handle.net/10042/21198
Look at structure of molecule at step 9 where gradient norm is: 0.000167597 The reason why the minimum is located at step 9 might be because the algorithm of the program is not good enough i.e. the minimum was reached but the program continued to run calculations and the molecule 'moving' around different energy levels.
E= -234.543 a.u.
Link to Boat transition state frequency analysis: http://hdl.handle.net/10042/21202
Sum of electronic and zero-point Energies=           -234.402317
Sum of electronic and thermal Energies=              -234.395988
Sum of electronic and thermal Enthalpies=            -234.395044
Sum of electronic and thermal Free Energies=         -234.431721
The chair transition state was reoptimised using the B3LYP/6-31G(d) method, the calculations converged:
         Item               Value     Threshold  Converged?
 Maximum Force            0.000022     0.000450     YES
 RMS     Force            0.000004     0.000300     YES
 Maximum Displacement     0.001377     0.001800     YES
 RMS     Displacement     0.000234     0.001200     YES
 Predicted change in Energy=-2.172270D-08
 Optimization completed.
    -- Stationary point found.
Look at strcuture of molecule at step 3 where gradient norm is: 0.00615415
E= -234.56105277 a.u.
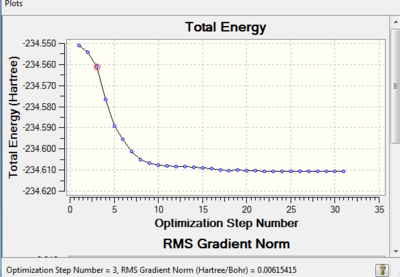
Link to reoptimation: http://hdl.handle.net/10042/21204
Link to frequency analysis: http://hdl.handle.net/10042/21209
Sum of electronic and zero-point Energies=           -234.419868
Sum of electronic and thermal Energies=              -234.413564
Sum of electronic and thermal Enthalpies=            -234.412620
Sum of electronic and thermal Free Energies=         -234.449144
For both the chair and boat transition structure the values of the activation energies computed at 0K are relatively close to the experiemental values listes in appendix 2 (this can be calculated from the termochemistry data above). [2][3]
The Diels-Alder Cycloaddition
In this second part of the module, the transition states through which the Diels-Alder reactions are likely to proceed are analysed. This pericyclic reaction is a 4n+2 cycloadditon, and therefore goes via a Huckel transition state.[4] The pi orbitals of an electron rich diene interact with the pi orbitals of an electron poor dienophile thus generating two new sigma bonds between the two species. Firstly the reaction of cis-butadiene and ethene will be studied, followed by the reaction of maleic anhydride with cyclohexadiene.
Cis-Butadiene
Before being able to study the molecular orbitals the structures have to be optimised. The semi-empirical AM1 method was used as cis-butadiene and ethene are relatively simple molecules.
Link to optimisation of cis-butadiene: https://spectradspace.lib.imperial.ac.uk:8443/dspace/handle/10042/21288
The optimisation was successful, we can see below in the excerpt of the output file that the forces converged.
         Item               Value     Threshold  Converged?
 Maximum Force            0.000097     0.000450     YES
 RMS     Force            0.000027     0.000300     YES
 Maximum Displacement     0.000224     0.001800     YES
 RMS     Displacement     0.000107     0.001200     YES
 Predicted change in Energy=-4.173053D-08
 Optimization completed.
    -- Stationary point found.
| File Name | log_64781 |
| File Type | .log |
| Calculation Type | FOTP |
| Calculation Method | RPM6 |
| Basis Set | ZDO |
| Charge | 0 |
| Spin | Singlet |
| E(RPM6) | 0.04691424 a.u. |
| RMS Gradient Norm | 0.00003588 a.u. |
| Imaginary Freq | |
| Dipole Moment | 0.0.732 Debye |
| Point Group | C1 |
Link to optimisation of ethene: http://hdl.handle.net/10042/21422
Below is a section of the output file showing that this optimisation was also successful.
         Item               Value     Threshold  Converged?
 Maximum Force            0.000162     0.000450     YES
 RMS     Force            0.000049     0.000300     YES
 Maximum Displacement     0.000414     0.001800     YES
 RMS     Displacement     0.000220     0.001200     YES
 Predicted change in Energy=-3.787265D-08
 Optimization completed.
    -- Stationary point found.
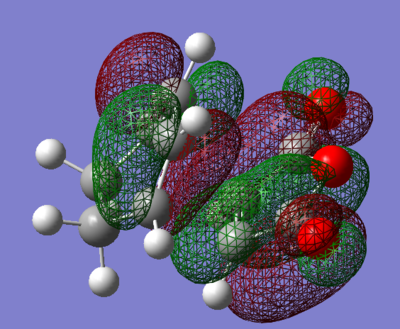
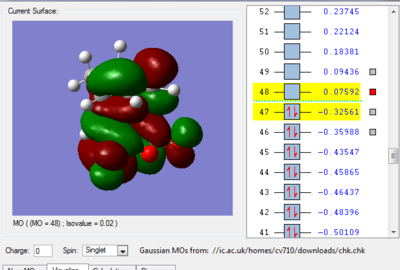
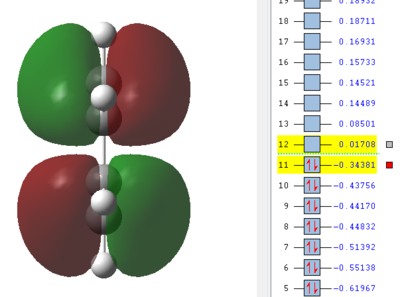
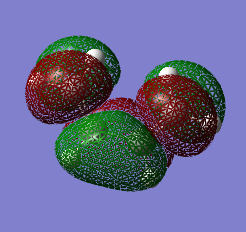
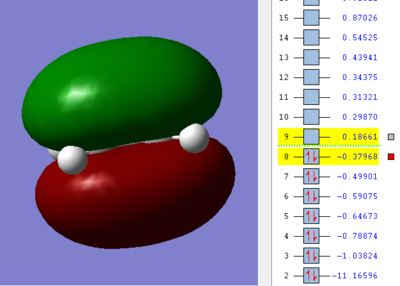
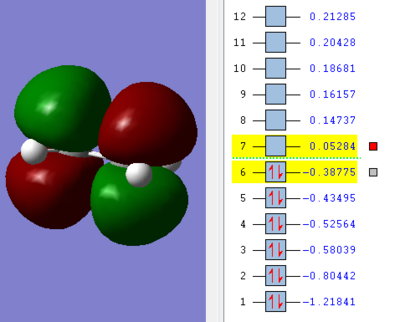
We can see by looking at any of the images below that there is a plane going through the centre of the bond between the two carbon atoms of cis-butadiene and ethene. The HOMO of cis-butadiene and the LUMO of ethene are both anti-symmetric with respect to this plane - a good way of seeing this is to look at the colours of the 'clouds' representing electron density, e.g. the HOMO of cis-butadiene has alternanting red and green which is why we say it's anti-symmetric. On the other hand, the LUMO of cis-butadiene and the HOMO of ethene are both symmetric, there is a mirror plane going through the centre of the molecule. We know that for a reaction to be allowed, the HOMO of one reactant has to be able to interact with the LUMO of the other reactant and this is only possible when both have the same symmetry so that overlap density is can be achieved. According to this rule, the HOMO of cis-butadiene and LUMO of ethene should be able to overlap significantly. This is what we will see in the next section as this reaction is allowed.
 |
 |
 |
 |
Cis-butadiene and ethene
The transition structure of the reaction between cis-butadiene and ethene resembles that of an envelope. The structure is such that the overlap is maximal between the pi orbitals of the two reactants. The envelope transition state was constructed spacing the terminal carbon atoms of the diene and dienophile by 2.2Å. The molecule was then optimised using the HF/3-21G method and basis set and choosing to compute the force constants always.
Looking at step 8 of the optimisation, the point after which the energy curve stabilised, E= -231.603 a.u.
The RMS gradient was equal to 4.3e-08
Link to optimisation and frequency: https://spectradspace.lib.imperial.ac.uk:8443/dspace/handle/10042/21317
Below is a section of the output file showing that the calculations converged and therefore the job was succesfully run.
 Item               Value     Threshold  Converged?
 Maximum Force            0.000000     0.000450     YES
 RMS     Force            0.000000     0.000300     YES
 Maximum Displacement     0.000008     0.001800     YES
 RMS     Displacement     0.000002     0.001200     YES
 Predicted change in Energy=-1.335131D-12
 Optimization completed.
    -- Stationary point found.
Additionally, the vibrations results were also checked to ensure that the correct transition structure had been obtained. An imaginary frequency of -818.37cm-1 indicates that the transition state was in fact reached.
Below is another section of the output file relating to the frequencies of the vibrations undergone by the transition state.
Low frequencies --- -818.3656   -0.2680   -0.2220   -0.0006   -0.0005    0.0004
 Low frequencies ---    0.1376  166.5351  284.3723
 ******    1 imaginary frequencies (negative Signs) ******
 Harmonic frequencies (cm**-1), IR intensities (KM/Mole), Raman scattering
 activities (A**4/AMU), depolarization ratios for plane and unpolarized
 incident light, reduced masses (AMU), force constants (mDyne/A),
 and normal coordinates:
                     1                      2                      3
                     A                      A                      A
 Frequencies --  -818.3656               166.5351               284.3723
 Red. masses --     7.0073                 2.0104                 4.4037
 Frc consts  --     2.7650                 0.0329                 0.2098
 IR Inten    --     9.3084                 0.6928                 1.1448
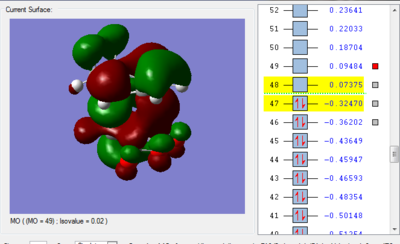
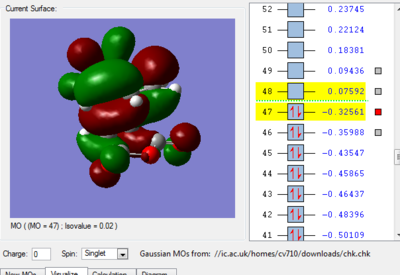
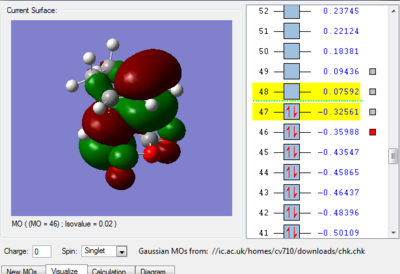
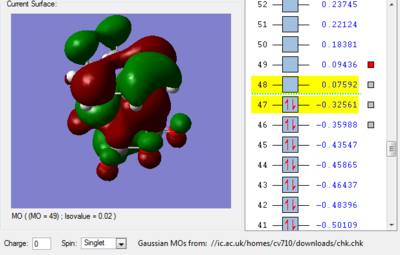
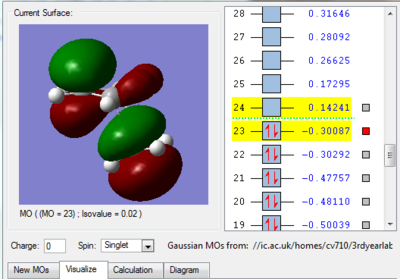
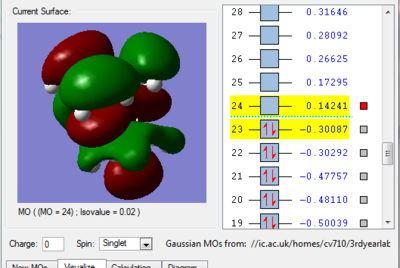
We can see in figures 5&6 below that both the HOMO and LUMO of the transition state are symmetric with respect to plane which passes through the carbon-carbon bonds. It is worth noticing that the HOMO of the strucuture is the second bonding MO which is highest in energy, generally the HOMO is the bonding MO which is highest in energy. The fact that the LUMO is highlighted in yellow (figure 7) means that it is a bonding MO. By looking at the LUMO we can also see that the clouds of electron density are more diffuse, i.e. there is a larger mixing of the fragments from the different starting materials. When analysing the HOMO closely we can still see 4 separate 'clouds', this suggests that level of theory used to optimise the transition state is not accurate enough to be able to observe a greater interaction (overlap) between these electron clouds. This overlap is what allows the formation of two new sigma bonds across the system.
The HOMO of the transition state is formed by the HOMO of ethene intercating with the LUMO of cis-butadiene. This can also be written as: Ψ(HOMO)= cΨ(HOMO ethene) - cΨ(LUMO cisbutadiene) The LUMO of the transition state is formed by the HOMO of ethene combining with the LUMO of cis-butadiene but in a different way, Ψ(LUMO)= cΨ(HOMO ethene) + cΨ(LUMO cisbutadiene)
 |
 |
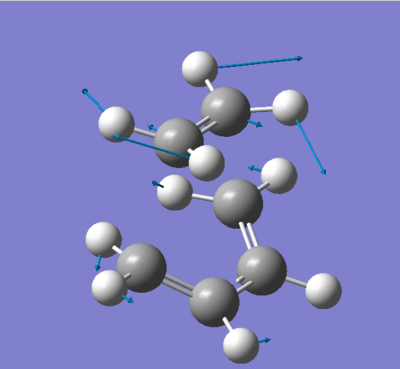
Below is a picture (figure 7) of the imaginary vibrational mode of the transition state showing the displacement vectors. The formation of the two new sigma bonds occurs in a concerted manner i.e. synchronous fashion. This result is as expected since it is a pericyclic reaction that is taking place. In the animation of the lowest positive frequency vibration mode we see that the diene and dienophile are twisting away from each other in a non-concerted manner, this is lengthening one of the distances where a sigma bond will be formed (between two carbon atoms) and contracting the other and vice-versa.
A series of bondlengths was also measured, these values were then compared to literature values.
[5]
C-C bond length of partly formed sigma bond in transition state: 2.21Å Diene single C-C bond length: 1.39Å In literature an sp3 CC bond is 1.53Å Diene double C=C bond length: 1.37Å According to literature an sp2 CC bond is 1.33Å Dienophile double C=C bond length: 1.38Å
Typically carbon carbon single bonds are longer than double bonds, this is what literature says. Even though in this case the double bonds are in fact shorter than single bonds, the difference is quite small because the pi orbital is delocalised over the entire molecule. This also explains why in figures 7&8 above the gaussview images display double bonds all along the diene. The distance between the carbon atoms where a bond is about to form can seem quite small if we remember that the Van der Waals radius for a carbon atom is equal to 1.7Å, we could be expecting a value which is twice that of the VdW radius. However we are aware of the presence of a bonding interaction between ethene and cis-butadiene which naturally shortens the bond distance.
Endo Transition State
In the final part of this physical module, the two different possible transition states resulting from the reaction of maleic anhydride and cyclohexadiene will be analysed in order to be able to rationalise the preference of one product over the other. It has been observed that the endo (kinetic) product is preferred over the exo (thermodynamic) product. It is the secondary orbital overlap interactions which lower the energy of the transition state.
Firstly the endo transition structure was drawn and optimised using the HF/3-21G level of theory. Then the two new sigma formed CC bonds between maleic anhydride and cyclohexadiene were frozen and the strucure reoptimised. Once this was done, the bonds were unfrozen and an optimisation to a transition state was done, as well a frequency analysis.
Link to endo TS optimisation: http://hdl.handle.net/10042/21425
Link to endo TS optimisation (freezing the coordinates): http://hdl.handle.net/10042/21428
Link to endo TS optimisation (unfreezing the coordinates) and computing the force constants always: http://hdl.handle.net/10042/21432
Below is a section of the output file showing that the final optimisation was succesful as all the calculations converged.
Item               Value     Threshold  Converged?
 Maximum Force            0.000006     0.000450     YES
 RMS     Force            0.000001     0.000300     YES
 Maximum Displacement     0.000082     0.001800     YES
 RMS     Displacement     0.000014     0.001200     YES
 Predicted change in Energy= 1.383333D-09
 Optimization completed.
    -- Stationary point found.
The force constants were computed always, so the frequency data is also available. This is necessary to ensure that a transition state structure has been reached and that we optimised to a maximum, not a minimum. A negative frequency was obtained successfully: -643.66cm-1, the transition state was reached. This can be seen in the excerpt of the output file below.
 Low frequencies --- -643.6610   -0.9247   -0.0108   -0.0038    0.0052    0.3383
 Low frequencies ---    0.4610   64.9849  142.0465
 ******    1 imaginary frequencies (negative Signs) ******
 Harmonic frequencies (cm**-1), IR intensities (KM/Mole), Raman scattering
 activities (A**4/AMU), depolarization ratios for plane and unpolarized
 incident light, reduced masses (AMU), force constants (mDyne/A),
 and normal coordinates:
                     1                      2                      3
                    A'                     A"                     A"
 Frequencies --  -643.6610                64.9849               142.0465
 Red. masses --     7.6025                 4.1869                 7.2201
 Frc consts  --     1.8558                 0.0104                 0.0858
 IR Inten    --    36.5067                 2.2395                 0.6313
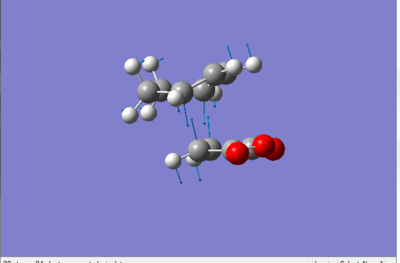
Below we can see some additional energy data.
Sum of electronic and zero-point Energies=           -605.414904
 Sum of electronic and thermal Energies=              -605.405478
 Sum of electronic and thermal Enthalpies=            -605.404534
 Sum of electronic and thermal Free Energies=         -605.450132
EXO Transition State
The exo transition structure was drawn and then optimised in the same way as the endo product. This is necessary in order to be able to compare both structures.
Below is a section of the output file showing that the optimisation was succesful.
 Item               Value     Threshold  Converged?
 Maximum Force            0.000065     0.000450     YES
 RMS     Force            0.000009     0.000300     YES
 Maximum Displacement     0.000986     0.001800     YES
 RMS     Displacement     0.000108     0.001200     YES
 Predicted change in Energy=-3.032550D-08
 Optimization completed.
    -- Stationary point found.
Link to optimisation HF/3-21G : http://hdl.handle.net/10042/21440
Link to exo TS optimisation (freezing coordinates): http://hdl.handle.net/10042/21442 This calculation was also succesful, see excerpt of output file for the final optimisation below.
Item               Value     Threshold  Converged?
 Maximum Force            0.000103     0.000450     YES
 RMS     Force            0.000019     0.000300     YES
 Maximum Displacement     0.001105     0.001800     YES
 RMS     Displacement     0.000253     0.001200     YES
 Predicted change in Energy=-9.639584D-08
 Optimization completed.
    -- Stationary point found.
Link to exo TS optimisation unfreezing the coordinates): http://hdl.handle.net/10042/21453
A frequency analysis was also run, to ensure a transition state was reached. A negative frequency with a value of -647.69cm-1 was obtained, which means that the exo transition state was successfully located.
Link to exo TS frequency analysis: http://hdl.handle.net/10042/21462
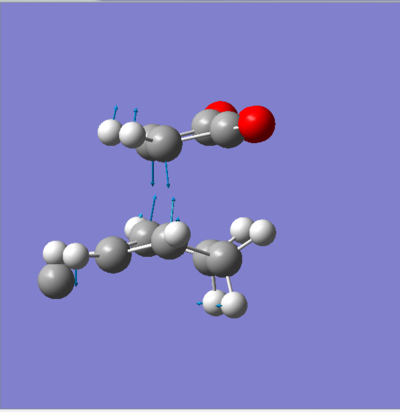
Additional energy data can be seen below.
Sum of electronic and zero-point Energies=           -605.408143
 Sum of electronic and thermal Energies=              -605.398682
 Sum of electronic and thermal Enthalpies=            -605.397738
 Sum of electronic and thermal Free Energies=         -605.443697
Comparison between the two transition structures
The energy of the endo transition state is equal to -605.61 a.u.
The energy of the exo transition state is equal to -605.60 a.u.
Even though the energy difference is small in a.u., we can see that the endo is the most stable (lower in energy) transition state.
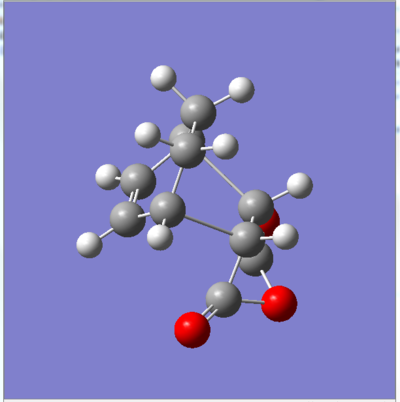
If we look at a simple drawing of both strucures (see figures & below), we see that the the exo transition state is more strained than the endo transition state, this is due to some clashing between the CH2-CH2 fragment of cyclohexadiene and the maleic anhydride (not observed in the endo transition state as it approches it from the bottom face i.e. where there is not a CH2-CH2 fragment). This steric strain reduces its ability to overlap with the orbitals of cyclohexadiene significantly. Moreover, the endo product which approaches the cyclohexadiene from below is oriented in a much better way (and thus its p orbitals too) than the exo transition state which approches it from the top. This is also a factor contributing the higher energy value observed for the exo transition state.
 |
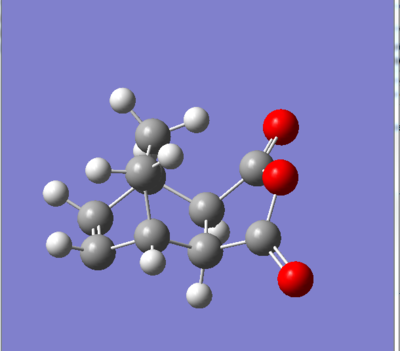 |
Note that the images above ( figures 11&12) are prior to any optimisation which is why there are some atypical angles and distances between some atoms.
Forming CC bond distance exo: 2.26Å
Forming CC bond distance endo: 2.2Å
Cyclohexadiene CC bond length exo: 1.52Å Cyclohexadiene CC bond length endo: 1.52Å
Cyclohexadiene C=C bond length exo: 1.37Å Cyclohexadiene C=C bond length endo:1.37Å
Maleic anhydride CC bond length exo: 1.40Å Maleic anhydride CC bond length endo: 1.48Å
Maleic anhydride C=C bond length exo: 1.37Å Maleic anhydride C=C bond length endo:1.37Å
Distance between CH2-CH2 fragment and C=O-O-C=O unit (exo): 2.92Å Distance between HC=CH fragmen and C=O-O-C=O unit (endo): 2.76Å
As we can see the difference in bond lengths between the endo and exo structures is minimal when optimising at this level theory.
The HOMO of the endo product (-0.32443) is slightly lower in energy than that of the exo (-0.32325). However it is the fact that in the case of the endo transition structure, the orbitals of the C=O-O-C=O fragment of maleic anhydride are able to interact with the orbitals of the HC=CH fragment of cyclohexadiene, whereas in the exo transition state this does not occur. This gives rise to a so-called secondary orbital overlap which further stabilises the endo transition state thereby favouring it.[6][7]
It is important to remember that some minimal effects are neglected when running these calculations to optimise transitions states. However the data obtained is sufficiently accurate to be able to analyse the different properties constituting the transition structures.
Conclusion
It is clear from the many different exercises done throughout this module that there are many physical properties of a molecule which can be studied using computational methods. The analysis of transition states is practically impossible without computational methods, as they have very short lifetimes. Depending on the level of theory used when performing optimisations, different bond lengths are obtained - it is preferable to use a a better method and basis set than the HF/3-21G when trying to study these. By viewing the molecular orbitals of the relevant molecules it is also possible to rationalise their relative stabilities and hence reactivities. The exo product is thermodynamically more stable[8]even though we have just seen that the endo transition state is more stable, it's the kinetic product.
Carolina Vieira CID:00641284
References
- ↑ http://vle.imperial.ac.uk/webct/urw/tp3997053221021.lc3997053201021/cobaltMainFrame.dowebct?appforward=urw/tp3997053221021.lc3997053201021/startFrameSet.dowebct%3Fforward=studentCourseView.dowebct%26lcid=
- ↑ https://wiki.ch.ic.ac.uk/wiki/index.php?title=Mod:phys3
- ↑ http://www.ucl.ac.uk/~uccaati/Energy.html
- ↑ http://vle.imperial.ac.uk/webct/urw/tp3997053221021.lc3997053201021/cobaltMainFrame.dowebct?appforward=urw/tp3997053221021.lc3997053201021/startFrameSet.dowebct%3Fforward=studentCourseView.dowebct%26lcid=3997053201021
- ↑ Lide, D., Tetrahedron, 1962, 17, pp.125-134
- ↑ http://pubs.acs.org/doi/abs/10.1021/jo00384a016
- ↑ http://144.206.159.178/ft/986/42675/13901662.pdf
- ↑ Frontier Orbitals and Organic Chemical Reactions, Ian Flemming


