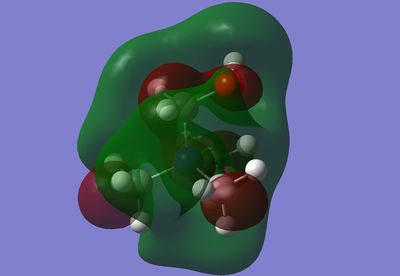
Rep:Mod:christian
BH3
Optimisation of BH3 in log file
        Item               Value     Threshold  Converged?
Maximum Force            0.000385     0.000450     YES
RMS     Force            0.000149     0.000300     YES
Maximum Displacement     0.001112     0.001800     YES
RMS     Displacement     0.000501     0.001200     YES
Predicted change in Energy=-3.603572D-07
Optimization completed.
   -- Stationary point found.
https://wiki.ch.ic.ac.uk/wiki/images/a/a6/BH3_OPTIMISATION2.LOG
Gaussian Calculation Summary
BH3 Optimisation2
File Name BH3 Optimisation2
File Type .chk
Calculation Type FOPT
Calculation Method RB3LYP
Basis Set 3-21G
Charge 0
Spin: Singlet
Total Energy: -26.46226416a.u.
RMS Gradient Norm: 0.00017104a.u.
Imaginary Freq
Dipole Moment 0.0012Debye
Point Group
This was reoptimised using 6-31g dp basis set
        Item               Value     Threshold  Converged?
Maximum Force            0.000006     0.000450     YES
RMS     Force            0.000004     0.000300     YES
Maximum Displacement     0.000023     0.001800     YES
RMS     Displacement     0.000015     0.001200     YES
Predicted change in Energy=-2.008855D-10
Optimization completed.
   -- Stationary point found.
https://wiki.ch.ic.ac.uk/wiki/index.php?title=File:BH3OPTIMISATION4.LOG
File Name    BH3optimisation4
File Type    .chk
Calculation Type    FOPT
Calculation Method    RB3LYP
Basis Set    6-31G(D,P)
Charge    0
Spin    Singlet
Total Energy    -26.61532363     a.u.
RMS Gradient Norm    0.00000296     a.u.
Imaginary Freq
Dipole Moment    0.0000     Debye
Point Group
BBr3 and TlBr3
BBr3 optimisation input (normal basis set for boron and PP for bromine)
https://wiki.ch.ic.ac.uk/wiki/images/5/53/BBr3Optimisation%28PPadjusted%29.txt
Finished Optimisation of BBr3 in log file
https://wiki.ch.ic.ac.uk/wiki/images/6/68/BBr3Optimisationlog.log
        Item               Value     Threshold  Converged?
Maximum Force            0.000010     0.000450     YES
RMS     Force            0.000006     0.000300     YES
Maximum Displacement     0.000048     0.001800     YES
RMS     Displacement     0.000030     0.001200     YES
Predicted change in Energy=-5.939934D-10
Optimization completed.
   -- Stationary point found.
BBr3 Optimisation2
File Name    BBr3Optimisationlog
File Type    .log
Calculation Type    FOPT
Calculation Method    RB3LYP
Basis Set    Gen
Charge    0
Spin    Singlet
E(RB3LYP)    -64.43645277     a.u.
RMS Gradient Norm    0.00000488     a.u.
Imaginary Freq
Dipole Moment    0.0000     Debye
Point Group    C2V
For BBr3, the B-Br bond length is 1.93Å and the Br-B-Br bond angle is 120.0°
Optimisation of TlBr3 in log file
https://wiki.ch.ic.ac.uk/wiki/images/8/84/TlBr3Optimisation.log
        Item               Value     Threshold  Converged?
Maximum Force            0.000083     0.000450     YES
RMS     Force            0.000038     0.000300     YES
Maximum Displacement     0.000381     0.001800     YES
RMS     Displacement     0.000341     0.001200     YES
Predicted change in Energy=-2.080795D-08
Optimization completed.
   -- Stationary point found.
TlBr3Optimisation
File Name    TlBr3Optimisation
File Type    .log
Calculation Type    FOPT
Calculation Method    RB3LYP
Basis Set    LANL2DZ
Charge    0
Spin    Singlet
E(RB3LYP)    -91.21812836     a.u.
RMS Gradient Norm    0.00001781     a.u.
Imaginary Freq
Dipole Moment    0.0039     Debye
Point Group    C2V
    Item               Value     Threshold  Converged?
 Maximum Force            0.000083     0.000450     YES
 RMS     Force            0.000038     0.000300     YES
 Maximum Displacement     0.000381     0.001800     YES
 RMS     Displacement     0.000341     0.001200     YES
 Predicted change in Energy=-2.080795D-08
 Optimization completed.
    -- Stationary point found.
| Bond | B-H | B-Br | Tl-Br |
|---|---|---|---|
| Length(Å) | 1.19 | 1.93 | 2.65 |
The Tl-Br bond length compares well to the literature value[1] of 2.618Å.
The B-H bond is the shortest out of the three, whereas Tl-Br is the longest. Firstly, when we consider a central boron atom, changing the ligand from H to Br increases the bond length significantly because the bromine's orbitals have significantly less overlap with boron's orbitals due to being significantly more diffuse than hydrogen's orbitals. This decrease of orbital overlap leads to a weaker force of attraction between the boron and bromine and results in longer bonds. Aside from hydrogen and bromine having the similarity of typically forming one bond each, the presence of many shells (in particular d sub-shells) in bromine allows more bonds to be formed. Similarly, due to it's size, bromine can more easily exist independently as a negative ion where as the hydrogen cation normally must bond to something else, e.g. forming the hyrdonium cation.
This effect is increased when the boron atom is replaced with a thallium atom. Boron and thallium both have 3 electrons in the valence shell, however, due to having far more shells the orbitals of thallium are significantly more diffuse than those of boron, which leads to a less efficient orbital overlap. This leads to weaker and longer bonds between thallium and bromine. Thallium, unlike boron, readily exists in a +1 oxidation state, due to the inert pair effect. This means that it is less energetically favourable for 2 p orbitals and 1 s orbital to hybridize into sp2 orbitals, thus thallium forming only one bond is quite common.
In gaussview, sometimes a bond is not displayed between two atoms and this is typically when a molecule is in a higher energy state than that of the ground state. A bond is a force of attraction between two atoms and is usually caused by the sharing or donation/acceptance of electrons. Once a bond has been formed, the two atoms should be at the bottom of a potential energy well; or at least this is the case for the equilibrium position of the bond. The crucial fact here is that the two atoms must be in a lower energy state once the bond has formed compared to when they were separate, though it must be considered that there is a distance consideration here.
When there is no bond drawn between two atoms in gaussview it is because the two atoms are not close enough a minimum potential energy to be reached, therefore a bond cannot be formed.
Frequency Analysis
BH3 Frequency Analysis
BH3 Frequency calculation in log file
https://wiki.ch.ic.ac.uk/wiki/images/f/f2/CHRISTIAN_BH3_FREQ.LOG
Low frequencies ---  -23.8414   -0.0004    0.0005    0.0006   38.9661   58.0144
Low frequencies --- 1146.0719 1204.3434 1205.4943
The low frequencies had too wide a range, i.e. -23 to 58cm-1, so the frequency was recalculated using the BH3 molecule optimised using the 6-31g basis set.
https://wiki.ch.ic.ac.uk/wiki/index.php?title=File:CHRIS_BH3_FREQ3.LOG
Low frequencies ---   -0.9458   -0.8709   -0.0054    5.6809   11.6924   11.7306
Low frequencies --- 1162.9961 1213.1825 1213.1852
| no. | Form of Vibration | frequency | Intensity | Symmetry D3h Point Group |
|---|---|---|---|---|
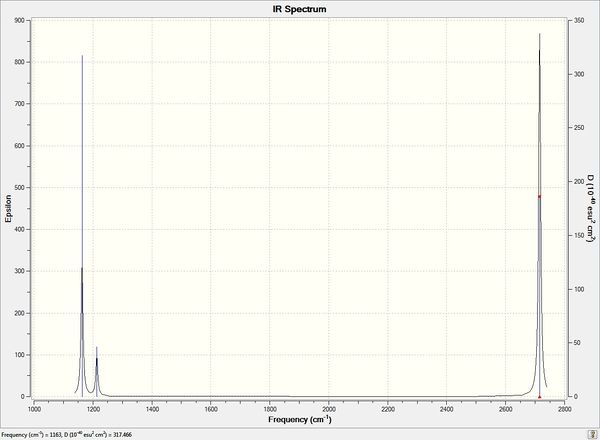
| 01 | All 3 hydrogens bend up and down in phase symmetrically | 1163 | 93 | cell |
| 02 | 2 hydrogens bend in plane of molecule symmetrically | 1213 | 14 | cell |
| 03 | 1 hydrogen bends in plane of molecule, remaining BH2 fragment rocks in plane in response | 1213 | 14 | cell |
| 04 | 3 B-H bonds stretch symmetrically and in phase | 2582 | 0.0000 | cell |
| 05 | 2 B-H bonds stretch anti-symmetrically | 2715 | 126 | cell |
| 06 | 2 B-H bonds stretch symmetrically, remaining bond stretches out of phase | 2715 | 126 | cell |
Spectrum of BH3
TlBr3 Frequency Analysis
TlBr3 frequency calculations
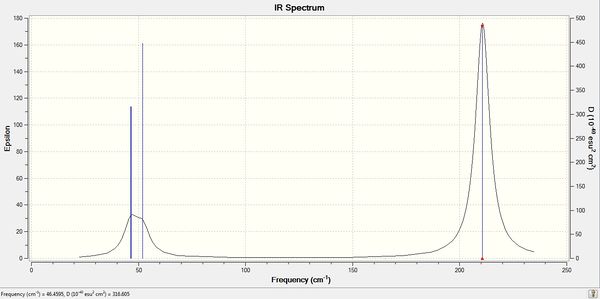
Low frequencies --- -2.7241 0.0000 0.0001 0.0001 1.2608 4.1461
Low frequencies --- 46.4595 46.5459 52.0275
Lowest 'Real' frequency is 46cm-1
| no. | Form of Vibration | frequency | Intensity | Symmetry D3h Point Group |
|---|---|---|---|---|
| 01 |  |
46 | 4 | cell |
| 02 |  |
47 | 4 | cell |
| 03 |  |
52 | 6 | cell |
| 04 | 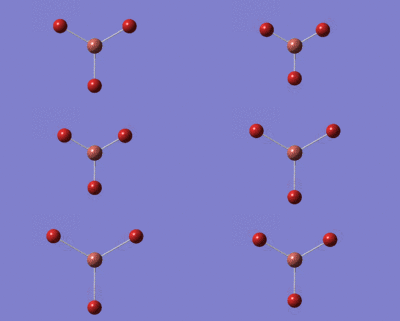 |
165 | 0.0000 | cell |
| 05 | 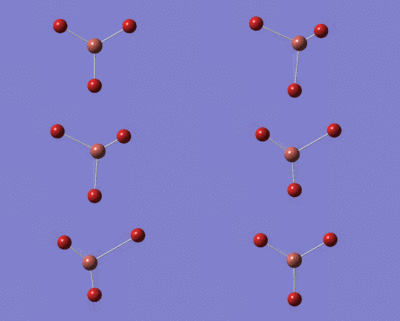 |
211 | 25 | cell |
| 06 | 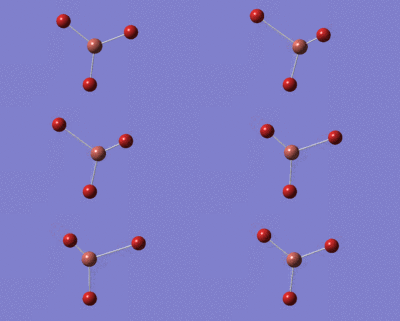 |
211 | 25 | cell |
TlBr3 IR spectrum
| heading | vibrational mode | BH3 Frequency/cm-1 | TlBr3 Frequency/cm-1 |
|---|---|---|---|
| 1 |  |
1163 | 52 |
| 2 |  |
1213 | 46 |
| 3 |  |
1213 | 47 |
| 4 |  |
2582 | 165 |
| 5 |  |
2715 | 211 |
| 6 |  |
2715 | 211 |
The BH3 vibration frequencies are significantly higher than those for TlBr3 because, as explained earlier, the B-H bonds are significantly stronger than Tl-Br bonds. The greater force between the two atoms lead to a greater force constant/ stiffer spring constant which in turn leads to higher vibration frequencies.
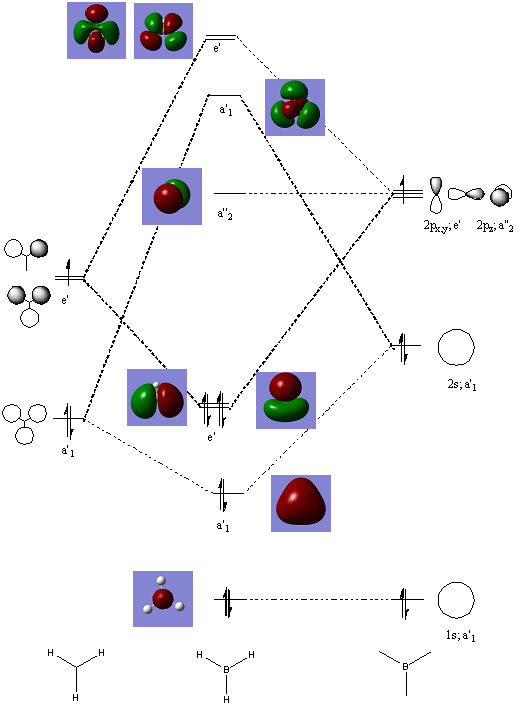
Calculation of BH3 MOs were run, link to log file below
A qualative MO diagram was drawn, using the calculated MOs to annotate the diagram
The NH3 molecule was optimised and then the vibration frequencies were calculated.
        Item               Value     Threshold  Converged?
Maximum Force            0.000001     0.000015     YES
RMS     Force            0.000001     0.000010     YES
Maximum Displacement     0.000012     0.000060     YES
RMS     Displacement     0.000006     0.000040     YES
Predicted change in Energy=-1.701277D-11
Optimization completed.
   -- Stationary point found.
The following low frequencies were calculated
Low frequencies ---   -3.5844   -3.5810   -2.5705    0.0017    0.0065    0.0226
Low frequencies --- 1142.2409 1810.8223 1810.8223
Link to calculations below
https://wiki.ch.ic.ac.uk/wiki/images/7/78/NH3_OPTIM_FREQ.LOG
It was not possible to proceed to the MO calculations for a reason not apparent, so the ammonia molecule was optimised and the vibrational frequencies were calculated separately.
        Item               Value     Threshold  Converged?
Maximum Force            0.000005     0.000450     YES
RMS     Force            0.000003     0.000300     YES
Maximum Displacement     0.000010     0.001800     YES
RMS     Displacement     0.000007     0.001200     YES
Predicted change in Energy=-7.830783D-11
Optimization completed.
   -- Stationary point found.
https://wiki.ch.ic.ac.uk/wiki/index.php?title=File:NH3_OPTIM6.LOG
The low frequencies had too broad a range
Low frequencies ---  -11.4825  -11.4467   -0.0029    0.0246    0.1420   25.6342
Low frequencies --- 1089.6621 1694.1736 1694.1740
https://wiki.ch.ic.ac.uk/wiki/index.php?title=File:NH3_FREQ6.LOG
The MO and population was then calculated
https://wiki.ch.ic.ac.uk/wiki/images/9/9a/NH3_MO6.LOG
A charge distribution was calculated based on the MO calculations. There is a range of +1.0 to -1.0.
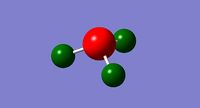
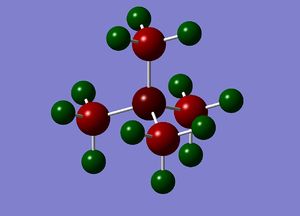
When the specific charge distributions are shown on the molecule, each hydrogen has +0.375, whereas the nitrogen atom has -1.125.
Ammonia Borane
An ammonia borane molecule was drawn and optimised.
        Item               Value     Threshold  Converged?
Maximum Force            0.000124     0.000450     YES
RMS     Force            0.000057     0.000300     YES
Maximum Displacement     0.000660     0.001800     YES
RMS     Displacement     0.000304     0.001200     YES
Predicted change in Energy=-1.649698D-07
Optimization completed.
   -- Stationary point found.
https://wiki.ch.ic.ac.uk/wiki/index.php?title=File:NH3BH3_optim_HPC.log
A frequency calculation was run to confirm if a minimum had been reached, however, this was not the case as the low frequencies were too wide.
Low frequencies ---   -0.0016   -0.0008   -0.0002   16.8452   22.0671   38.7327
Low frequencies ---  266.2390  632.2675  638.6931
The association energy was calculated by comparing the ground state energy of the ammonia borane with the reactants.
E(BH3) = -26.615 AU ±0.004 AU E(NH3) = -56.558 AU ±0.004 AU
E(NH3BH3) = -83.225 AU ±0.004 AU
ΔE = E(NH3BH3) - [E(NH3)+E(BH3)] ΔE = -0.052 AU ±0.004 AU
ΔE = -140 kJmol-1 ±10 kJmol-1
This doesn't compare well with the literature value of the B-N bond dissociation energy 377.9±8.7 kJmol-1 [1]
Ionic Liquids Mini Project
Comparison of Hetero atom Cations
Tetramethyl Ammonium
An optimisation calculation of the NMe4+ cation was run on the HPC.
        Item               Value     Threshold  Converged?
Maximum Force            0.000111     0.000450     YES
RMS     Force            0.000033     0.000300     YES
Maximum Displacement     0.001741     0.001800     YES
RMS     Displacement     0.000550     0.001200     YES
Predicted change in Energy=-3.652274D-08
Optimization completed.
   -- Stationary point found.
The calculations has been published on the D-spaceDOI:10042/23553
The vibrational frequencies were then calculated on the HPC to confirm that a minimum had been reached for the structure
Low frequencies ---  -18.7143  -10.5259   -0.0007    0.0006    0.0007    3.2561
Low frequencies ---  177.7320  279.5154  286.0492
The calculations has been published on the D-space DOI:10042/23570
Tetramethyl Phosphonium
An optimisation calculation of PMe4+ was run on the HPC.
        Item               Value     Threshold  Converged?
Maximum Force            0.000106     0.000450     YES
RMS     Force            0.000038     0.000300     YES
Maximum Displacement     0.001186     0.001800     YES
RMS     Displacement     0.000374     0.001200     YES
Predicted change in Energy=-2.179063D-07
Optimization completed.
   -- Stationary point found.
The log file was published on the D-space Template:Unicode
The vibrational frequencies were calculated to confirm that a minimum had been reached
Low frequencies ---  -15.1394  -10.3049   -0.0018    0.0017    0.0025    9.3722
Low frequencies ---  155.6271  188.3385  190.4590
The log file was published on the D-space DOI:10042/23577
Trimethyl sulphonium
An optimisation calculation was run of SMe3+ on the HPC
        Item               Value     Threshold  Converged?
Maximum Force            0.000186     0.000450     YES
RMS     Force            0.000057     0.000300     YES
Maximum Displacement     0.000725     0.001800     YES
RMS     Displacement     0.000253     0.001200     YES
Predicted change in Energy=-2.840826D-07
Optimization completed.
   -- Stationary point found.
The log file was published on the D space DOI:10042/23579
The vibrational frequencies were calculated to confirm that a minimum had been reached
Low frequencies ---  -31.2787  -20.5255   -0.0045   -0.0044   -0.0032   11.7313
Low frequencies ---  158.5671  191.4175  203.9477
The log file was published on the D-space DOI:10042/23580
Geometries
| [NMe4]+ | [PMe4]+ | [SMe3]+ | |
|---|---|---|---|
| Heteroatom geometry | Tetrahedral | Tetrahedral | Trigonal Pyramidal |
| Point Group | C1 | C1 | C1 |
| Heteroatom-Carbon bond length/Å | 1.51 | 1.82 | 1.82 |
| Methyl Carbon-Hydrogen bond length/Å | 1.09 | 1.09 | 1.09 |
| Bond Angle | 109.5 | 109.5 | 102.8 |
The S-C bond distances are longer than P-C bond with a mean difference of 0.006Å. This difference is not shown in the table as when the bond distances been rounded to an accuracy of 0.01Å.
It is expected that the P-C bond is longer than the N-C bond because there will be less efficient overlap between the C 2sp3 orbitals and P 3sp3 orbtials than between the C 2sp3 orbitals and N 2sp3 orbtials.
It is expected that the P-C and S-C bond lengths are similar as both phosphorous and sulphur are next to each other in the same period. One would expect the S-C bond to be shorter due to the greater difference in electronegativity instead of being an almost indistinguishable length. The level of accuracy of the calculations is probably what has caused the similarity of results here.
Molecular Orbitals
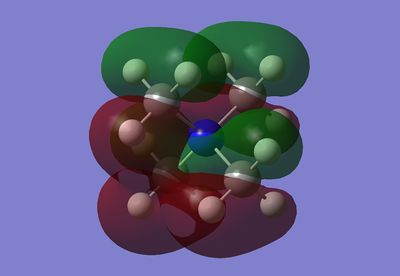
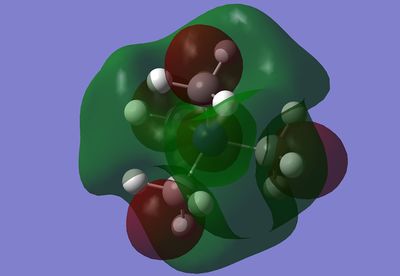
A population calculation was carried out on the optimised structure of tetramethyl ammonium and then the occupied molecular orbitals were visualised. Here is an in depth analysis of 5 of the non-core occupied molecular orbitals.
| Molecular Orbital | Visualised MO | Energy/a.u. |
|---|---|---|
| MO 6 | 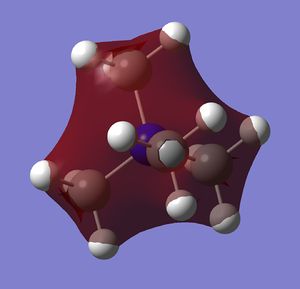 |
-1.19 |
| MO 10 |  |
-0.81 |
| MO 15 |  |
-0.62 |
| MO 17 | 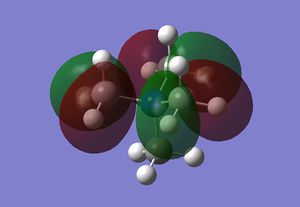 |
-0.58 |
| MO 21 | 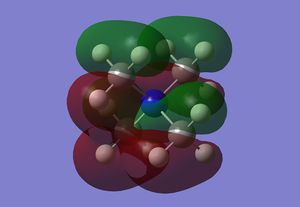 |
-0.58 |
MO 6 has all orbitals in phase with each other and therefore bonding. It has the lowest energy of the non-core MOs.
MO 10 has all the C-Hs in the methyl groups bonding together, this would be caused by the carbon p orbital bonding to a H3 bonding fragment. The other end of the carbon p orbital this then bonding to the nitrogen atom's s orbital. All the methyl groups are in phase together, there is most likely to be a stabilising through space interaction; however, this would be quite small.
MO 15 consists of diffuse interactions within and between the methyl groups. Within a methyl group (this is the case with all methyl groups) there are two interactions which are out of phase from each other, i.e. a C-H interaction and a C-H2 interaction. This is likely to be formed from a carbon p orbital bonding to a single hydrogen on one end and a bonded H2 fragment. The C-H2 end then has a stabilising through space interaction with another CH2 fragment on the adjacent methyl group. Similarily there is a stabilising though space interaction between the C-H interaction and the other C-H interactions. This interaction is between all C-H fragments and runs through the centre of the molecule, as opposed to the pairs of CH2s which sandwich the outside of the molecule.
MO17 involves a relatively localised interaction on three methyl groups. The interaction consists of a carbon p orbital bonding to an antibonding H2 fragment. The interaction within the methyl group is stabilising, however, the MOs on the adjacent methyl groups are in opposite phase, which is destabilising. The destablising interaction of this MO is less significant, however, due to the distance consideration.
MO 21 is the HOMO. This highly delocalised interaction has in each methyl a carbon p orbital bonding to a bonding H2 fragment and then also bonds to a H fragment. The C-H interactions then bond to a nitrogen P orbital. There are further through space interactions of two of the CH2 interactions and two of the C-H & C-N interactions stabilising each other. This forms a single in phase MO orbital that spreads over most of the molecule. The two remaining CH2 interactions are localised whereas there is a further interaction between the two other C-H & C-N interactions, which runs through the centre of the molecule.
Charge Distribution
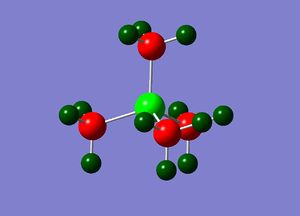
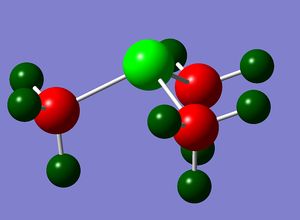
All the charge distribution diagrams were calculated with a -1 to +1 charge range.
The hydrogen atoms in all cations have a similar charge. The most striking result here is that the nitrogen atom has a negative charge, where as phosphorous and sulphur both have positive charges. If one were to draw out the Lewis structures of each cation, then it would be expected that the positive charge would be centred on the heteroatom, so the ammonium cation is definitely the anomaly here. This is most likely due to nitrogen being significantly more electronegative than phosphorous and sulphur, therefore electrons are going to be more strongly attracted to the nitrogen centre, causing it to have a negative charge in this molecule.
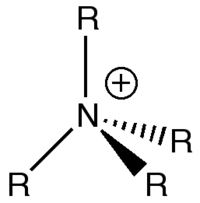
As said earlier, the ammonium cation is the only one of the three that deviates from the traditional cation structure. The positive charge on nitrogen, as shown above, is from representing that the atom has additional valence is an electron deficent situation. In reality, as discussed earlier, the positive charge in the ammonium cation is situated on the hydrogen atoms.
Influence of Functional groups
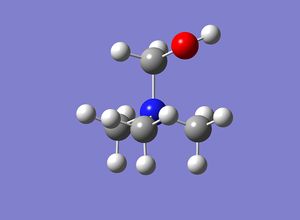
An optimisation and the vibrational frequencies of [N(CH3)3(CH2OH)]+ were calculated in a single operation on the HPC.
        Item               Value     Threshold  Converged?
Maximum Force            0.000006     0.000450     YES
RMS     Force            0.000002     0.000300     YES
Maximum Displacement     0.001046     0.001800     YES
RMS     Displacement     0.000245     0.001200     YES
Predicted change in Energy=-7.745341D-09
Optimization completed.
   -- Stationary point found.
The low frequencies were checked to make sure a minimum had been converged upon
Low frequencies ---  -11.8460    0.0013    0.0017    0.0020    8.0960   14.4009
Low frequencies ---  134.0747  214.2092  255.8457
The calculation files were published on the D-space
https://spectradspace.lib.imperial.ac.uk:8443/dspace/handle/10042/23833
An optimisation and the vibrational frequencies of [N(CH3)3(CH2CN)]+ were calculated in a single operation on the HPC.
        Item               Value     Threshold  Converged?
Maximum Force            0.000088     0.000450     YES
RMS     Force            0.000029     0.000300     YES
Maximum Displacement     0.000770     0.001800     YES
RMS     Displacement     0.000243     0.001200     YES
Predicted change in Energy=-1.560087D-07
Optimization completed.
   -- Stationary point found.
The low frequencies were check to ensure a minimum had been converged upon
Low frequencies ---   -3.0977   -0.0007    0.0004    0.0004    7.8988   18.3970
Low frequencies ---   92.6353  154.7494  214.6904
The calculation files were published on the D-space
https://spectradspace.lib.imperial.ac.uk:8443/dspace/handle/10042/23812

Charge Distribution
All the charge distribution diagrams were calculated with a -1 to +1 charge range.
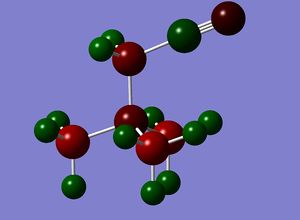
For the hydroxyl derivative, the oxygen atom has a charge of -0.725, whilst the hydrogen atom has a charge of 0.521.
For the nitrile derivative, the carbon atom has a charge of 0.209, whilst the nitrogen atom has a charge of -0.186.
The hydroxyl group is electron releasing, causing the nitrogen centre to have a more negative charge in comparison to the ammonium cation. This is caused via the carbon bonded to the hydroyl group having a relatively positive charge.
The nitrile group is electron withdrawing, causing the nitrogen centre to have a relatively positive charge in comparison to the ammonium cation. The carbon bonded to the nitrile group is also relatively more positive (not as much as in the hydroxyl case), which is caused as it is bonded to the positive carbon in the nitrile group.
HOMO and LUMO analysis
The tetramethyl ammonium HOMO has already been discussed.
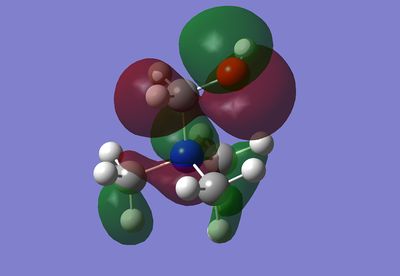
The HOMO of the hydroxyl ammonium derivative is quite localised. There appears to be the presence of a nitrogen p atomic orbital which interacts with carbon p orbital - h atom interaction on each methyl group, with the carbon atoms being the nodal points. The other side of the nitrogen orbital (different phase, with the nitrogen centre being the nodal point) has a destabilising interaction with another lobe that spreads over one of the carbon's hydrogen, part of the carbon and beneath the oxygen. The oxygen is at a nodal centre from most likely one of it's p orbitals. It is similar to the tetramethyl ammonium HOMO in that the central nitrogen and all the carbons are nodal points, however, this HOMO is significantly more localised and some hydrogens are not covered by the HOMO.
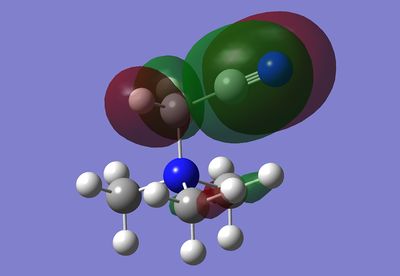
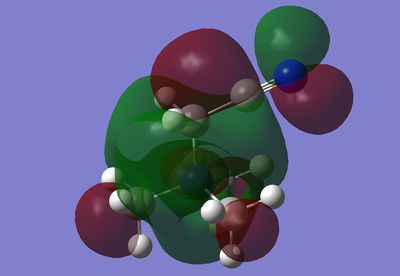
The HOMO of the nitrile derivative is significantly more localised and simple. There are two very small lobes on two methyl groups, focused between the carbon atom and a single hydrogen atom. There is a lobe in another phase on the other side of the carbon atom and the lobes on each methyl group (lobes are parallel to each other) are opposite to each other. This HOMO is different from the one of tetramethyl ammonium firstly because so little of the molecule is covered by the MO, even less so than the what the hydroxyl derivative's HOMO covers. Most notably, the central nitrogen is not covered, neither is one of the carbons or the majority of the hydrogen atoms.
The LUMO of tetramethyl ammonium involves lobes within the methyl groups, all of which lobes are in the same phase throughout the molecule. These methyl lobes are out of phase with an lobe between the methyl groups and the central nitrogen atom, of which a spherical lobe is also out of phase with this highly delocalised lobe, i.e. it is in the same phase as the methyl lobes.
The LUMO of the hydroxyl derivative is similar to the tetramethyl ammonium because there are three internal methyl lobes which then have a destabilising interaction with a highly delocalised lobe which spreads over the whole molecule. The key difference is that the lobe around the nitrogen here extends over the CH2OH carbon and onto the oxygen atom.
The LUMO of the nitrile derivative is again similar to the tetrametyl ammonium because of the internal methyl lobes which have a destabilizing interaction with a highly delocalised lobe that spreads over the molecule. Another similarity between this LUMO and the tetrametyl ammonium, and difference between the hydroxyl derivative, is that lobe that surrounds the nitrogen atom is highly localised and is completely engulfed by the highly delocalised lobe, with which it has a destablising interaction. Additionally, there is a lobe, out of phase with the large delocalised lobe, which extends over the cyanide carbon and the carbon adjacent to it. This lobe is out of phase with two lobes on the cyanide nitrogen, for which the nitrogen is the nodal point.
Further Thoughts
An ionic liquid usually has to have a dispersed charge as well as being asymmetric in order to prevent crystallisation at room temperatures. If the tetramethyl ammonium cation were to be used then the criteria for the anion is more selective; typically an anion that is highly polarisable would be best suited to [NMe4]+ for getting a liquid at room temperature.
Both the hydroxyl and nitrile derivatives have significantly less symmetry, making them better propositions as cations. The charge within the nitrile derivative is more evenly distributed, which would probably make it overall a more suitable cation in comparison to the hydroxyl derivative.
References
1. W.M. Hayens (ed). 'CRC Handbook of Chemistry and Physics'. 93rd Ed. Boca Raton. CRC Press. 2013

