Rep:Mod:chilong module2
By Chi Long Chan
Computational analysis allow us to predict many properties of molecules, from their structure's stability to their molecular orbitals and even spectroscopic data. Following the exponential growth in computing power over the recent decade, these predictions are becoming more and more accurate and are capable of predicting more complicated molecules.
These techniques allow chemists to studies the properties and even the reactivity of chemicals and reactions without actually carrying out the "wet chemistry" ( for example, synthetic laboratory work). This is particularly useful when the reaction is extremely toxic and hazardous or the reactants used are very rare and expensive, as the number of such reactions carried out should be kept to a minimum. Also, in cases where the molecule of interest is very unstable or very difficult to isolate, computer simulation might be a more suitable and cost-effective alternative than conventional laboratory experiments.
Many organic compounds have been analysis using computer simulation, either to correct or conform the existing understanding of their structures and bondings, these analysis can also be applied to inorganic compounds. In this exercise, the structure, molecular orbitals and vibrational spectra of BH3, TlBr3 and the cis and trans Mo complexes would be studied computationally using gausview. At the end of this session, is a mini-project on metal carbonyl complexes, looking at how the complex can effect the properties of the CO ligands.
BH3
Optimization
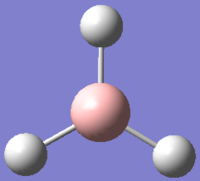
The structure of BH3 was drew in GaussView 5.0.9 and optimized using B3LYP as method for solving the Schrodinger equation and 3-21G was used as basis set to represent the orbitals of the atoms. This calculation carried out by Gaussian is based on the Born-Oppenheimer approximation; because of the massive differences in mass between electron and nucleus, the electronic motion is much faster than nuclear motion, and therefore allow the electronic and nuclear components of the molecular wavefunction to be calculated separately (however, the electronic wavefunction still depends on the position of the nuclei)[1].
During the calculation, the nuclear position was first fixed, then the corresponding Schrodinger equation for the electron density was solved. The positions of the nuclei was then solved, for each given geometry, the calculation for the electron density repeat until the geometry with the lowest energy (optimized geometry) was found. This basis set used (3-21G) allows us to optimized the structure very quickly as 3-21G has a very low accuracy. The choice of basis set hugely effect the outcome of the calculations as different basis set represent different assumptions used in the calculations, more accurate basis sets such as 6-31G gives results that are more representative but takes a considerably a lot more time as the complexity of the calculations would be drastically increase. In this part of the exercise, the 3-21G was sufficient as the molecule is very small and lack any conformational complexity.
Optimization results
The results of the optimization is summarized in table below:
| Properties | Results | Units |
|---|---|---|
| B-H Bond length | 1.19349 | A |
| H-B-H bond angle | 120.000 | o |
| File Type | .log | - |
| Calculation Type | FOPT | - |
| Calculation Method | RB3LYP | - |
| Basis Set | 3-21G | - |
| Charge | 0 | - |
| Spin | Singlet | - |
| E(RB3LYP) | -26.462(+/- 3.808 x 10⁻³) | a.u. |
| RMS Gradient Norm | 0.000(+/- 3.808 x 10⁻³) | a.u. |
| Dipole Moment | 0.00 (+/- 0.005) | Debye |
| Point Group | 3-21G | D3H |
| Job cpu time | 26.0 | seconds |

The result is in good agreement with our understanding of the molecule, with the B-H bonds being 120o apart, the preferred angle for a trigonal planar geometry. However, this is rarely obtained in reality as BH3 tends to form dimers or other forms of cluster due to their electrons deficient nature (hence an excellent Lewis acid).
Optimization Process
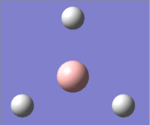
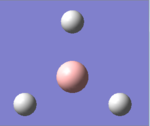
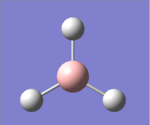
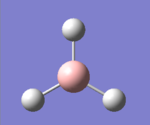
The B-H bonds were first manually changed to 1.5 A before optimization, as the structure optimized, the B-H bond lengths would changed and the energy level of the molecule at each changes would be obtained until the lowest energy is obtained. The structure transformation from 1.5A to 1.19A can be seen in gaussview:
 |
 |
 |
 |
|---|
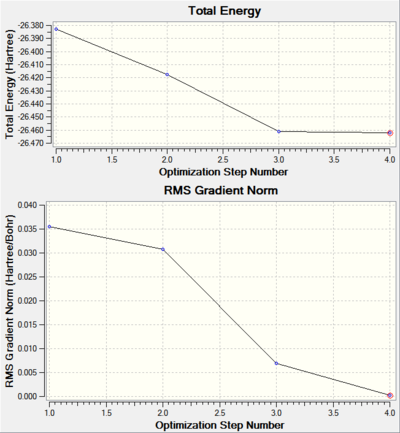
The calculation were done in 4 steps, as shown on the graphs above, for each step, the energy of the molecule decreases until the lowest energy geometry (step 4) was found. In step 1, no bond is shown between B and H, that is because gausview can only recognize a bond if the distance is within some predefined values.
Also shown above, alone with the total energy of the molecule is the graph showing the RMS (root mean square) gradient of the total energy graph. It is the first derivative of the energy of the molecule, when it reaches 0, the energy is at a local minimum. However, this is only a local minimum, does not necessarily represent the lowest minimum. For example, if there are two minima separated by a barrier, it will arrive at the one closest to it not the one with the lowest energy.
Vibrational analysis
The same basis set and method used for optimization are used to generate the vibrational spectrum as it is crucial to have the molecule to converged to the same minimum (hence the same structure and energy). The results are shown below:
| Properties | Results | Units |
|---|---|---|
| Calculation Type | FREQ | - |
| Calculation Method | RB3LYP | - |
| Basis Set | 3-21G | - |
| Charge | 0 | - |
| Spin | Singlet | - |
| E(RB3LYP) | -26.462(+/- 3.808 x 10⁻³) | a.u. |
| RMS Gradient Norm | 0.000(+/- 3.808 x 10⁻³) | a.u. |
| Dipole Moment | 0.00 (+/- 0.005) | Debye |
| Point Group | 3-21G | D3H |
| Job cpu time | 9.0 | seconds |
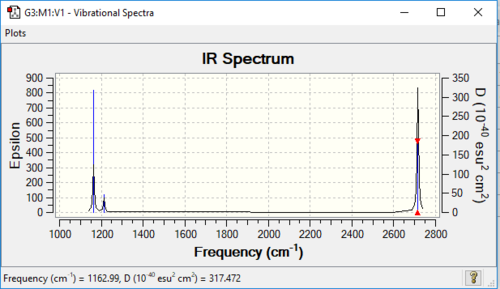
As can be seen from above table, the energy obtained from this calculation is the same as the one in the optimization, hence it is reasonable to say the two structures are the same. The spectrum generated and the data of vibrations are showed below:
| Vibration Mode | Vibration demo | Frequencies (cm-1) | Intensity | Symmetry | Movement |
|---|---|---|---|---|---|
| 1 | 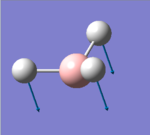 |
1146.03 | 92.6653 | A2" | the three hydrogens moves up and down while the boron rushing into the opposite direction, big change in dipole |
| 2 | 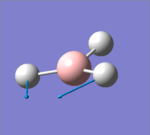 |
1204.86 | 12.3919 | E' | the two hydrogens moved closer to the same point while the other hydrogen moved back, small change in dipole |
| 3 | 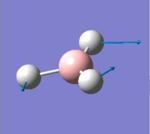 |
1204.86 | 12.3944 | E' | Three hydrogens moving in way that two of them maintain the same angle between them at all time (even when moving) while the last one constantly moving and changing its angle with the other two, small change in dipole |
| 4 | 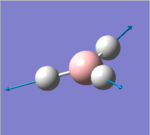 |
2591.65 | 0.0000 | A1' | All three B-H bonds stretch at the same time to the same extend, maintaining the centre of mass, angles between each B-H bonds, no overall change in dipole |
| 5 | 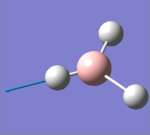 |
2730.07 | 103.8565 | E' | Two of the hydrogens stretch in the opposite direction to one another, if one is going away from the B, the other is coming toward. The third one does not invole in stretching, largest change in dipole |
| 6 | 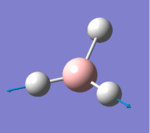 |
2730.07 | 103.8565 | E' | Two of the hydrogens stretch symmetrically while the other one goes in the opposite direction, largest change in dipole |
Vibration modes 2/3 and 5/6 are two pairs of degenerate vibrational energy levels (thus each pair showed up as 1 peak), while they might have different vibrational motions (2 is scissor bending while 3 is rocking), the energies associated with them are the same (hence the same vibrational frequencies). The intensity of the vibration depends on the resulting change in dipole moments, the larger the changes, the higher the intensity. Vibration mode 4 is symmetric bending, resulting in no overall dipole moment and therefore 0 intensity.
Molecular Orbitals
The structure and bondings in BH3 can be further studied using the predicted MOs generated by Gaussian energy (instead of optimization) calculation with "pop=full" as key words to switch on the MO analysis in the optimized structure.
A qualitatively predicted LCAOs (Linear Combination of Atomic Orbitals) MOs[2] diagram is generated. The energy levels are predicted based on the interactions between the orbitals. For example, a1' have three sigma bonding interactions with no node (where orbitals changes phase), whereas both 1e' have one node, but less sigma bonding interactions, therefore a1' is lower in energy than 1e'.
The resulting MOs from Gaussian calculation are compared with the qualitatively predicted LCAOs (Linear Combination of Atomic Orbitals) MOs[3] in the MO diagram below:
| MO diagram | Energy Levels |
|---|---|
 |
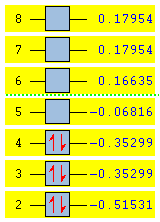 |
As shown in the diagram, the MOs generated computationally matches almost perfectly with the LCAOs MOs where the doubly degenerate bonding 1e' orbitals are the HOMOs (Highest Occupied Molecular Orbitals)and the non-bonding 1a2" is the LUMO (Lowest Occupied Molecular Orbital). This demonstrated the effectiveness of computational analysis on small molecules like BH3. The accuracy of this calculation would decrease however, as the complexity of the molecule increases. Larger molecules would likely to have more electrons, conformational flexibility and further orbitals interactions such as mixing, secondary orbitals overlap etc. Therefore more complicated calculation using better basis sets would be needed for large molecules, however, this would require longer calculation time and higher computing power.
NBO Analysis
This is done alone with MO calculations, opening the .log file using notepad instead of opening the checkpoint file using gausview like we did with Molecular Orbitals analysis.
Charge distributions
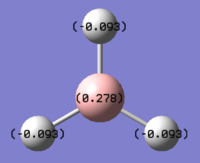
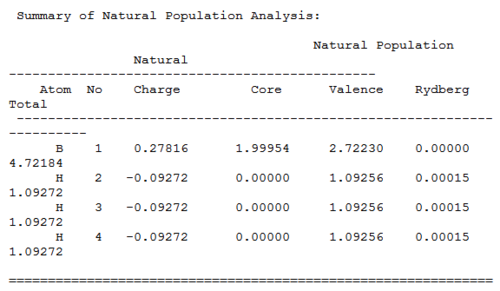
The neutral charges shown in the table are the same as the number shown in the molecule, and the sum of all the charges is zero. The natural populations represent the electrons "population"; the numbers under valance indicate the valance electrons and core the non-valance electrons. From the table, it is clear that the valance electrons in B are less than 3 and valance electron in all three hydrogens are greater than 1. This result is in good agreement with our understanding of this molecule; An overall neutral molecule with the Lewis acidic and slightly more electron-positive Boron atom being the more positive atom as the electrons are slightly drawn toward the hydrogens atoms (which are more electron-negative).
Bond orbital/ Coefficients/ Hybrids
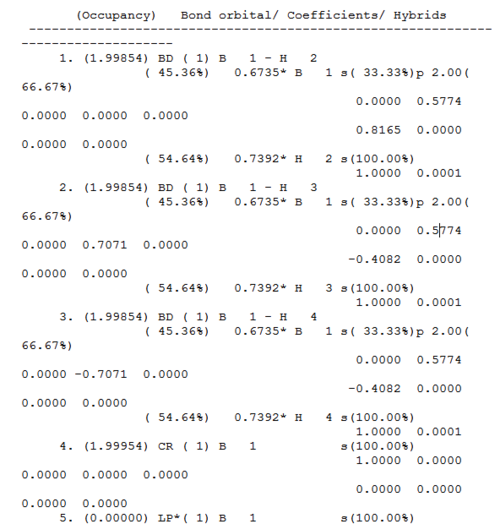
First Bonding B (atom 1) to H (atom 2), the bond consist of 45.36% B (33.33% s + 66.67% p, suggesting sp2 hybridized) and 54.64% H. Same bondings apply to the other two hydrognes, as shown above, all three bonds shared the exact same compositions.
Second Order Perturbation Theory Analysis of Fock Matrix in NBO Basis
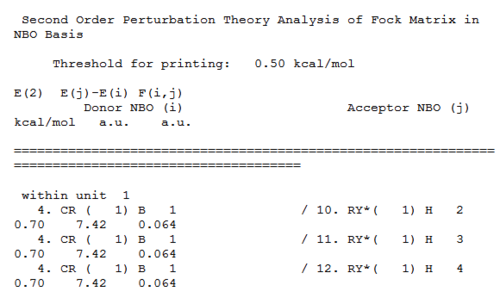
The second order perturbation theory Analysis shows the interaction between bonding and non-bonding orbitals, such as mixing between molecular orbitals.
Natural Bond Orbital

TlBr3
Optimization
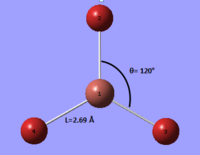
The optimization of TlBr3 was quit different to that of BH3, as Tl is has a lots more electrons than B (total of 35 electrons) and Br is also quit big in its own right (compare to hydrogen), making this optimization computationally very difficult and therefore would take a considerably a lot longer. To get around this problem, we used pseudo-potentials LanL2DZ as our basis set to simplify the calculations as it only takes valance electrons into account (ignoring "core electronic configuration").
This model is under the assumption that the reactivity and properties of a molecule are dictated by their valance electrons, this assumption is a fundamental concept of many chemistry we do today. While pseudo-potential might not be 100% accurate for all molecules, it can be used to descried heavier atoms without any significant errors and reduces the calculation time significantly. The particular basis set used -- LanL2DZ, have a medium level of accuracy among other pseudo-potentials, as it uses a reasonable number of functions to describe the electronic structure of TlBr3. The results of the optimization is shown in below table:


The RMS gradient of the optimization is much less than 0.001 and the structure is fully converged, suggesting a good optimization. (Note: all optimization have error in energy, RMS gradient and dipole moments, but are the same as the error shown in BH3 optimization and is therefore not repeated for the rest of the module.)
Vibrational analysis
The same basis set and method as the optimization were used for the frequencies calculation, similar procedure as BH3 frequencies calculations.
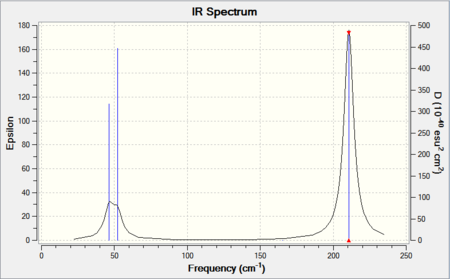 |
No negative frequencies were obtained and all low frequencies are within reasonable range (no >5 or < -10). More detailed vibrations are shown below:
| Vibration Mode | Vibration demo | Frequencies (cm-1) | Intensity | Symmetry |
|---|---|---|---|---|
| 1 | 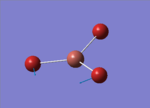 |
46.43 | 3.6867 | E' |
| 2 | 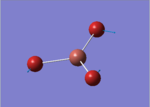 |
46.43 | 3.6867 | E' |
| 3 | 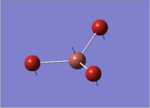 |
52.14 | 5.8466 | A2" |
| 4 | 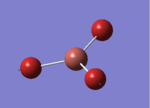 |
165.27 | 0.0000 | A1' |
| 5 | 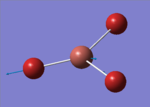 |
210.69 | 25.4830 | E' |
| 6 | 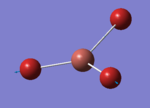 |
210.69 | 25.4797 | E' |
This time, 1/2 and 5/6 are the two degenerate pairs. Once again, the lack of changes in dipole moment leads to 0 intensity for symmetric stretching, asymmetric stretching show the highest changes in dipole and therefore highest intensity.
What is a Bond?
Bondings can be quit a difficult concept depending on how one would look at it. Classically, three main type of bondings exist; Metallic bonding consist of positively charged metal ions fixed in a sea of delocalized electrons. Ionic bondings are the electrostatic interaction between positively charged and negatively charged ions. Covalent bonding are a share of electrons between two atoms.
However, since the "discovery" of molecular orbitals, the concept of bondings becomes more complicated. However, in simple terms, bondings between atoms is the consequence of the attractive interaction between them, resulting in a localized electron density between these atoms. This interactions can be electrostatic ionic bonding or overlapping of orbitals in case of covalent bonding, however, most bondings usually involve both to certain extend.
Isomers of Mo(CO)4(PCl3)2
Mo(CO)4(PCl3)2 can exist in two forms, the two PCl3 groups cis or trans to each other. The trans complex would be expected to be more stable, as there would be less steric clashing between the two big PCl3 groups.
Optimization
Both Cis and Trans complexes undergo two optimizations, and both optimizations used pseudo-potentials as basis set but with different accuracy.
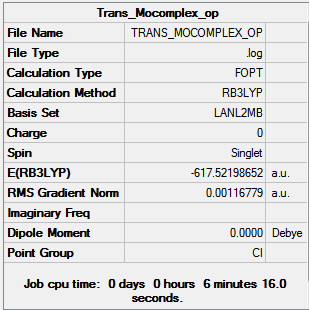
Initial optimization
The initial optimization was done using LANL2MB pseudo-potential basis set and B3LYP as method, the convergence was set to loose to allow a fast low level optimization. This optimization generate good approximate bond lengths and angles, making the final optimization easier and faster.
| Cis [6] | Trans [7] | |
|---|---|---|
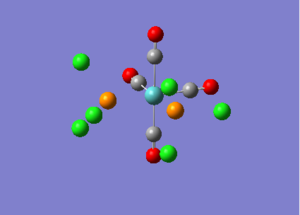 |
 | |
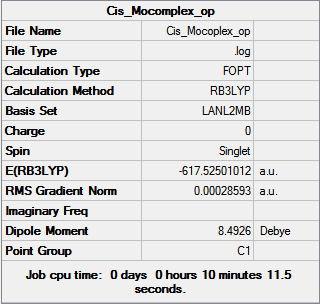 |
 | |
 |
 |
Further optimization
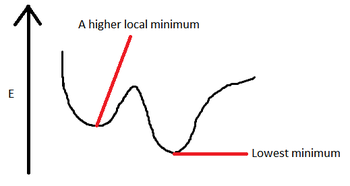
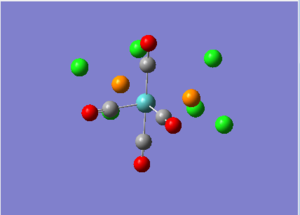
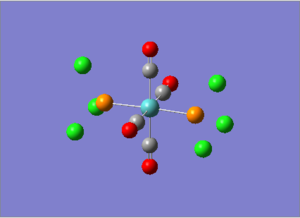
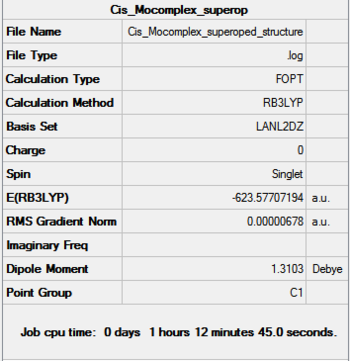
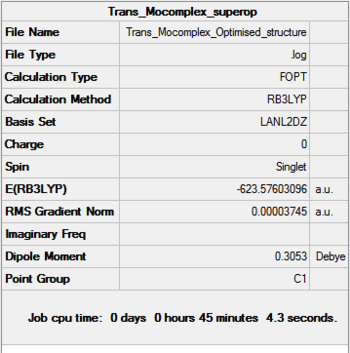
The dihedral angles of the Cl-P-Mo-CO were adjusted to allow a better starting point to be achieved. Doing so will make sure the optimization reaches the actual minimum (lowest minimum) instead of just one of the higher local minimum. This is done following the instruction.
| Cis [8] | Trans [9] | |
|---|---|---|
 |
 | |
 |
 | |
 |
 |
Further optimization generated structure with slightly lower energy than the previous optimization, about 10 au more, however, this number is not 100% reliable and therefore can not be used to draw any definitive conclusions. We can still, however see that the trans-complex is lower in energy than the cis-complex as we predicted.
Vibrational analysis
| Cis IR spectrum [10] | Trans IR spectrum [11] | |
|---|---|---|
 |
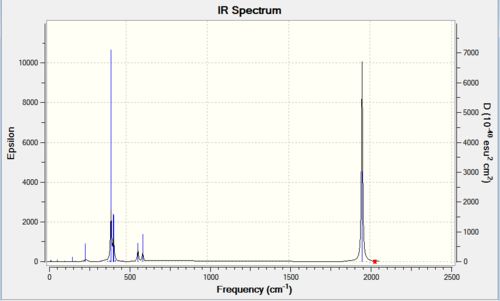 | |
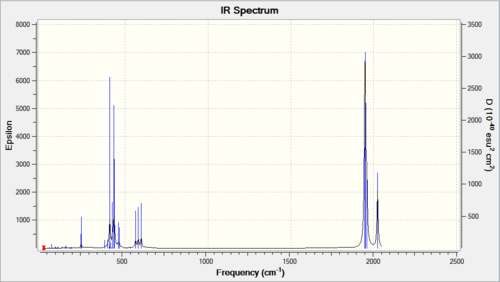
No negative frequencies, reasonable low frequencies.
| Cis Vibration Mode | Cis Vibration Frequencies (cm-1) | lit. values[12] | % error | Cis Intensity | Trans Vibration Mode | Trans Vibration Frequencies (cm-1) | lit. values[13] | % error | Trans Intensity |
|---|---|---|---|---|---|---|---|---|---|
 |
10.72 | - | - | 0.0264 | 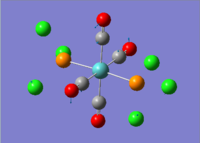 |
4.85 | - | - | 0.0941 |
 |
17.60 | - | - | 0.0074 | 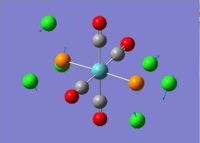 |
6.11 | - | - | 0.0000 |
 |
42.04 | - | - | 0.0048 | 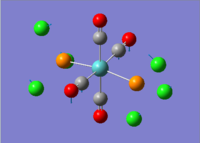 |
37.21 | - | - | 0.4185 |
 |
1945.33 | 1890 | 3% | 762.8674 | 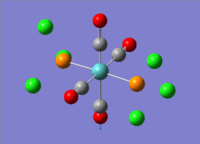 |
1950.52 | 1869 | 4% | 1475.4105 |
 |
1948.70 | 1890 | 3% | 1498.4471 | 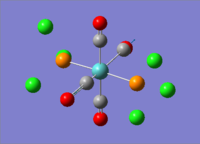 |
1951.16 | 1896 | 3% | 1466.7589 |
 |
1958.38 | - | - | 632.8388 | 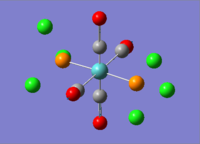 |
1977.43 | 1924 | 3% | 0.6451 |
 |
2023.34 | - | - | 597.7333 | 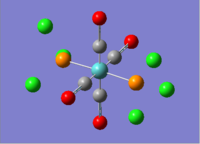 |
2031.21 | 2026 | 1.3% | 3.7722 |
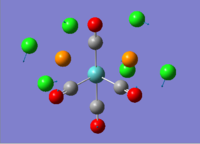
As can be seen from above table,the trans-complex has lower "low frequencies vibrations" than the cis-complex. Looking at the CO stretching, the Cis-complex showed 2 distinct peaks on the spectrum but actually have four vibrational modes that results in large enough change in dipole moment to shows noticeable intensity: 1945.33, 1948.70, 1958.38 (Three very close together, sometimes showed up as one big peak on spectrum) and 2023.34 cm-1. Whereas the Trans-complex only have one peak on its spectrum but again have two vibration modes with high intensity: 1950.52 and 1951.16 cm-1 (two very close and showed up as one peak). All values are reasonably close to literature values, less than 4% difference.
Mini Project
Metal complexes are one of the most heavily studied area of chemistry, they effect many different aspects of our modern day life; from the drug we used (such as Cis-Platin for cancer treatment[14]) to catalysts used in chemical industries. Understanding of the interactions between ligands and metals are crucial when dealing these complexes as their reactivity directly related to these interactions.
In the past, crystal field theory was used to explain the unusual bonding structure of metal complexes (as these structures can not be predicted using VSCPR). In this theory, the metal ions are simply described as point charges, and the bondings to ligands are just electrostatic interactions[15]. While it successfully described some of the metal complexes and their behavier, it fails to explain the spectrochemical series. In order to explain why ligand such as CO gives a large splitting in energy levels (detal Octahedral), ligand field theory, which apply molecular orbitals theory to metal complexes[16] is used. The concept of pi-acceptor ligands is introduced in this theory, with CO as one of the most well know example of such ligand.
In this mini-project, several metal carbonyl complexes would be studied using gasuview, and their structures, bonding and vibrational spectra would be looked at in order to demonstrate the concept of pi-acceptor and backbondings and how a metal complex can have an effect on them.
Effect of Metal centre to CO
Determining suitable basis sets for Optimization
First, a suitable basis set needed to be found in order to accurately study the metal complexes, RB3LYP was used as method for solving the Schrodinger equations for all complexes and hence would not be changed through out the project. At first,LANL2DZ was used as all transition metals are 3rd row or below with a relatively large amount of electrons. As mention before, while it is not particularly accurate, it allows fast calculations, with no prior knowledge on how long this calculation would actually take, trying with a simple basis set seemed to be a reasonable choice.
LANL2DZ Optimization with non-charged metal complexes
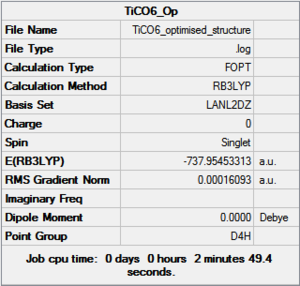
MnCO6 and TiCO6 were drew in gaussview and optimized using LANL2DZ, xxx. The optimized structures were then used for frequencies calculations. This is important as the IR spectrum is a very good indicator on the accuracy of the calculations, and how close the calculation is compared to experimental data. The expected CO stretching frequencies are around 2090cm-1 for MnCO6+, and 1800cm-1 TiCO62-. For simplicity, the charges are removed and neutral complexes are used instead.
| Mn(CO)6 [17] | Ti(CO)6 [18] | |
|---|---|---|
 |
 | |
 |
 | |
  |
 | |
| Vibrational file [19] | Vibrational file [20] |
As shown in the results table, removing charges was a bad idea, the CO stretch showed no real differences between the two complexes. Especially for MnCO6, negative frequencies were obtained despite the fully converged structure. One possible explanation is that the removal of charges made MnCO6 into a 19 electron complex, where an unpaired electron was generated, causing error in calculation. This also explained why the TiCO6 was not effected significantly as it became a 16 electrons complex with no unpaired electron.
Therefore, charges were added to the complex in later calculation. Also, the use of LANL2DZ alone was not the best option as it does not describe C and O very well. Therefore, 2 different basis sets was used in the next calculation with LANL2DZ was still used but only for Mn, C and O were represented by 6-31G.
Optimization with charged complexes Basis set = (LANL2DZ for Mn, 6-31G for C,O)
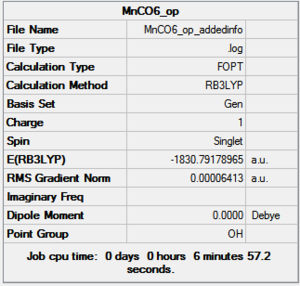
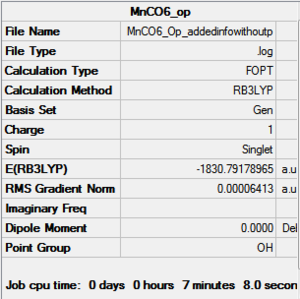
In this calculation, two MnCO6+ complexes were used, instead of Mn vs Ti. But one of the complex was set to use 6-31G+d when the other one uses only 6-31G. This allows us to see if the addition of polarization functions (d for heavier atoms only as there is no hydrogens/helium in the complex) and diffusion functions (only one +, again for heavier atoms ) generate a more accurate result. Polarization functions essentially allow involvement of higher orbitals, for example, the d orbitals are taken into account for elements such as phosphorus even though the valance orbitals is 3p. Diffusion function allows flexibility in orbitals, as orbitals in bonding are generally more diffused than their non-bonded state to certain extend.
| Mn(CO)6 (with d,p) [21] | Mn(CO)6 without dp [22] | |
|---|---|---|
 |
 | |
 |
 | |
 |
 | |
| Vibrational file [23] | vibrational file [24] |
As shown in above table, the addition of charges allows a much better prediction; no negative frequencies and more sensible vibrational frequencies. However, the addition of polarization function and diffusion function had almost no effect on the calculations (at least for the metal complexes I used in this project) except making the running time longer. Therefore no +,d would be used in the rest of the project.
However, looking at the time the calculations took, it would seem like the use of pseudo-potential was not necessary as all calculations finished within matter of minutes. Therefore for the final trial of calculation, a "real" basis set with a relatively high accuracy is used instead.
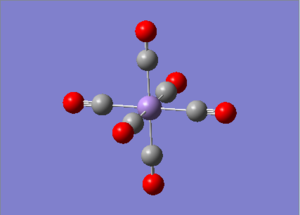
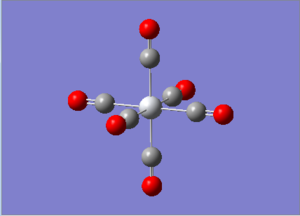
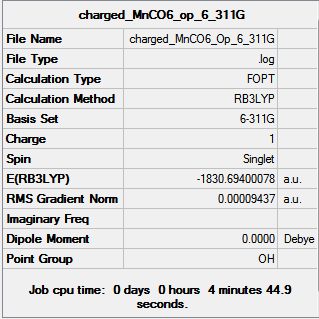
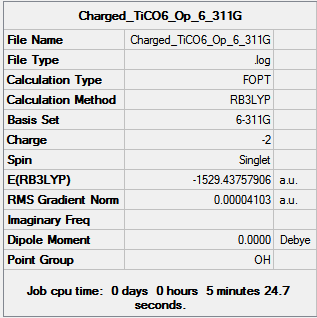
6-311G Optimization with charged complexes
| Mn(CO)6+ [25] | Ti(CO)62- [26] |
|---|---|
 |
 |
 |
 |
 |
 |
The calculations were all very fast, in fact even faster than using 2 basis sets, the two fully converged complexes shown in above table were uploaded for frequencies calculations.
Vibrational analysis
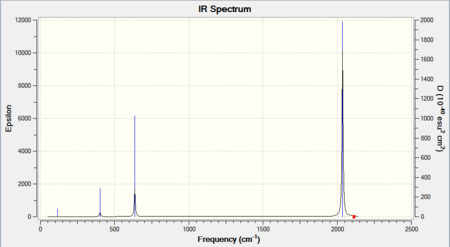
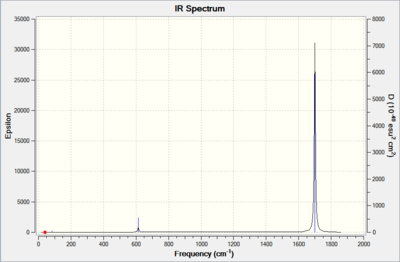
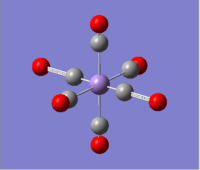
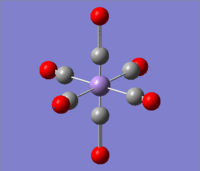
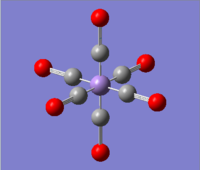
The overall results of the calculations using 6-311G were good and much closer to expected values (about 60 cm-1 less than expected values) compared to other basis sets (around 100 cm-1 more than expected values) and therefore was chosen for further analysis. The results of the frequencies calculations are shown below:
| Mn(CO)6 + [27] | Ti(CO)6 2- [28] | |
|---|---|---|
 |
 | |
| Free CO vibration mode | Vibration frequencies | Intensity |
|---|---|---|
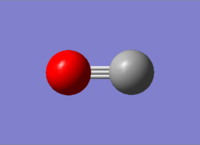 |
2087.49 | 45.7594 |
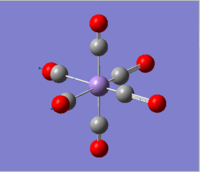
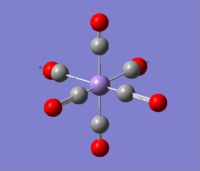
| Mn(CO)6+ Vibration Mode | Mn(CO)6+ Vibration Frequencies (cm-1) | Mn(CO)6+ Intensity | Ti(CO)62- Vibration Mode | Ti(CO)62- Vibration Frequencies (cm-1) | Ti(CO)62- Intensity |
|---|---|---|---|---|---|
 |
2036.29 | 1012.9793 |  |
1699.67 | 2999.5951 |
 |
2036.29 | 1012.9793 |  |
1699.67 | 2999.5951 |
 |
2036.29 | 1012.9793 | 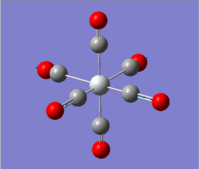 |
1699.67 | 2999.5951 |
 |
2050.67 | 0.0000 |  |
1713.24 | 0.0000 |
 |
2050.67 | 0.0000 |  |
1713.24 | 0.0000 |
 |
2114.16 | 0.0000 | 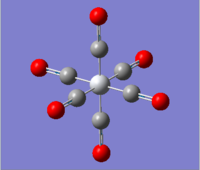 |
1835.52 | 0.0000 |
From the data above, while both complex showed lower CO stretching vibrations than free CO. It is clear that all the CO stretching vibrations in TiCO62- are much lower than that in MnCO6+. As a pi-acceptor ligand, CO have low-lying pi* orbitals which are ready to accept electrons from the metal centre. This back-donation from metal into the pi anti-bonding orbitals of the CO weakens the CO bond and hence lowering the frequencies of vibrations.
However, the extend of this back-donation can varied depending on the nature of the metals and/or the ligands it is bound to. TiCO62- and MnCO6+ have exactly the same ligands and therefore the differences in frequencies is likely due to the metal centres. TiCO62- is negatively charged while MnCO6+ is positively charged, this leads to a difference in electron density on the metal centres. While they both have the same number of electrons on the metals (6), Ti is a d4 metal with 6 electrons, making it the one with a much more electron density than Mn, a d7 metal but with only 6 electrons. The much more "dense" Ti naturally have a stronger back-bonding into the pi* orbitals of the CO, hence the much lower CO stretching frequencies.
MO Analysis
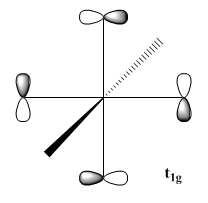
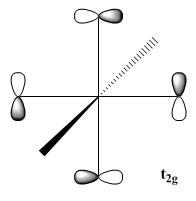
Each CO have two pi-orbitals, which leads to many combination of them when six CO are present in a ML6 complex. However, only one combination is capable of accepting back-donation as only the t2g combination of the CO pi-orbitals matches the symmetry of the metal orbitals[30]. The rest of the combination would exist as non-bonding orbitals and does not effect the energy splitting nor the stability of the metal complex. A few of the different combinations are shown below:
| t1u | t1g | t2g |
|---|---|---|
 |
 |
 |
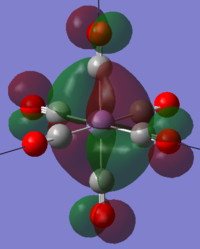
These matches the MOs generated by the calculations, two example MOs from Mn are shown below:
| LOMO+5 | HOMO |
|---|---|
 |
 |
The expected MOs for MCO6 are given below:
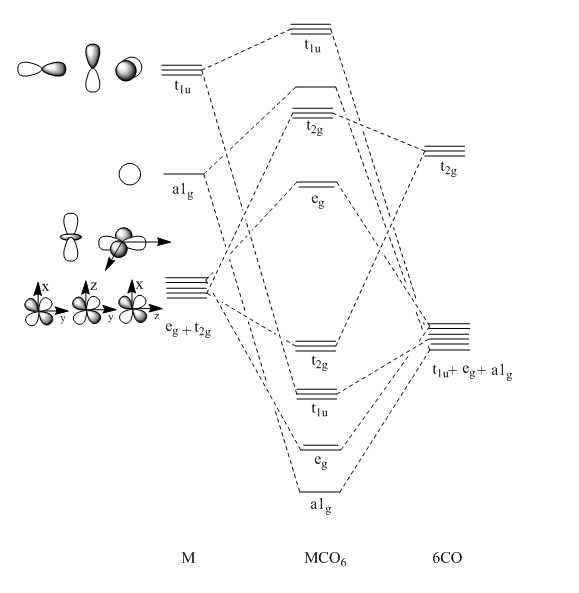
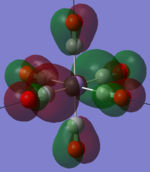
The MOs generated by calculation are given below:
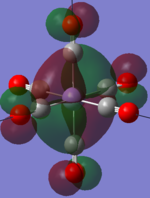
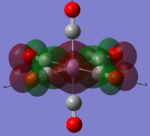
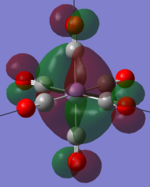
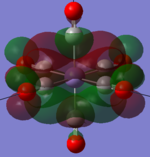
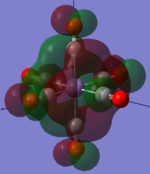
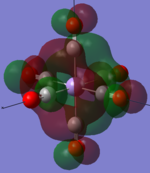
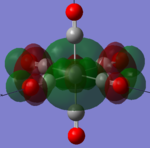
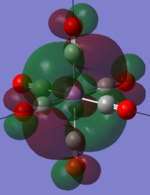
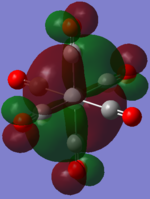
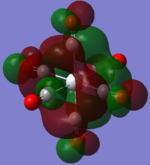
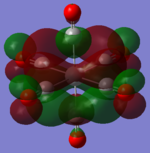
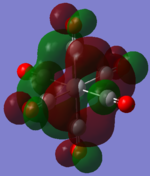
| MOs | HOMO-2 | HOMO-1 | HOMO | LUMO | LUMO+1 |
|---|---|---|---|---|---|
| MnCO6+[33] | 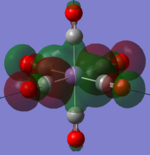 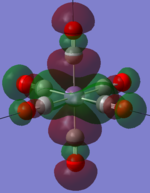 |
   |
   |
   |
  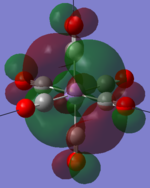 |
| TiCO62-[34] | 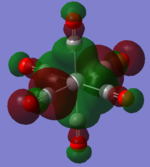 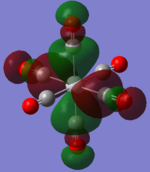 |
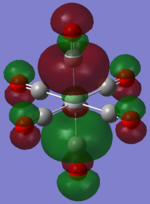 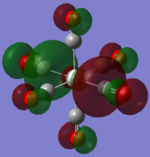 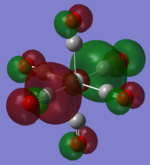 |
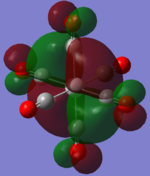 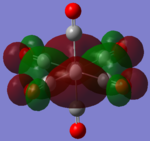  |
   |
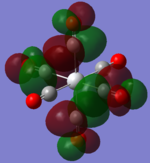 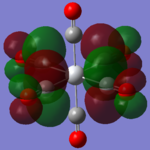  |
The two complexes shared very similar molecular orbitals as expected due the two shared extremely similar structure and both having the same symmetry and electron counts (18 electron compelx). Comparing the predicted and the calculated MOs, the first three orbitals are easily identified as there are very distinctive feature in these MOs; The HOMO-2 involved interaction with dz2 and dx2 - y2, HOMO-1 involve the interactions using the p-orbitals of metal, the HOMO involved the pi* orbitals of the CO interacting with the non-bonding d orbitals of the metal. Therefore, we can safely say that, the HOMO-2,HOMO-1 and HOMO from the calculations correspond nicely to the predicted eg, t1u and t2g MOs respectively.
On the other hand, the LUMO and the LUMO + 1 were quit difficult to assign. Looking at the predicted MO diagram, the LUMO should be a doubly degenerate eg orbital. However, the calculation results for both Mn and Ti complex, triply degenerate LUMOs were obtained. When inspecting the calculated MOs, the orbitals involved the another pi* orbitals of the CO (seemingly the one with t1u symmetry)which is very unusual. As mention before, the t1u combination should not be able to accept electrons. Either the calculations were mistaken, or the orbitals do in fact interact (possibly with the highest t1u level, which is the anti-bonding counterpart of the HOMO-1 orbitals in the predicted MOs) and that the predicted MOs can not be fully applied to the metal complexes in this mini project.
The LUMO+1 were also intriguing, while the LUMO+1 in the Mn complex was clearly the anti-bonding counterpart of the HOMO, the LUMO+1 in Ti complex is another set of the non-bonding Pi* orbitals combination. This differences is quit difficult to explain, but it may be due to the charges differences between the two complexes which lead to a different in the order of energy levels.
NBO Analysis
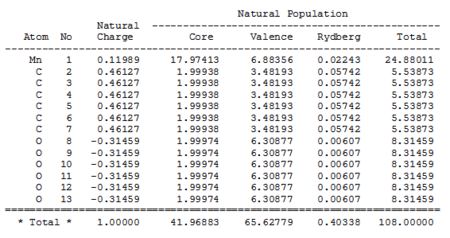
Natural Charges
| Mn(CO)6 + | Ti(CO)6 2- | |
|---|---|---|
 |
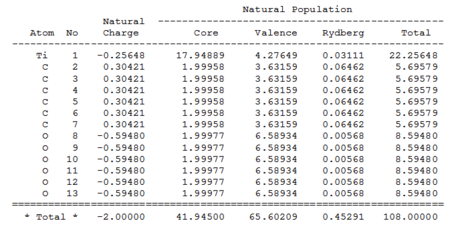 |
The data shown in the table above represent the charges distributions and the electrons populations within the complexes. While both complexes have almost the same valance populations (around 65.6), the distributions were quit different; The electrons are more localized at the metal centre for the Mn complex (around 6.9), whereas in the Ti complex, a lower populations are observed at the metal centre (only around 4.3). The valance populations of C and O are around 0.15 and 0.28 higher respectively in Ti than Mn complex. This indicate a migration of electron density from the metal centre to the CO as you move from the Mn complex to the Ti complex, suggesting a stronger back-bonding in Ti complex.
Second Order Perturbation Theory Analysis of Fock Matrix in NBO Basis
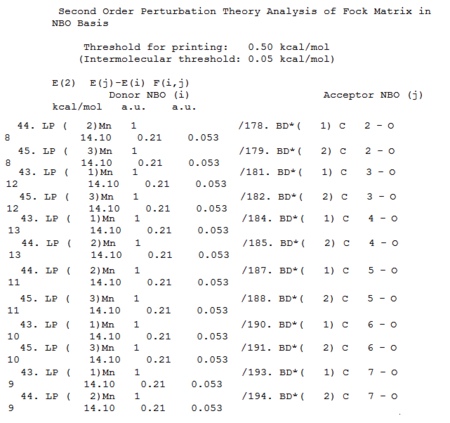
The NBO analysis was carried out along with the MOs analysis, the results are viewed by opening the resulting .log file in notepad. There are many many data within this file, however, the part that is most relevant to this project is the second order perturbation table, as it can be used to show the back-bonding interactions. There is a huge amount of interactions, the ones that represent back bondings (interaction between the metal lone pair and anti-bonding orbitals of CO) are shown below:
| Mn(CO)6 + | Ti(CO)6 2- | |
|---|---|---|
 |
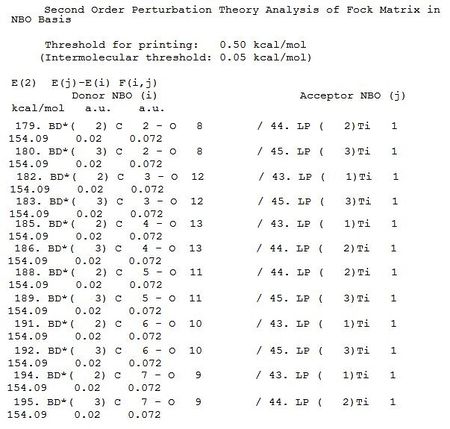 |
As shown in above data, there are significant interaction between metal lp and BD* of CO, there are six CO, can be distinguished by carbon numbers C2 to C7 (the C2 = carbonyl with Carbon atom 2, C7 is carbon atom 7, etc). The extend of this interaction can be view in the E(2) kcal/mol column; for each complex, all the interactions (C2 to C7) are the same as all CO are identical in chemical environment. However, the interactions are much stronger in Ti complex than in the Mn complex, 154 kcal/mol vs 14 kcal/mol, the E (2) values in Ti complex are more than ten times bigger. This is further support the idea that a higher electron density on the metal centre give rise to a stronger back-bonding.
Effect of other ligands to CO
The extend of the backbonding can also be effected by changing other ligands. For example, having electrons withdrawing ligands would decrease the electron density on the metal center and reduces the amount of backbonding where as electron donating ligands or simply a less electron withdrawing ligands would increase the electron density on metal and hence increase in backbonding.
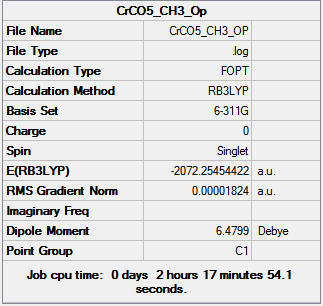
In the last part of this project, CrCO6 was used (Neutral charge complex makes interpretation and calculation easier) but one of the CO is substituted with a PX3 ligand (where X = Me or F). The original intent was to have trisubstituted complexes, however that would be computationally too difficult and therefore only one CO is substituted.
Optimization
| Cr(CO)5(PF3) [35] | Cr(CO)5(PMe3) [36] | |
|---|---|---|
 |
 | |
 |
 | |
 |
 |
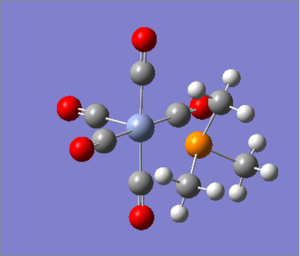
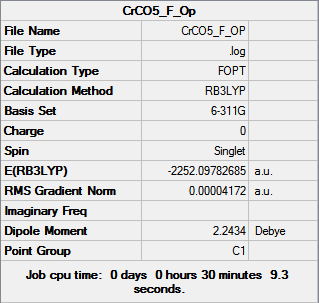
Fully converged optimization. However, the bonds between C and P was not shown in the molecule for X=Me complex, that is because the distance exceeded a preset value, but based on our chemical intuition, we know the bonds exist.
Vibrational analysis
| Cr(CO)5(PF3) [37] | Cr(CO)5(PMe3) [38] | |
|---|---|---|
 |
 | |
 |
 |
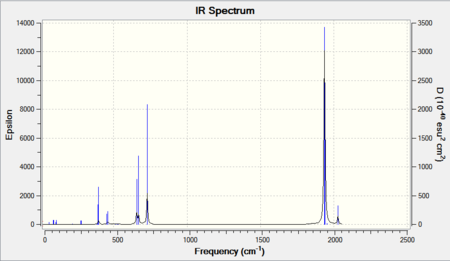
As shown in above table, similar trend is observed when a change in ligand from CO to PX3 where X= F or Me. For X = F, electron withdrawing nature of this ligands reduces the amount of back-bonding as the electron density would be more drawn toward the PF3 ligands. When X = Me, the electron density of the metal centre increases and hence a stronger back-bonding, leading to the low frequencies in CO stretch.
However, the differences are not very much, that might be because the use of only one PX3 ligand was not enough or the difference in electrons withdrawing nature between X=F and X=Me are not big enough. Nonetheless, the result still showed a significant difference between the two complex and hence demonstrated the effect of other ligands have on CO.
NBOs
| Cr(CO)5(PF3)[39] | Cr(CO)5(PMe3)[40] | |
|---|---|---|
 |
 |
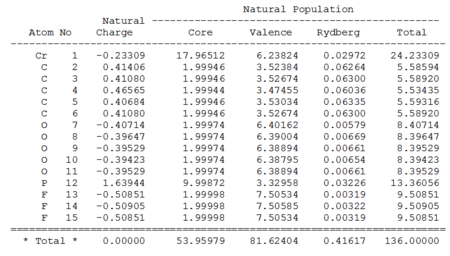
Again, looking at the valance column above, not a significant difference, but still a slightly higher value at the Cr for X=F complex, supporting the idea that the electrons are less donated into the CO. Similar trend was also observed in Second Order Perturbation Theory Analysis of Fock Matrix in NBO Basis analysis, however, the extend of the interactions are smaller than those found in the MnCO6+ and TiCO62- complexes.
MOs
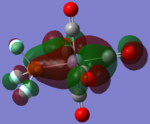
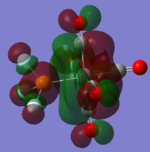
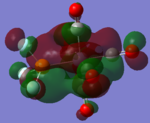
The MOs generated by calculation are given below:
| MOs | HOMO-2 | HOMO-1 | HOMO | LUMO | LUMO+1 |
|---|---|---|---|---|---|
| CrCO5PF3 [41] | 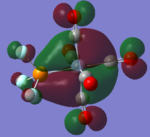 |
 |
 |
 |
 |
| CrCO5PMe3 [42] | 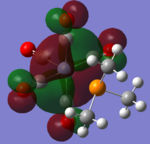 |
 |
 |
 |
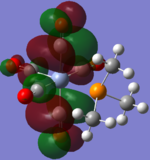 |
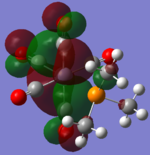
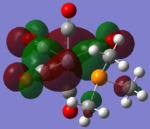
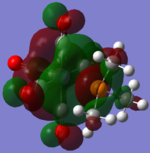
The loss of symmetry leads to the loss of degeneracy as shown in above MOs. But the HOMO, HOMO-1, HOMO-2 still represent the interaction between the d-orbitals in metal and the pi* orbitals of the CO with slight energy difference between them. Comparing the LUMO and the LUMO+1, we can see the electron density are more draw toward the PX3 when X=F as expected (PF3 is more electron negative than PMe3).
However, once again, in order to see a more significant differences trisubstituted complexes should be used. But that would take a significantly longer time for the calculations and was therefore not carried out.
References :
- ↑ Peter Atkins, Julio de paula, Physical chemistry 8th edition, Oxford University press 2006, pp363
- ↑ 2nd year Tutorial Problem, Hunt Research Groups
- ↑ 2nd year Tutorial Problem, Hunt Research Groups
- ↑ http://hdl.handle.net/10042/to-12076
- ↑ http://hdl.handle.net/10042/to-12075
- ↑ http://hdl.handle.net/10042/to-12070
- ↑ http://hdl.handle.net/10042/to-12071
- ↑ http://hdl.handle.net/10042/to-12072
- ↑ http://hdl.handle.net/10042/to-12071
- ↑ http://hdl.handle.net/10042/to-12074
- ↑ http://hdl.handle.net/10042/to-12073
- ↑ M. Ardon et al., J. Chem. Educ., 79(10), 2002, pp 1249 - 1251
- ↑ M. Ardon et al., J. Chem. Educ., 79(10), 2002, pp 1249 - 1251
- ↑ Peyrone M. (1844). "Ueber die Einwirkung des Ammoniaks auf Platinchlorür". Ann Chemie Pharm 51 (1): 1–29
- ↑ Van Vleck, J., Physical Review 1932 41: 208.
- ↑ Schläfer, H. L., Gliemann, G., Wiley Interscience: New York, 1969
- ↑ http://hdl.handle.net/10042/to-12049
- ↑ http://hdl.handle.net/10042/to-12050
- ↑ http://hdl.handle.net/10042/to-12051
- ↑ http://hdl.handle.net/10042/to-12052
- ↑ http://hdl.handle.net/10042/to-12065
- ↑ http://hdl.handle.net/10042/to-12067
- ↑ http://hdl.handle.net/10042/to-12066
- ↑ http://hdl.handle.net/10042/to-12068
- ↑ http://hdl.handle.net/10042/to-12053
- ↑ http://hdl.handle.net/10042/to-12054
- ↑ http://hdl.handle.net/10042/to-12057
- ↑ http://hdl.handle.net/10042/to-12055
- ↑ http://hdl.handle.net/10042/to-12202
- ↑ Second-year course: transition metal complexes
- ↑ Second-year course: transition metal complexes
- ↑ Andreas W. Ehlers,† Stefan Dapprich, Sergei F. Vyboishchikov, and Gernot Frenking,Organometallics 1996, 15, 105-117
- ↑ http://hdl.handle.net/10042/to-12058
- ↑ http://hdl.handle.net/10042/to-12056
- ↑ http://hdl.handle.net/10042/to-12059
- ↑ http://hdl.handle.net/10042/to-12061
- ↑ http://hdl.handle.net/10042/to-12062
- ↑ http://hdl.handle.net/10042/to-12061
- ↑ http://hdl.handle.net/10042/to-12064
- ↑ http://hdl.handle.net/10042/to-12063
- ↑ http://hdl.handle.net/10042/to-12064
- ↑ http://hdl.handle.net/10042/to-12063


