Rep:Mod:cherrybakewell
Modelling using Molecular Mechanics and Semi-Empirical Orbital Theory
Formation of the Cyclopentadiene Dimer
Cyclopentadiene is an excellent candidate for studying metallocene complexes (especially ferrocene) due to its ability to vary in hapticity. However, the complexation of cyclopentadiene is often limited by its tendency to dimerise at room temperature. The dimerisation occurs via a 4π+2π Diels-Alder cycloaddition, with two possible products. It has been reported that the exo-dimer is thermodynamically slightly more stable, but the endo-dimer is the major product[1][2].


In order to investigate the reasons behind this preference, both dimers were modelled using ChemBio 3D and their energies minimised using Allinger's MM2 method. Total energies and contributing factors are displayed in Table 1.
| Compound | Stretch (kcal/mol) | Bend (kcal/mol) | Stretch-Bend (kcal/mol) | Torsion (kcal/mol) | Non-1,4 VDW (kcal/mol) | 1,4 VDW (kcal/mol) | Dipole/Dipole (kcal/mol) | Total Energy (kcal/mol) |
|---|---|---|---|---|---|---|---|---|
| 1.3 | 20.6 | -0.8 | 7.7 | -1.4 | 4.2 | 0.4 | 31.9 | |
| 1.3 | 20.8 | -0.8 | 9.5 | -1.5 | 4.3 | 0.4 | 34.0 |
The data shows that the exo-dimer has a lower energy by 2.1 kcal/mol, and is therefore thermodynamically more stable. The difference in total energy mainly arises from the difference in torsion, the other factors being roughly equivalent. Increased torsion can be explained by analysing the dihedral angles in the two molecules:


The dihedral angle in the exo-dimer is 179°, which is close to the expected angle of 180° for an antiperiplanar conformation, offering ideal alignment of orbitals. The dihedral angle in the endo-dimer is -46°, resulting in greater strain in the molecule.
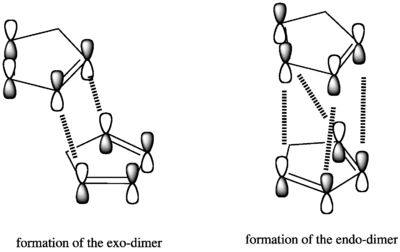
To determine the kinetic product, we consider the formation mechanism. By visualising the π-orbitals, we see that the approach in the formation of the endo-dimer has more favourable orbital interactions than the approach in the formation of the exo-dimer, stabilising the transition state. This stabilisation of the endo-transition state must be large enough to offset the energy difference in final products, making the reaction occur under kinetic control and the endo-dimer the major product. Unofortunately Allinger's MM2 method is unable to calculate transition states, so energy differences in transition states were not verified by calculations.
Hydrogenation of the Cyclopentadiene Dimer
Hydrogenation of the cyclopentadiene endo-dimer yields two different dihydrated products.

| Compound | Stretch (kcal/mol) | Bend (kcal/mol) | Stretch-Bend (kcal/mol) | Torsion (kca/mol) | Non-1,4 VDW (kcal/mol) | 1,4 VDW (kcal/mol) | Dipole/Dipole (kcal/mol) | Total Energy (kcal/mol) |
|---|---|---|---|---|---|---|---|---|
| 1.3 | 19.9 | -0.8 | 10.8 | -1.2 | 5.6 | 0.2 | 35.7 | |
| 1.1 | 14.5 | -0.5 | 12.5 | -1.1 | 4.5 | 0.1 | 31.2 kcal/mol |
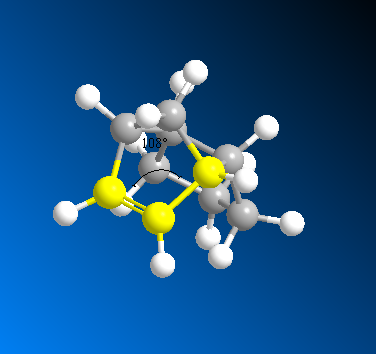
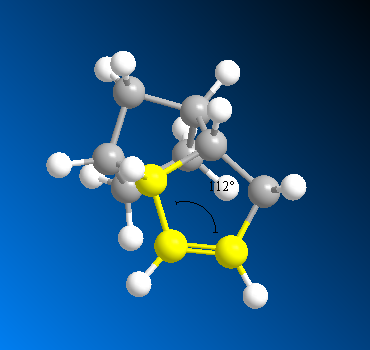
Dihydrate 4 has a lower energy by 4.5 kcal/mol, meaning it is the thermodynamically more stable product. Looking at the individual contributions, we see that the main difference between the two dihydrates is in the bending energy: this is almost 5 kcal/mol lower for 4 than for 3, and this can be explained by the difference in bond angles. The bond angle at the sp2 carbon on dihydrate 4 is 112°, compared to the angle of 108° on dihydrate 3. An sp2 hybridised centre is ideally trigonal planar with a bond angle of 120°, so a larger deviation from this will result in a higher bend energy. The bond angle on 4 is closer to ideal, and is hence lower in energy.
 |
 |
|---|
There is also a notable difference in torsion energies, following from the dihedral angles as explained in the previous section. The other factors have only minimal differences.
In order to determine whether the reaction occurs under kinetic or thermodynamic control, the kinetic product must be identified. This includes consideration of frontier orbitals, which Molecular Mechanics is unable to do.
Stereochemistry and Reactivity of an Intermediate in the Synthesis of Taxol

Taxol is an antitumor inhibiting agent, naturally available from the western yew, Taxus brevifolia.[3] Compounds 9 and 10 are atropoisomers (isomers caused by hindered rotation) of an intermediate in the synthesis of Taxol, as proposed by Paquette.[4][5]. In this case, the atropoisomerism is caused by steric bulk.
Both structures were optimised (especially the chair conformation of the six-membered ring) and their energies calculated using Allinger's MM2 and MMFF94 methods. Total energies and contributing factors are listed in Table 3. We see that intermediate 10 has the lower energy by 5.1 kcal/mol (according to MM2) or 9.9 kcal/mol (according to MMFF94). The increased stability of 10 is due to the position of the alkene in the bridgehead of the molecule. This results in hyperstability, and a slow rate of hydration.[6]
| Compound | Stretch (kcal/mol) | Bend (kcal/mol) | Stretch-Bend (kcal/mol) | Torsion (kcal/mol) | Non-1,4 VDW (kcal/mol) | 1,4 VDW (kcal/mol) | Dipole/Dipole (kcal/mol) | Total Energy MM2 (kcal/mol) | Total Energy MMFF94 (kcal/mol) |
|---|---|---|---|---|---|---|---|---|---|
| 2.8 | 16.5 | 0.4 | 18.3 | -1.6 | 13.1 | -1.7 | 47.8 | 70.5 | |
| 2.6 | 11.3 | 0.3 | 19.7 | -2.2 | 12.9 | -2.0 | 42.7 | 60.6 |
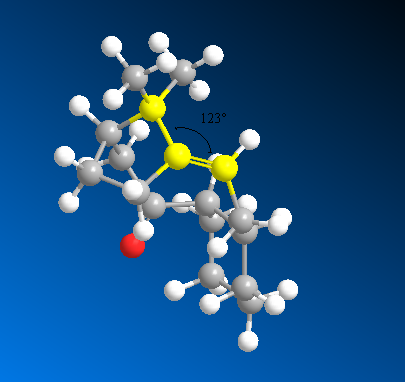
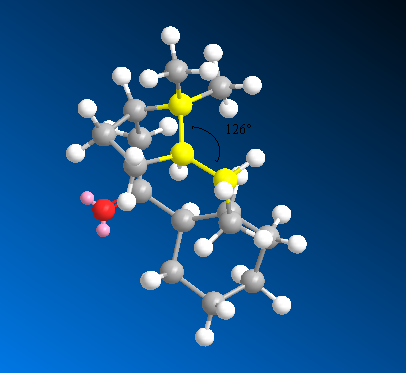
The main factor contributing to the difference in total energy is the bend energy, which arises from bond angle strain. Looking at the bond angle at the sp2 hybridised carbon of 10, we see that the angle of 123° is nearly ideal. In comparison, the bond angle at the sp3 carbon of the hydrated compound is 126°, which deviates much more from the ideal (109° for sp3). This helps to explain the increased stability of the alkene.
Regioselective Addition of Dichlorocarbene
To demonstrate the control orbitals can have on recativity, the geometries of compound 12 () and its monohydrated derivative 13() were calculated with MM2.
| Compound | Stretch (kcal/mol) | Bend (kcal/mol) | Stretch-Bend (kcal/mol) | Torsion (kcal/mol) | Non-1,4 VDW (kcal/mol) | 1,4 VDW (kcal/mol) | Total Energy (kcal/mol) |
|---|---|---|---|---|---|---|---|
| 12 | 0.6 | 4.7 | 0.0 | 7.7 | -1.1 | 5.8 | 17.9 |
| 13 | 0.9 | 4.7 | 0.0 | 10.8 | -1.1 | 7.0 | 22.3 |
According to the results from the MM2 calculations, compound 12 is more stable by 4.4 kcal/mol, arising from the differences in torsion and 1,4 VDW interactions. As MM2 doesn't take into account any secondary orbital interactions, the compounds were optimised and their energies calculated using MOPAC/PM6 and MOPAC/RM1 as well. Total energies obtained from the different methods are presented below.

| Compound | MM2 (kcal/mol) | MOPAC/PM6 (kcal/mol) | MOPAC/RM1 (kcal/mol) |
|---|---|---|---|
| 12 | 17.9 | 19.4 | 22.8 |
| 13 | 22.3 | -2.4 | 0.0 |
The reaction of 12 with chlorocarbene is a [1+2] cycloaddition, and forms a cyclopropane.
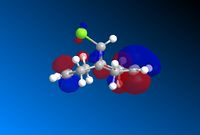
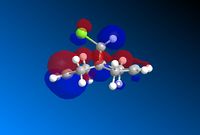
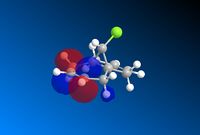
MM2 can not handle molecular orbitals, so they were modeled using MOPAC/PM6. From the images below, we see that the HOMO is asymmetrical, and the majority of electron density is located at the C=C п-bond syn to the Cl group. This makes it the best site for electrophilic attack. Conversely, there is less electron density at the C=C π-bond anti to the Cl group, making it the best site for nucleophilic attack. The LUMO shows electron density in the antibonding π-orbitals at the anti C=C π-bond. Dichlorocarbene is a strong electrophile, so we can assume it will attack at the syn C=C π-bond.
| HOMO-1 | HOMO | LUMO | LUMO+1 | LUMO+2 |
|---|---|---|---|---|
 |
 |
 |
 |
 |
The stabilisation of the anti C=C π-bond with respect to the syn C=C π-bond is most likely due to interaction from the antibonding σ*-orbital of the C-Cl bond. It is correctly aligned with the anti C=C π-bond (and too far from the syn C=C π-bond), and the electronegativity of Cl lowers the energy of the σ*-orbital enough to match the C=C π-bond. This stabilising effect explains the regioselectivity of the addition reaction.
Compound 12 has Cs symmetry with a mirror plane through the C-Cl bond. Symmetry is lost on hydration of a C=C bond, and the hydrated product has C1 symmetry.
The optimised structures were then subjected to further geometry optimisation via the Gaussian B3LYP/6-31G(d,p) method. The vibrational frequencies of both molecules were calculated, and predicted IR spectra are shown below.
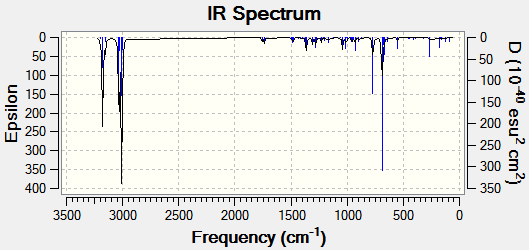
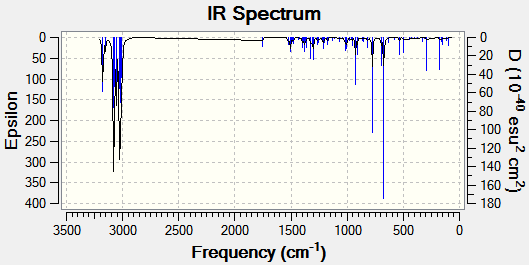
The C-Cl absorption band shifts by 3.8 cm-1 on hydration, indicating an increase in bond strength. This is due to the lack of interaction of the σ*-orbital with the syn C=C π-orbital, as a decrease in electron density in an antibonding orbital results in an increase in bond strength. The C=Csyn stretching shows effectively no change.
We can conclude that MOPAC/PM6 has been successful in rationalising the reactivity of the molecule by considering the molecular orbitals.
Monosaccharide Chemistry: Glycosidation


Glycosidation reactions exhibit diastereospecificity due to a neighbouring-group effect: the acetyl group interacts with the oxonium ion in the ring, delocalising the charge. This effectively blocks one side of the anomeric carbon, forcing the nucleophile to attack from a specific side. The orientation of the acetyl group therefore plays an important role in determining which anomer is formed in the reaction.
A methyl group was used as the R group, as they are small and do not have too many electrons (avoiding lengthy calculations). Hydrogens were considered, but the possible effects of hydrogen-bonding would have complicated the calculations.
The structures A-D were optimised using both Allinger's MM2 method and MOPAC/PM6. Energies and components, along with optimised structures, have been listed in Table 8 below. For further comparison, each structure was adjusted to have the acyl group pointing in the opposite direction.
Both isomers A and B were lower in energy than their counterparts A* and B*. The main contributor to this is the charge/dipole energy, as there is a difference of 18.8 kcal/mol and 16.6 for A/A* and B/B* respectively. This is due to varying orientation of the oxygen atom of the acyl group, as this is the most polar part of the molecule.
A similar trend was observed with C/C* and D/D*, albeit the differences in total energy were smaller. In this case, the main contributor was the difference in bend energy (2.0 kcal/mol for C/C* and 2.8 kcal/mol for D/D*).
| Compound | Orientation of Ac group | Stretch (kcal/mol) | Bend (kcal/mol) | Stretch-Bend (kcal/mol) | Torsion (kcal/mol) | Non-1,4 VDW (kcal/mol) | 1,4 VDW (kcal/mol) | Charge/Dipole | Dipole/Dipole (kcal/mol) | Total Energy MM2 (kcal/mol) | Jmol/MM2 | Total Energy MOPAC/PM6 (kcal/mol) | Jmol/PM6 |
|---|---|---|---|---|---|---|---|---|---|---|---|---|---|
| Isomer A | Below | 2.8 | 11.4 | 1.0 | 1.6 | 1.5 | 18.8 | -25.5 | 6.0 | 17.7 | -91.6 | ||
| Isomer A* | Above | 2.4 | 10.8 | 0.9 | 0.9 | -2.5 | 18.7 | -6.7 | 4.0 | 28.5 | -77.4 | ||
| Isomer B | Above | 2.5 | 10.6 | 0.9 | 4.1 | -0.2 | 19.8 | -27.8 | 8.4 | 18.3 | -88.4 | ||
| Isomer B* | Below | 2.3 | 9.9 | 0.8 | 1.8 | -1.4 | 19.1 | -11.2 | 4.3 | 25.6 | -77.5 | ||
| Isomer C | Below | 1.7 | 16.1 | 0.7 | 7.8 | -4.0 | 17.7 | -5.0 | -0.4 | 43.5 | -91.7 | ||
| Isomer C* | Above | 2.8 | 18.1 | 0.9 | 9.3 | -2.2 | 19.1 | 2.5 | -1.6 | 48.9 | -66.8 | ||
| Isomer D | Above | 1.8 | 18.3 | 0.7 | 7.8 | -3.5 | 17.5 | -5.2 | -2.2 | 35.3 | -88.5 | ||
| Isomer D* | Below | 2.8 | 21.1 | 0.9 | 7.1 | -1.9 | 17.9 | -2.0 | -1.0 | 44.8 | -67.0 |
The main disadvantage of the MM2 method is the fact that it can not account for the neighbouring group effect, or change in bonding. The MOPAC/PM6 method takes into account the delocalisation of the charge over the two oxygens. This can also be seen in the fact that according to the MOPAC/PM6 results, A/C and B/D.
Structure-Based Mini Project: Assigning Regioisomers in Click Chemistry

Click chemistry is a type of quick, easy chemistry of joining small molecules together, often using a Cu(I) catalyst. A useful example of a click reaction is the 1,3-dipolar cycloaddition of an azide and an alkyne with a Cu(I) catalyst, producing a 1,4-disubsituted 1,2,3-triazole. The reaction can also produce the complementary 1,5-disubstitued triazole, if a Ru(II) catalyst is used.[7][8]
The aim of this experiment is to investigate whether or not the two isomeric products (where R1=Ph) can be distinguished using spectroscopic methods. All the techniques described in the previous sections are used to model the isomers and predict their spectra.
Geometry
Structures for isomers A and B were optimised using both Allinger's MM2 and MOPAC/AM1 methods. The optimised structures are shown below, along with total energies as calculated with the respective methods.
According to the MM2 method, the optimised structure for A has coplanar benzyl and triazole rings. The angle of the rings is 113°C, which is quite close to the expected 109° angle of an sp3 carbon. The slight deviation would however result in some increased repulsion between the two electron-rich ring systems, explaining the higher bend energy. The AM1 optimised structure has almost coplanar benzyl and phenyl rings, with the triazole ring bent out of plane with respect to both benzene rings. The bond angle at the bridging carbon is 115°, showing a greater deviation from the ideal angle.
Similarly for B, MM2 gives an optimised structure with coplanar benzyl and triazole rings and a bond angle of 110° at the bridging carbon. This shows effectively no deviation, and a lower bend energy compared to A. The AM1 method again gave a structure with the benzyl ring out of plane with the triazole and a bond angle of 114°.
| Compound | Stretch | Bend | Stretch-Bend | Torsion | Non-1,4 VDW | 1,4 VDW | Dipole/Dipole | Total Energy / kcal |
|---|---|---|---|---|---|---|---|---|
| Isomer A | 1.1 | 18.3 | 0.1 | -15.7 | 0.7 | 14.4 | -1.7 | 17.2 kcal/mol |
| Isomer B | 0.8 | 13.1 | 0.0 | -14.9 | -1.6 | 14.7 | -1.4 | 10.6 kcal/mol |
DFT Calculations
The AM1 optimised structures were subjected to further geometry optimisation using Gaussian mpw1pw91/6-31g(d,p).
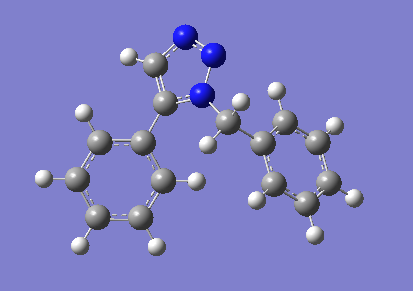
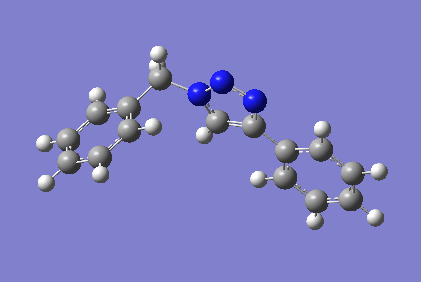
The resulting structures were very similar to those obtained by the MM2 method.
Spectra
13C NMR, 1H NMR and IR spectra were predicted for both isomers using the GIAO approach and are presented below.
13C NMR
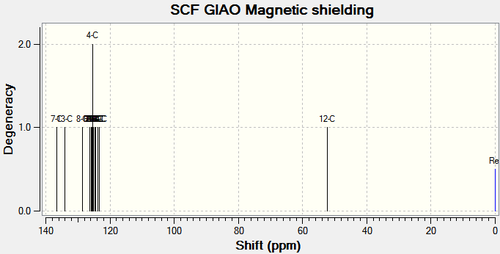
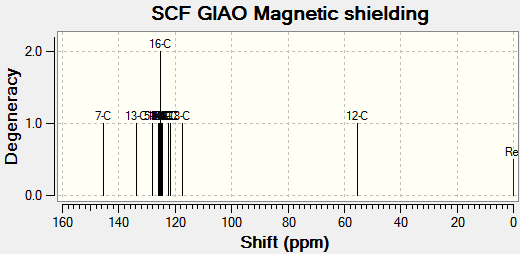
Chemical shifts for carbons that are directly attached to heteroatoms have been corrected.
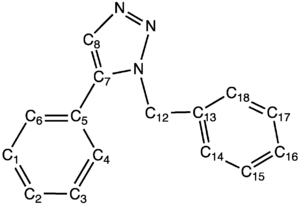
| Carbon | δ(calculated) (corrected) (ppm) | δ(literature)[7] (ppm) | Difference(calc-lit) (ppm) |
|---|---|---|---|
| 7-C | 136.7 (143.2) | 138.3 | +4.9 |
| 13-C | 134.1 | 135.7 | +1.6 |
| 8-C | 128.6 (135.5) | 133.3 | +2.2 |
| 6-C | 126.2 | 133.3 | -7.1 |
| 2-C | 125.9 | 129.6 | -3.7 |
| 1-C, 17-C & 4-C | 125.5 | 129.1 | -3.6 |
| 15-C & 3-C | 125.1 | 128.9 | -3.8 |
| 5-C & 16-C | 124.6 | 128.2 | -3.6 |
| 18-C | 123.7 | 127.2 | -3.5 |
| 14-C | 123.4 | 126.9 | -3.5 |
| 12-C | 52.2 (62.1) | 51.9 | +10.2 |
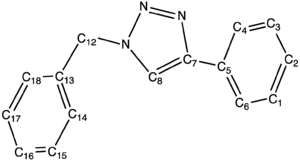
| Carbon | δ(calculated) (corrected) (ppm) | δ(literature) (ppm)[8] | Difference(calc-lit) (ppm) |
|---|---|---|---|
| 7-C | 145.3 (151.5) | 148.6 | +2.9 |
| 13-C | 133.7 | 135.0 | -1.3 |
| 5-C | 128.2 | 131.0 | -2.8 |
| 17-C | 126.0 | 129.4 | -3.4 |
| 3-C & 1-C | 125.6, 125.4 | 129.1 | -3.6 |
| 15-C | 125.2 | ||
| 16-C | 125.2 | ||
| 14-C | 125.9 | ||
| 18-C | 124.7 | ||
| 2-C, 4-C & 6-C | 124.6, 122.3, 121.8 | 126.0 | -3.2 |
| 8-C | 117.4 (124.7) | 120.0 | +4.7 |
| 12-C | 55.3 (65.1) | 53.9 | +11.2 |
For isomer B, comparison of the 13C NMR to literature was incomplete, as only a low resolution spectrum was available. Comparing the spetra to each other, the most notable difference is in the downfield shift (from A to B) of the triazole carbon attached to the benzyl ring (7-C in each case).
1H NMR
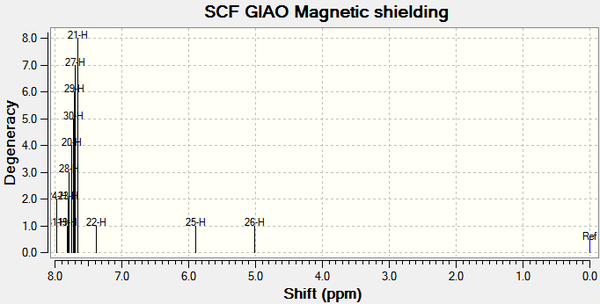
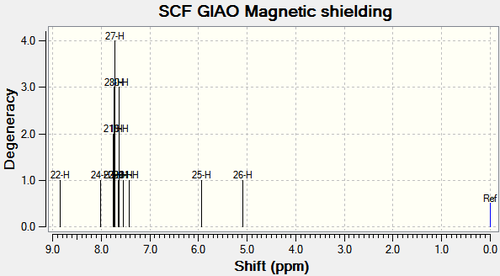
IR spectra
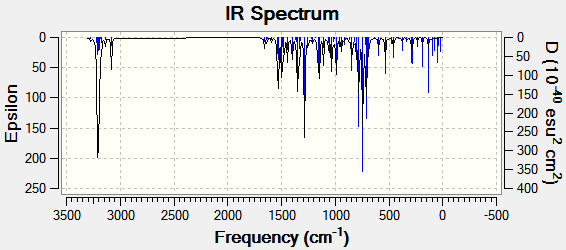
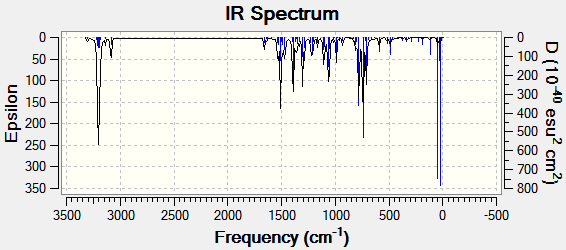
Predicted IR spectra are displayed below.
| Functional group | Isomer A | Isomer B |
|---|---|---|
| Frequency (cm-1) | Frequency (cm-1) | |
| C-H (triazole) | 3277.6 | 3301.4 |
| C-H (benzyl) | 3217.2 | 3218.3 |
| C-H (phenyl) | 3205.3 | 3211.0 |
| CH2 | 3082.6 | 3085.7 |
| C=C (benzyl) | 1659.6 | 1662.2 |
| C=C (phenyl) | 1659.1 | 1660.0 |
| N-N | 1284.2 | 1288.2 |
Isomer B seemed to exhibit shifts into higher energies for the vibrational frequencies, the most notable difference being in the triazole C-H absorption. Although such a transposition of the spectrum could be useful in distinguishing between the isomers, the shifts are most likely too small to provide conclusive evidence.
Conclusions
Different methods of molecular modelling were used to predict geometries and spectra for the isomers. IR spectroscopy showed differences that were too small, but more pronounced shifts in NMR spectra could be used to distinguish between the two isomers.
References
- ↑ W. C. Herndon, C. R. Grayson, J. M. Manion, J. Org. Chem., 1967, 32, 529 DOI:10.1021/jo01278a003
- ↑ D. Hönicke, R. Födisch, P. Claus, M. Olson, 2000, Cyclopentadiene and Cyclopentene, Ullman's Encyclopadia of Industrial Chemistry DOI:10.1002/14356007.a08_227
- ↑ M.C. Wani, H.L. Taylor, M. E. Wall, P. Coggon, A.T. McPhall, J. Am. Chem. Soc, 1971, 93, 2326 DOI:10.1021/ja00738a045
- ↑ S.W. Elmore, L.A. Paquette, Tetrahedron Lett., 1991, 32, 219 DOI:10.1016/S0040-4039(00)92617-0
- ↑ L.A. Paquette, N.A. Pegg, D. Toops, G.D. Maynard, R.D. Rogers,J. Am. Chem. Soc., 1990, 112, 277 DOI:10.1021/ja00157a043
- ↑ W.F. Maier, P. von Ragué Chleyer,J. Am. Chem. Soc., 1981, 103, 1891 DOI:10.1021/ja00157a043
- ↑ 7.0 7.1 L. Zhang, X. Chen, P. Xue, H.H.Y. Sun, I.D. Williams, K.B. Sharpless, V. V. Fokin, G. Jia, J. Am. Chem. Soc., 2005, 127, 15998 DOI:10.1021/ja054114s
- ↑ 8.0 8.1 V.V. Rostotsev, L.G. Green, V.V. Fokin, K.B. Sharpless, Angew. Chem. Intl. Ed., 2002, 41, 2596 DOI:10.1002/1521-3757 Cite error: Invalid
<ref>tag; name "Eight" defined multiple times with different content


