Rep:Mod:cel16inorganic
Part 1
BH3
Optimisation and frequency analysis
A BH3 molecule was optimised:
B3LYP/6-31G(d,p)
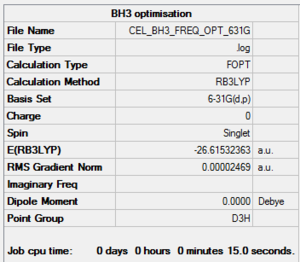
The item table below illustrates that the optimisation was successful by showing (along with the RMS gradient <0.001 AU) that convergence was achieved:
         Item               Value     Threshold  Converged?
 Maximum Force            0.000049     0.000450     YES
 RMS     Force            0.000032     0.000300     YES
 Maximum Displacement     0.000196     0.001800     YES
 RMS     Displacement     0.000128     0.001200     YES
The frequency analysis of the optimised BH3 yielded the zero frequencies shown below. These correspond to an optimised (minimum) structure:
 Low frequencies ---   -0.4059   -0.1955   -0.0056   25.3480   27.3326   27.3356
 Low frequencies --- 1163.1913 1213.3139 1213.3166
Frequency analysis file: CEL BH3 FREQ.LOG
Optimised BH3 molecule:
BH3 |
Vibration analysis
| Wavenumber (cm-1) | Intensity (arbitary units) | Symmetry | IR active? | Type |
|---|---|---|---|---|
| 1163 | 93 | A2'' | Yes | Out-of-plane bend |
| 1213 | 14 | E' | V. Slightly | In-plane bend |
| 1213 | 14 | E' | V. Slightly | In-plane bend |
| 2582 | 0 | A1' | No | Symmetric stretch |
| 2715 | 126 | E' | Yes | Asymmetric stretch |
| 2715 | 126 | E' | Yes | Asymmetric stretch |
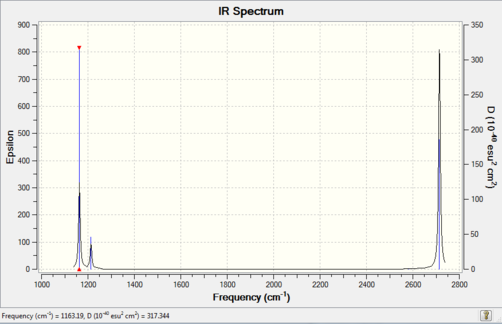
Only three IR peaks are observed for BH3 rather than the six stretch/bend modes which can occur (as predicted by the 3N-6 rule)[1]. This is due to the degeneracy of the two asymmetric stretches and the two in-plane bends, in addition to the IR inactive symmetric stretch. Degenerate signals occur at the same wavenumber and intensity so are superimposed on the IR spectrum, causing only a single peak to be observed.
MO analysis
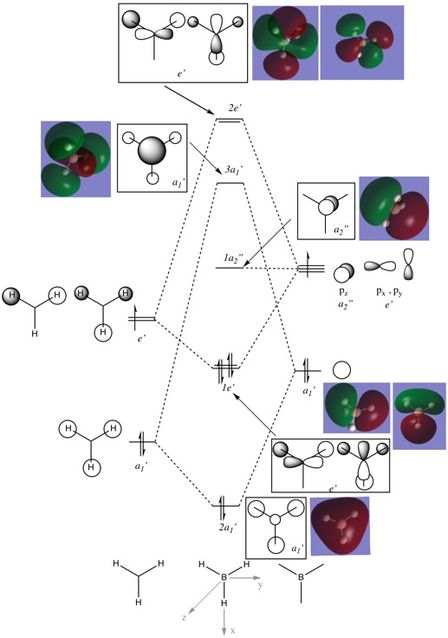
In most cases, the LCAOs appear to be very similar to the computed MOs, with the same basic symmetry and geometry. However, the antibonding 3a1' computed MO appears to have less antibonding character than the corresponding LCAO, seen by the larger area of electron density surrounding the central boron atom . This may mean that the 3a1' MO is slightly more stabilised than is indicated in the diagram. Overall, the LCAOs are a good representation of the computed MOs, illustrating the importance of molecular orbital theory in predicting the shape of real MOs.
Ng611 (talk) 13:44, 5 June 2018 (BST) I'm not sure I agree with your assertion that there is a 'larger area of electron density surrounding the central boron atom.'. In fact, I see the opposite -- that the contribution from the boron in the computed 3a1 orbital is significantly less than predicted by qualitative MO theory.
NH3
Optimisation and frequency analysis
The summary, item table and zero frequencies shown below illustrate that the optimisation was successful and convergence was achieved for the optimised NH3 molecule:
B3LYP/6-31G(d,p)
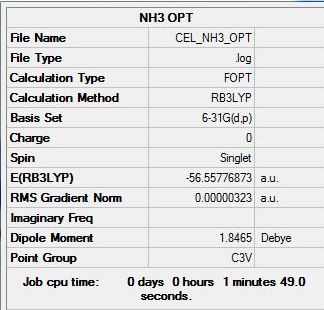
         Item               Value     Threshold  Converged?
 Maximum Force            0.000348     0.000450     YES
 RMS     Force            0.000256     0.000300     YES
 Maximum Displacement     0.005481     0.001800     NO
 RMS     Displacement     0.002707     0.001200     NO
Low frequencies ---   -8.5646   -8.5588   -0.0044    0.0454    0.1784   26.4183
Low frequencies --- 1089.7603 1694.1865 1694.1865
Frequency analysis file: CEL NH3 OPT FREQ.LOG
Optimised NH3 molecule:
NH3 |
NH3BH3
Optimisation and frequency analysis
The summary, item table and zero frequencies shown below illustrate that the optimisation was successful and convergence was achieved for the optimised NH3BH3 molecule:
B3LYP/6-31G(d,p)
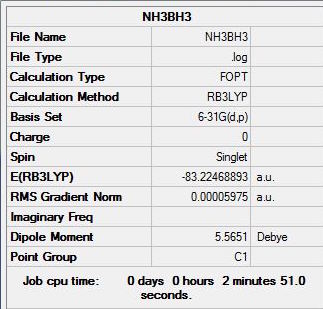
  Item               Value     Threshold  Converged?
 Maximum Force            0.000122     0.000450     YES
 RMS     Force            0.000058     0.000300     YES
 Maximum Displacement     0.000513     0.001800     YES
 RMS     Displacement     0.000296     0.001200     YES
 Low frequencies ---    0.0008    0.0010    0.0012   18.0575   28.4116   40.0963
 Low frequencies ---  266.4888  632.3850  639.5950
Frequency analysis file: NH3BH3 FREQ CEL16.LOG
Optimised NH3BH3 molecule:
NH3BH3 |
Association/dissociation Energy calculation
| Molecular fragment | Energy, E(RB3LYP) (au) |
|---|---|
| BH3 | -26.61533 |
| NH3 | -56.55777 |
| NH3BH3 | -83.22469 |
Using the equation: ΔE=E(NH3BH3)-[E(NH3)+E(BH3)], the dissociation and association energies of the B-N bond in ammonia-borane can be calculated[3].
| ΔE(RB3LYP) | au | KJ mol-1 |
|---|---|---|
| Association Energy | -0.0516 | -135 |
| Dissociation Energy | +0.0516 | +135 |
The association energy was calculated using the equation above as this corresponds to the forward reaction i.e. formation of ammonia-borane from ammonia and borane. From this the dissociation energy was calculated. It has the same magnitude as the association energy, with a positive energy change. When comparing with the covalent C-H bond in methane, which has an dissociation energy of +438.892 KJ mol-1, the dissociation energy of the N-B bond in ammonia-borane is relatively low. This suggests that the dative bond is weak. This may be due to the greater electronegativity of the nitrogen, which makes it a weak electron donor destabilising the dative bond[4].
Ng611 (talk) 13:36, 5 June 2018 (BST) Correct calcualtion and good consideration given to the accuracy of the reported result.
BBr3
Optimisation and frequency analysis
The summary, item table and zero frequencies shown below illustrate that the optimisation was successful and convergence was achieved for the optimised BBr3 molecule:
B3LYP/6-31G(d,p), pseudo-potential: LANL2DZ
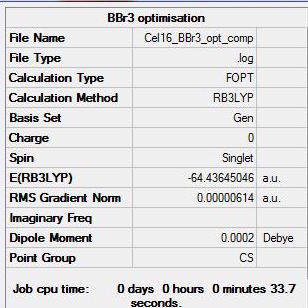
      Item               Value     Threshold  Converged?
 Maximum Force            0.000010     0.000450     YES
 RMS     Force            0.000007     0.000300     YES
 Maximum Displacement     0.000045     0.001800     YES
 RMS     Displacement     0.000032     0.001200     YES
Low frequencies ---   -1.9018   -0.0001   -0.0001    0.0002    1.5796    3.2831
 Low frequencies ---  155.9053  155.9625  267.7047
Frequency analysis file: Cel16 BBr3 opt comp freq 1.log
Frequency file of successful analysis on Dspace:DOI:10042/202452
Optimised BBr3 molecule:
BBr3 |
Part 2 (Aromaticity)
Benzene
Optimisation and frequency analysis
The summary, item table and zero frequencies shown below illustrate that the optimisation was successful and convergence was achieved for the optimised benzene molecule:
B3LYP/6-31G(d,p)
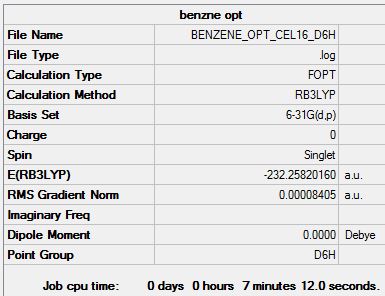
      Item               Value     Threshold  Converged?
 Maximum Force            0.000194     0.000450     YES
 RMS     Force            0.000077     0.000300     YES
 Maximum Displacement     0.000824     0.001800     YES
 RMS     Displacement     0.000289     0.001200     YES
 Low frequencies ---   -2.1456   -2.1456   -0.0089   -0.0044   -0.0044   10.4835
 Low frequencies ---  413.9768  413.9768  621.1390
Frequency analysis file: BENZENE OPT CEL16 FREQ.LOG
Optimised benzene molecule:
Benzene |
Borazine
Optimisation and frequency analysis
The summary, item table and zero frequencies shown below illustrate that the optimisation was successful and convergence was achieved for the optimised borazine molecule:
B3LYP/6-31G(d,p)
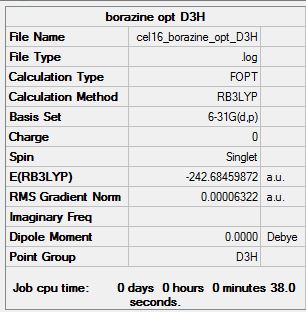
         Item               Value     Threshold  Converged?
 Maximum Force            0.000084     0.000450     YES
 RMS     Force            0.000032     0.000300     YES
 Maximum Displacement     0.000248     0.001800     YES
 RMS     Displacement     0.000073     0.001200     YES
Low frequencies ---   -6.8949   -6.2722   -5.8025   -0.0107    0.0583    0.1547
 Low frequencies ---  289.2034  289.2114  403.7636
Frequency analysis file: CEL16 BORAZINE FREQ D3H.LOG
Optimised borazine molecule:
Borazine |
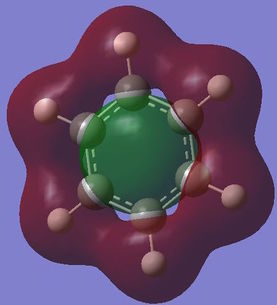
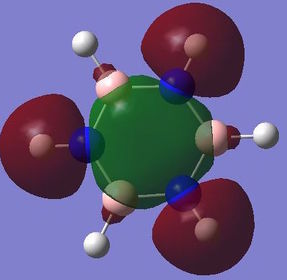
Charge distribution comparison
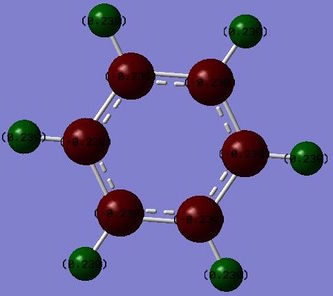
Using NBO with colour range: -0.900 to 0.900
| Benzene | Borazine |
|---|---|
 |
 |
| Charge on carbon: -0.238 | Charge on nitrogen:-1.102
Charge on boron:+0.747 |
| Charge on hydrogen: +0.239 | Charge on hydrogen adjacent to N: +0.432
Charge on hydrogen adjacent to B: -0.077 |
Ng611 (talk) 13:39, 5 June 2018 (BST) For benzene, the charge on the hydrogen is 0.239, while for carbon it's -0.238. This would lead to a residual partial charge of 0.006 for the benzene molecule, but obviously, this isn't the case. Either your charge analysis is performed incorrectly, or you've recorded them incorrectly.
The difference between charges on the atoms in benzene is much smaller than in borazine, illustrating that although the two structures are isoelectric, their relative charge distributions differ. Carbon has an electronegativity of 2.5[5] (based on the Pauling scale) which is slightly higher than that of hydrogen, 2.2. This is seen by the electronic distribution over the C-H bonds of benezene. Carbon has a small negative charge (-0.238) as it draws electron density towards itself and hydrogen has the corresponding positive charge (+0.239) as electron density is drawn away from its centre. The charges balance as overall the molecule has no net charge.
In the case of borazine, the charge distribution is less symmetric as not all the hydrogens are equivalent. The bonding in borazine is aromatic however, it has more ionic character than the bonding in benzene. This is due to the greater difference in electronegativity between the nitrogen and boron atoms[6]. The electronegativity of nitrogen is 3.0 compared with 2.0 for boron therefore, in this system the relative electronegativities are: N>H>B[5]. This explains why N has the greatest negative charge (-1.102), as it is the most effective at drawing electron density towards its centre, the opposite is true for boron which has the greatest positive charge (+0.747) due to its electron deficiency. The hydrogen atoms bonded to boron exhibit a slightly negative charge, as H is more electronegative than B. Whereas, the hydrogen atoms bonded to nitrogen have a positive charge as nitrogen is more electronegative, this magnitude is greater than the negative charge of the hydrogen atoms bonded to B due to the greater difference in electronegativity between H and N. Overall the charges balance as borazine has no net charge.
Ng611 (talk) 13:38, 5 June 2018 (BST) Good discussion of the effects of electronegativity on the overall charge distribution. A more detailed discussion of how the point group affects the charge distribution would improve this section further. It's also interesting to note that the overall charge for each B-H/N-H pair in borazine has the same partial charge.
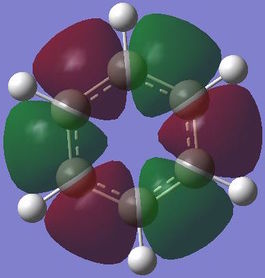
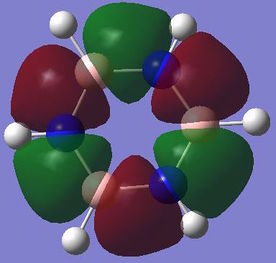
Computed molecular orbital analysis and comparison
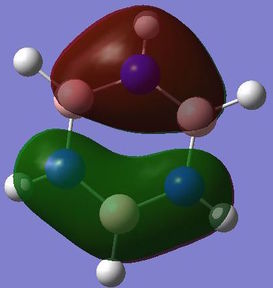
Benzene and borazine both have 21 filled molecular orbitals consisting of: three π MOs, 12 σ MOs, and 6 core non bonding orbitals. Although the combination of filled orbitals was the same, the size and relative energies of those orbitals differed:
Aromaticity
Aromaticity can be observed in planar, ring-systems exhibiting unsaturation which allows the formation of resonance forms (obeying Hückel's rules[7]). This increases the stability of the system to be greater than their olefinic equivalents [8]. The bond lengths of within aromatic systems are at an intermediate length between the shorter, unsaturated bonds and longer saturated bonds. A ring current can also be induced if the system is placed in an external magnetic field, this causes the shielding of the inner protons in 1H NMR[9]. Due to their increased stability, when undergoing reactions it is often favourable for the aromatic ring to remain intact therefore, they tend to undergo aromatic substitution (instead of e.g. addition).
With benzene it has be proposed that the ring is formed of six sp2 hybridised Cs, which each form two C-C σ bonds and one C-H σ bond. The leftover unpaired electron in the Pz orbital is donated to form a delocalised π system above the plane of the ring. This structure goes some way to explaining the reactivity of benzene and other aromatic systems. However, studies have shown that the σ bonding system may have a role to play in the stability of the aromatic system[10]. This would negate the idea that the only contribution into the delocalised system comes form the crossover of orthogonal Pz atomic orbitals. The MO analysis shown above for the π bonding molecular orbital seems to indicate that there may be contributions of electron density from other orbitals. This definition of aromaticity also fails to explain more complex aromatic systems, which involve donation of electron density from orbitals which don't have the same symmetry as the Pz orbital, this is due to the fact that the original definition of aromaticity is based purely on benzene.
Ng611 (talk) 13:42, 5 June 2018 (BST) A good start to a discussion. Some examples of more complex molecules where aromaticity occurs would be useful. Otherwise, good discussion.
References
- ↑ Coates, J. (2006) ‘Interpretation of Infrared Spectra, A Practical Approach’, in Encyclopedia of Analytical Chemistry. doi: 10.1002/9780470027318.a5606.
- ↑ Hunt research group, http://www.huntresearchgroup.org.uk/teaching/teaching_comp_lab_year2a/Tut_MO_diagram_BH3.pdf , (Accessed, May 2018)
- ↑ Hunt research group, http://www.huntresearchgroup.org.uk/teaching/teaching_comp_lab_year2a/9a_bh3nh3_energy.html , (Accessed, May 2018)
- ↑ Ruscic, B. (2015) ‘Active Thermochemical Tables: Sequential Bond Dissociation Enthalpies of Methane, Ethane, and Methanol and the Related Thermochemistry’, Journal of Physical Chemistry A, 119(28), pp. 7810–7837. doi: 10.1021/acs.jpca.5b01346.
- ↑ 5.0 5.1 Allred, A. L. and Rochow, E. G. (1958) ‘A scale of electronegativity based on electrostatic force’, Journal of Inorganic and Nuclear Chemistry. Pergamon Press Ltd, 5(4), pp. 264–268. doi: 10.1016/0022-1902(58)80003-2.
- ↑ L. F, H. and G. W, S. (1961) ‘Borazine Chemistry’, in BORAX TO BORANES, pp. 232–240. doi: doi:10.1021/ba-1961-0032.ch026\r10.1021/ba-1961-0032.ch026.
- ↑ Kikuchi, S. (1997) ‘A History of the Structural Theory of Benzene - The Aromatic Sextet Rule and Huckel’s Rule’, Journal of Chemical Education, 74(2), p. 194. doi: 10.1021/ed074p194.
- ↑ Palusiak, M. and Krygowski, T. M. (2007) ‘Application of AIM parameters at ring critical points for estimation of π-electron delocalization in six-membered aromatic and quasi-aromatic rings’, Chemistry - A European Journal, 13(28), pp. 7996–8006. doi: 10.1002/chem.200700250.
- ↑ Kikuchi, S. (1997) ‘A History of the Structural Theory of Benzene - The Aromatic Sextet Rule and Huckel’s Rule’, Journal of Chemical Education, 74(2), p. 194. doi: 10.1021/ed074p194.
- ↑ Jug, K. and Koster, A. M. (1990) ‘Influence of. sigma. and. pi. electrons on aromaticity’, J. Am. Chem. Soc., 112(6), pp. 6772–6777. doi: 10.1021/ja00175a005.

