Rep:Mod:cej15 Transition States
Introduction
Transition State
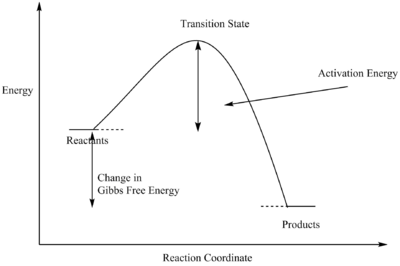
A transition state of a particular reaction is the point where the reaction reaches its maximum potential energy. The activated complex would then either proceed to form the product, or return to its reagents, as shown in the graph. When the gradient in the reaction profile reaches zero and the second derivative is negative, then that represents the transition state.
Potential Energy Surface
The transition state can also be defined as a surface in configuration space that divides reactants from products and passes through the saddle point of the potential-energy surface[1]. The potential energy surface is a three-dimensional illustration of the reaction profile. A saddle point is when the gradient is zero but the second derivatives do not represent maxima or minima.
Nf710 (talk) 10:24, 9 March 2018 (UTC)The PES is Gaussian is 3N-6 dimensions, you should have spoken about that in your explanation and finding stationary points on such a surface.
Exercise 1: Reaction of Butadiene with Ethylene
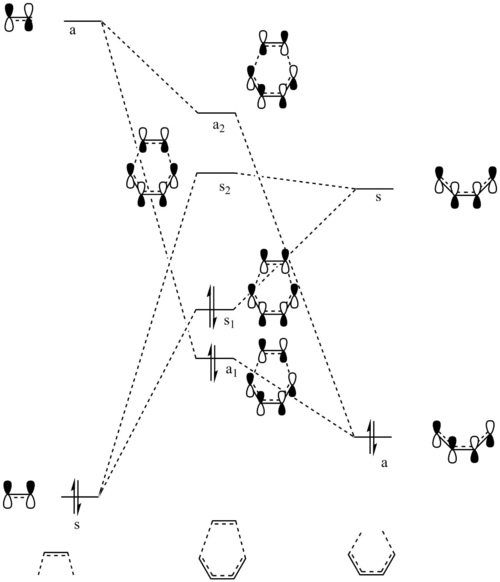
(Fv611 (talk) You did the work, but your discussion lacks a lot of necessary information. You did not discuss the bond lengths in sufficient detail, nor talked about the bond formation mechanism. You also did not label the MOs in your diagram to match your table. Additionally, calling the HOMO-1 orbital the "highest MO" is vague at best.)
Optimisation and Determination of Transition State
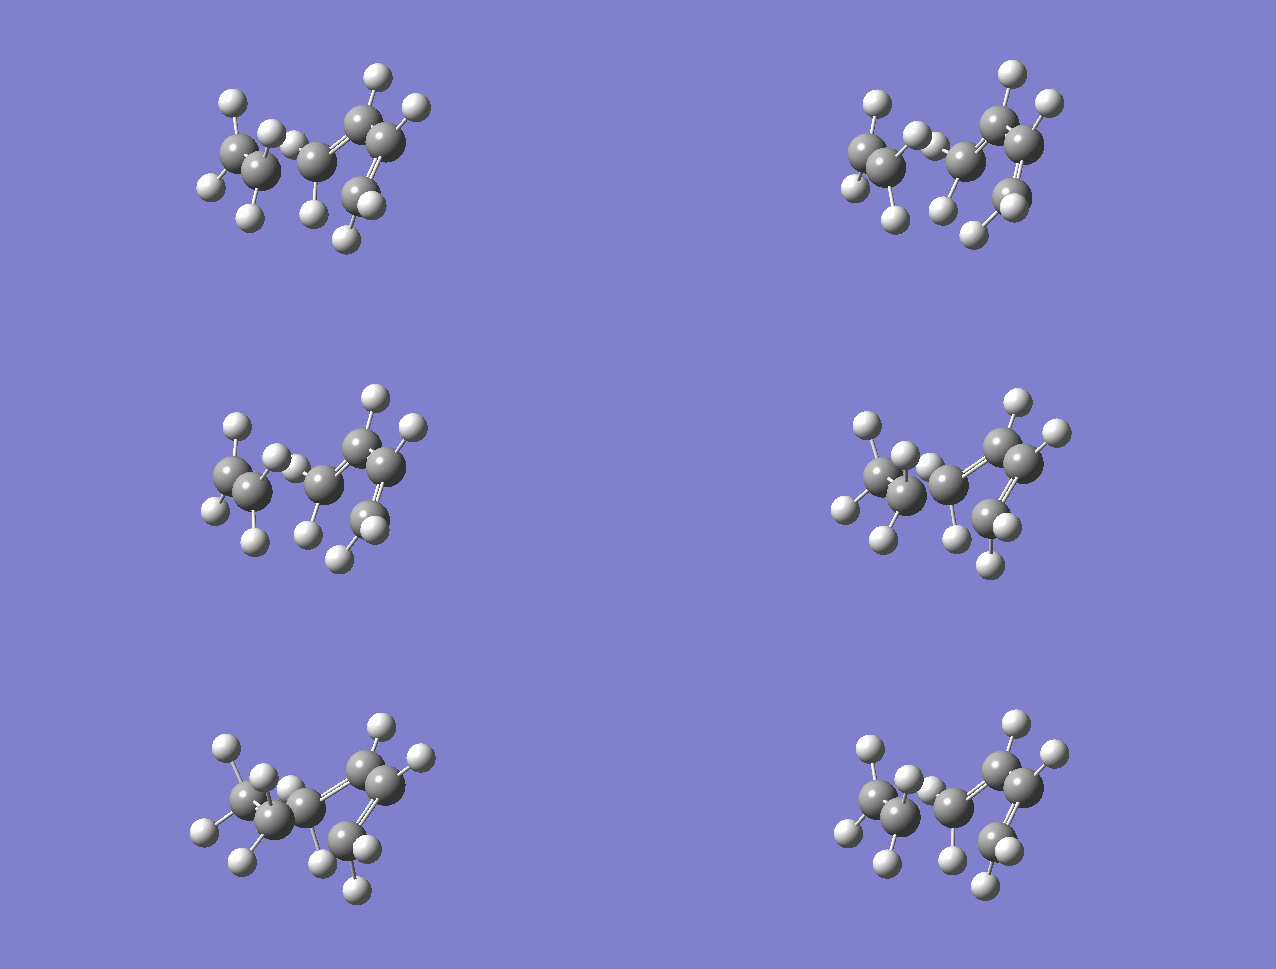
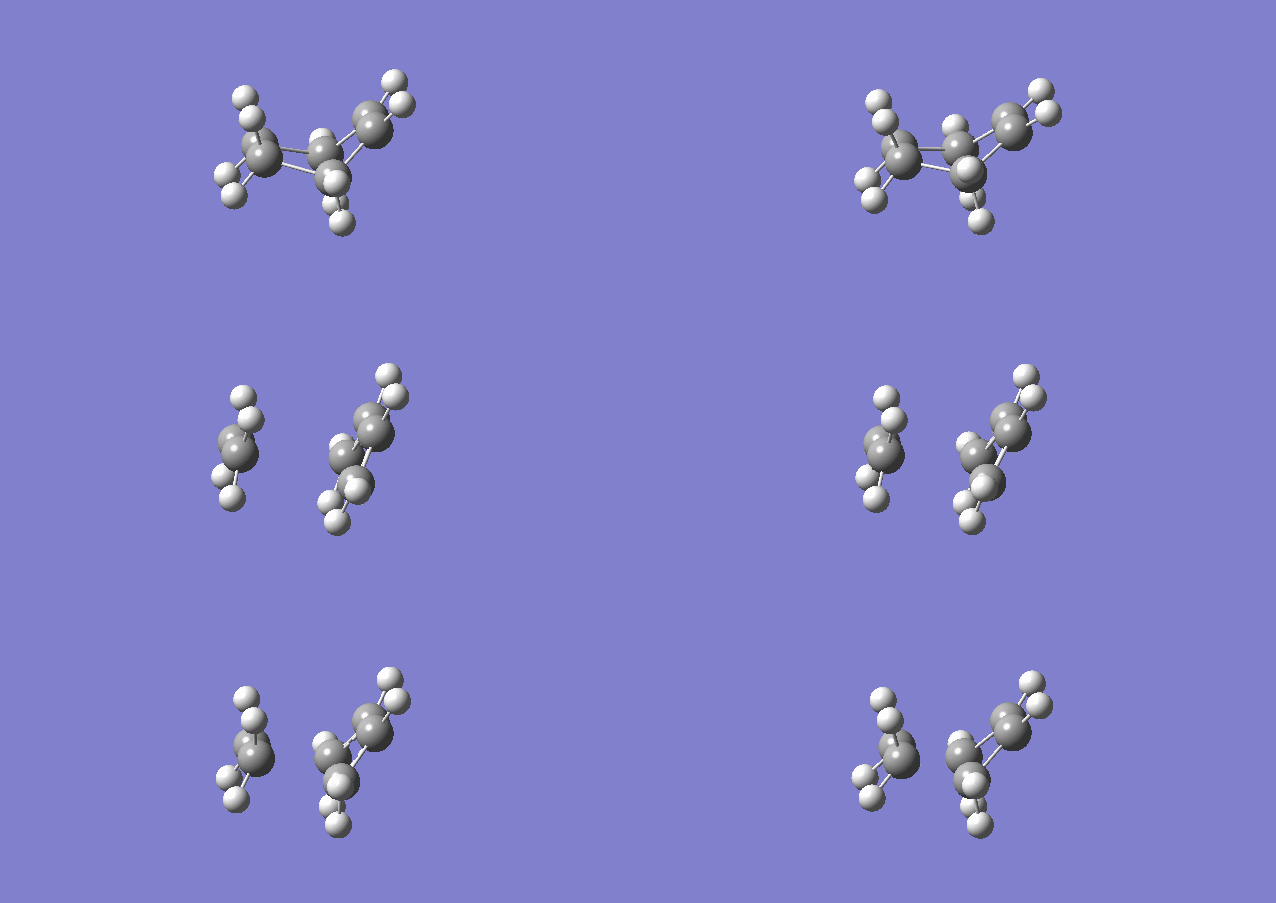
Both structures for the reactants and the structure for the product were constructed in Gaussian and optimised to a PM6 level. The bond lengths and bond angles for the optimised product were altered to resemble the transition state, and this assumed transition state was then optimised to a Berny Transition State. In order to confirm if the transition state was correct or not, frequency calculations were made and the Intrinsic Reaction Coordinate was determined. The frequency of the transition state was -948.65 cm-1 and the gifs for the vibrations and IRC are shown below.
| Vibrations | IRC |
|---|---|
 |
|
MO Analysis
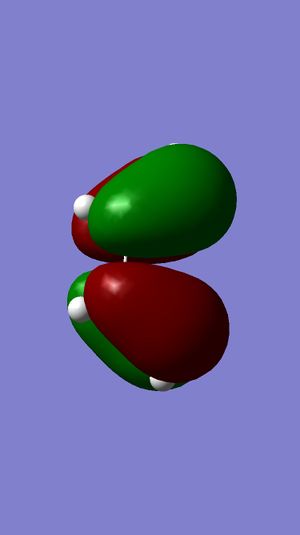
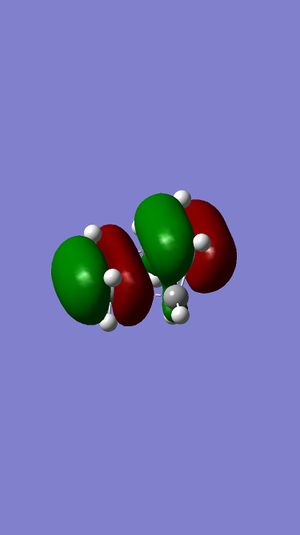
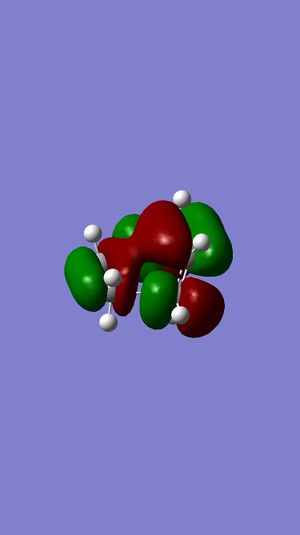
For two molecular orbitals to interact, they must be of the same symmetry, which could also be shown in the table below, meaning that antisymmetric orbitals can only interact with antisymmetric orbitals and same for symmetric ones. This is because MOs would interact to form a non-zero overlap orbital. Mathematically, an antisymmetric function would have an overall integral of zero and combining a symmetric function and an antisymmetric function would produce this result, and this is why this kind of interacting is forbidden. Therefore, symmetric-antisymmetric interactions produce zero overlapping while symmetric-symmetric and antisymmetric-antisymmetric interactions produce non-zero overlaps.
| Ethene MO | 1,3-Butadiene MO | Symmetry | Transition State MOs | MO Diagram |
|---|---|---|---|---|
 LUMO |
 HOMO |
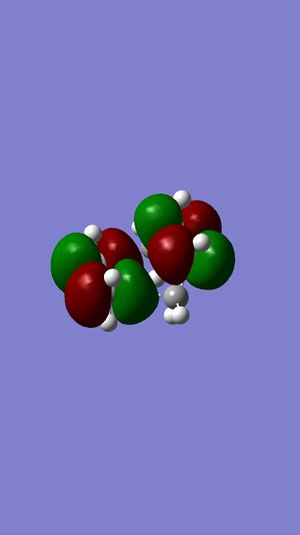 Highest MO |
| |
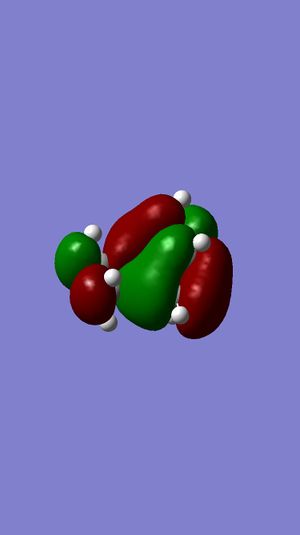 LUMO+1 | ||||
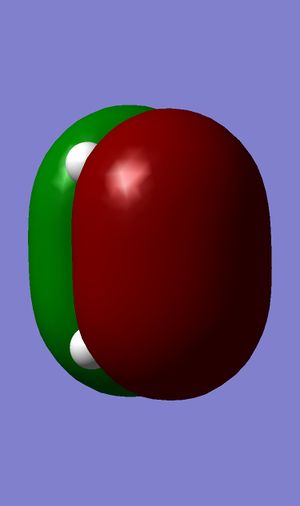 HOMO |
 LUMO |
 HOMO | ||
 LUMO |
Bond Length Analysis
Shown below is a table of the bond lengths for each substance related in this reaction. A typical sp2 C-C bond length is around 147 pm and a carbon double bond is around 133 pm, as shown for the bond lengths for butadiene and ethylene. A typical sp3 C-C bond length is around 154 pm. Shown below is also a graph showing the change in bond lengths during the whole reaction.
| Carbons | Butadiene | Ethylene | Transition State | Product |
|---|---|---|---|---|
| C1-C2 | 134 | 133 | 138 | 149 |
| C2-C3 | 147 | 211 | 154 | |
| C3-C4 | 134 | 138 | 154 | |
| C4-C5 | 211 | 154 | ||
| C5-C6 | 138 | 149 | ||
| C6-C1 | 141 | 133 |
Log File Uploads
Exercise 2: Reactions of Cyclohexadiene and 1,3-Dioxole
Optimisation and Determination of Transition State
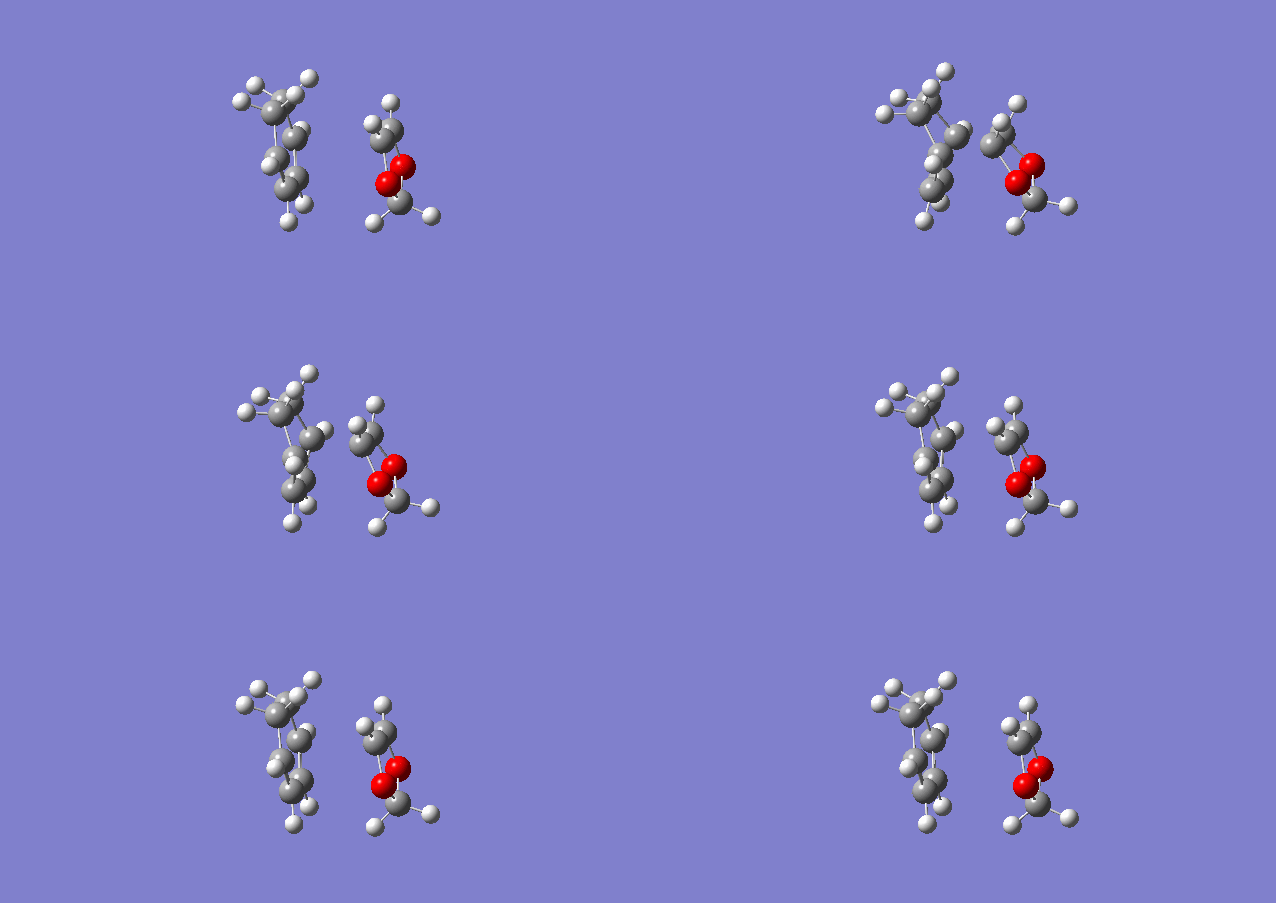
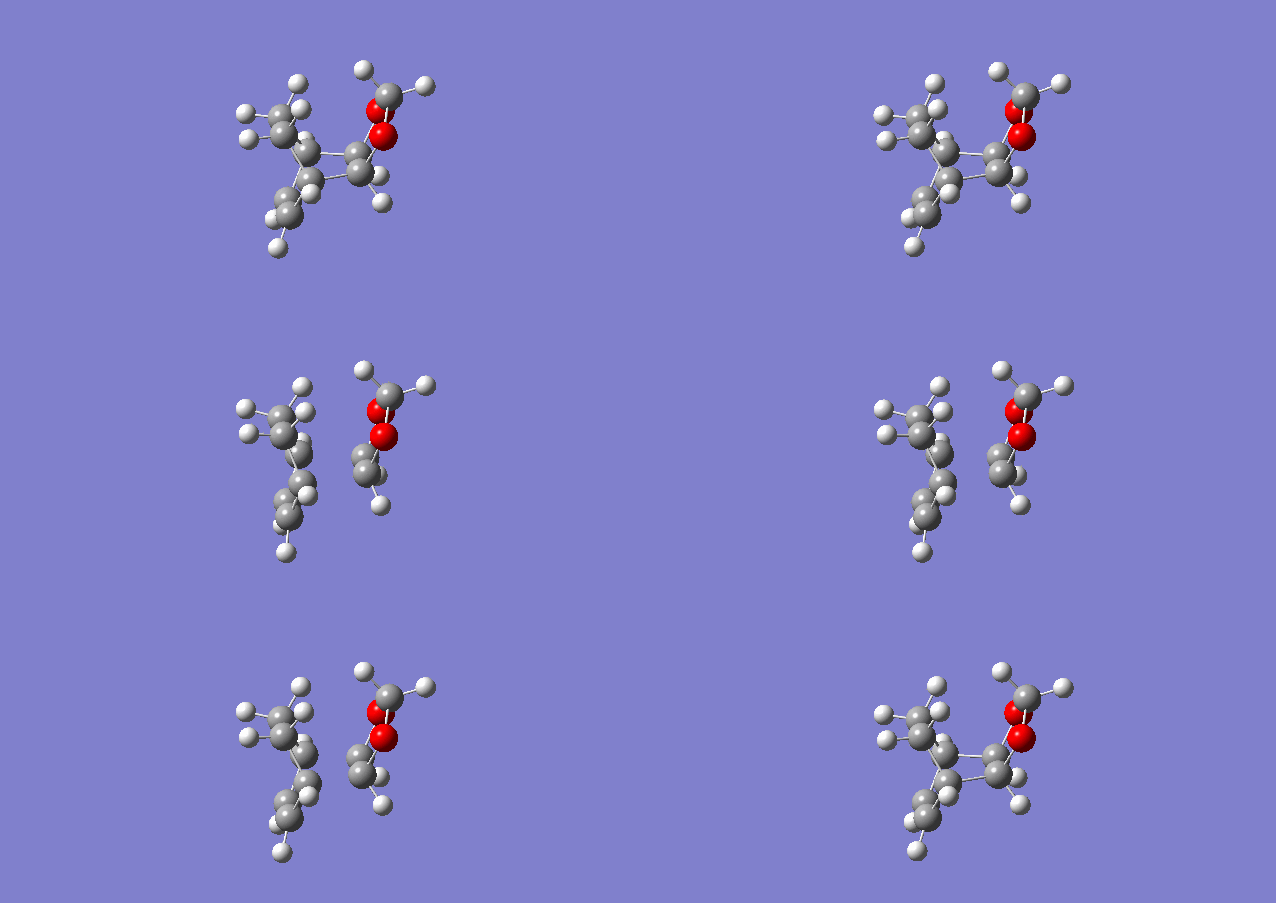
The same procedure was performed for this reaction as that of exercise 1. The vibration frequencies obtained for the endo adduct and the exo adduct are -935.85 cm-1 and -959.61 cm-1. The intrinsic reaction coordinates are shown below.
| Endo Adduct | Exo Adduct |
|---|---|
 |
|
MO Analysis
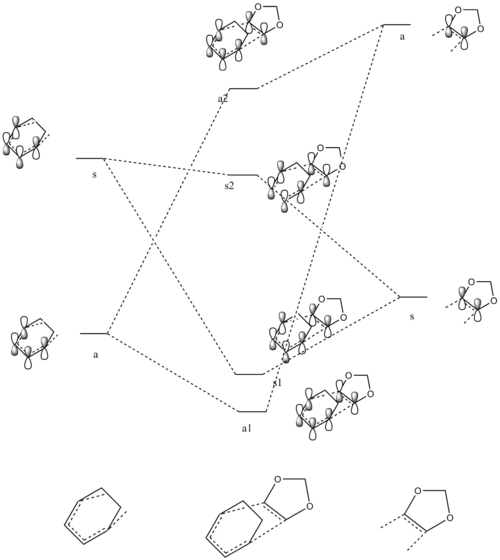
(Fv611 (talk) Unfortunately, the relative energies are not correct in either diagram.)
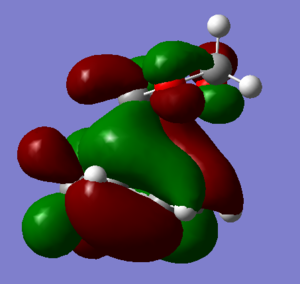
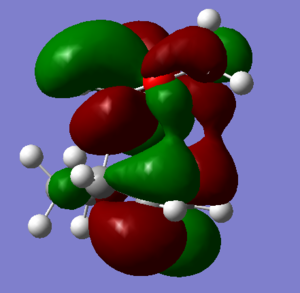
Shown below are the MO digrams of both the endo and exo transition states and the MO orbitals obtained from Gaussview.
| Endo MO diagram | Exo MO diagram |
|---|---|
 |
 |
| Cyclohexadiene MO | 1,3-Dioxole MO | Symmetry | Endo Transition State MOs | Exo Transition State MOs |
|---|---|---|---|---|
 HOMO |
 LUMO |
 LOWER MO |
 LOWER MO | |
 HIGHER MO |
 HIGHER MO | |||
 LUMO |
 HOMO |
 HOMO |
 HOMO | |
 LUMO |
 LUMO |
From comparing the transition state HOMOs for the exo and endo adducts, it can be suggested that the endo adduct is kinetically favoured. This is because there are non-bonding interactions present between the reactive site of cyclohexadiene and the p-orbitals of the oxygen atoms on the 1,3-dioxole. This would stabilise the transition state and reduce its energy.
Energies and Analysis
| Compound | ||
|---|---|---|
| Reactant | Cyclohexadiene | -233.32 |
| 1,3-Dioxole | -267.07 | |
| Product | Exo Diels-Alder Adduct | -500.43 |
| Endo Diels-Alder Adduct | -500.42 |
The table to the right shows the sum of electronic and thermal free energies of the reactants and the products. This can be used to calculate the change in the standard Gibbs Free Energy for both reactions using the equation below:
which turns out to be:
for the exo adduct and,
for the endo adduct.
The two is very similar as shown, with a very small difference of 0.01 kJ/mol. This suggests that both is favourable, but due to the fact that the exo adduct did have a larger change in gibbs free energy, the exo adduct is supposed to be more thermodynamically stable, while the endo adduct is more kinetically stable. This could be due to the endo adduct having better orbital overlaps than the exo adduct, but the exo adduct reduces repulsion more than the endo adduct.
The activation energy was also calculated by using the energies for the reactants and the energies at the transition state. Results for the activation energy of the endo and exo adducts are shown below respectively:
As the activation energy values for both are the same at 2 decimal places, both transition states are very similar in stability.
Nf710 (talk) 10:46, 9 March 2018 (UTC) OK so you havent converted your energies from hartrees to KJ/mol and have theorefore got the wrong answers. Furthermore you havent given enough decimal places, If you look at the conversion from hartrees to kJmol. Furthermore you havent spoken about the electron demand of the or given a detailed answer with diagrams of why the thermo and kenetics product are as they are,
Log File Uploads
Transition State for Endo Product
Transition State for Exo Product
Intrinsic Reaction Coordinate of Endo Product
Intrinsic Reaction Coordinate of Exo Product
Exercise 3: Diels-Alder vs Cheletropic
Optimisation and Determination of Transition State
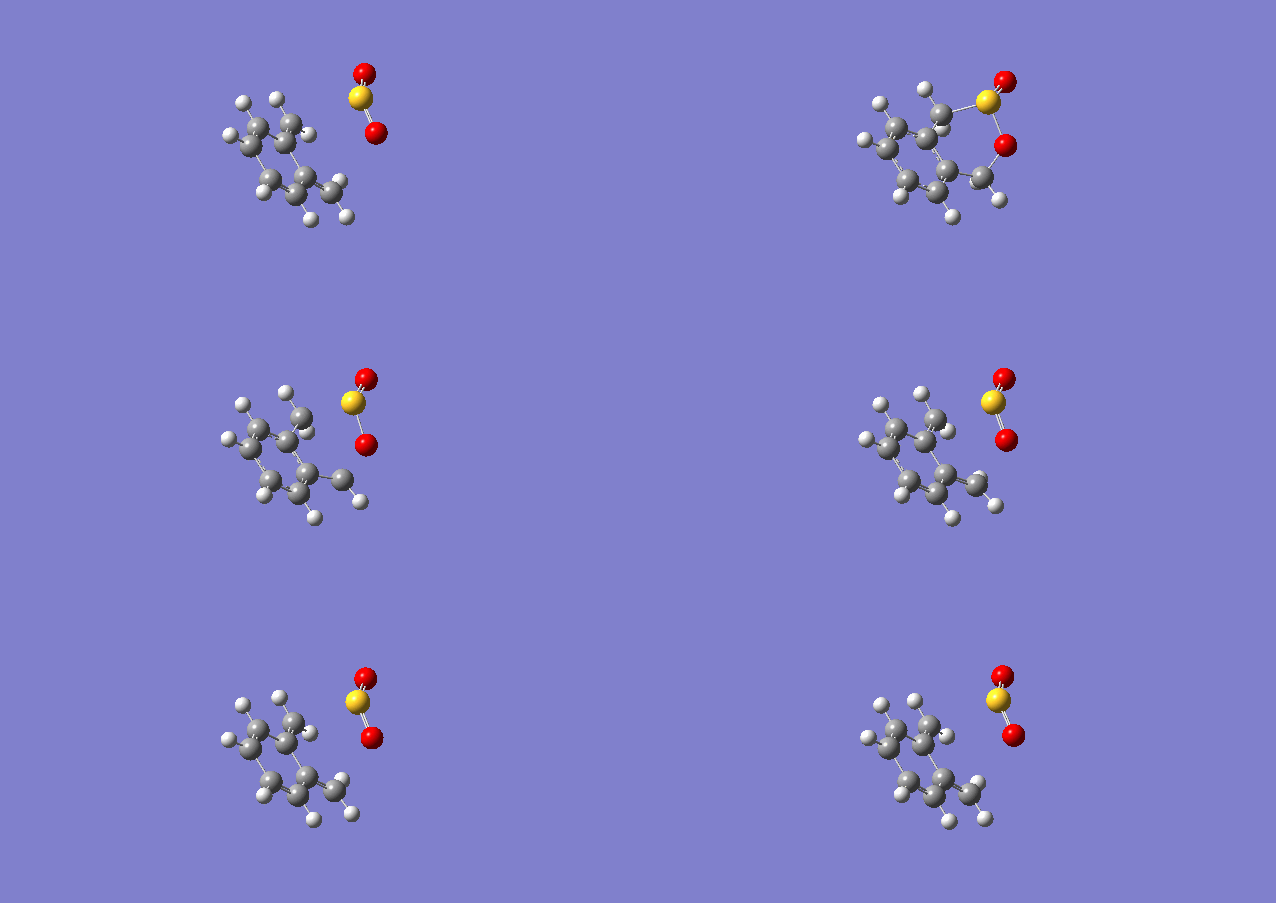
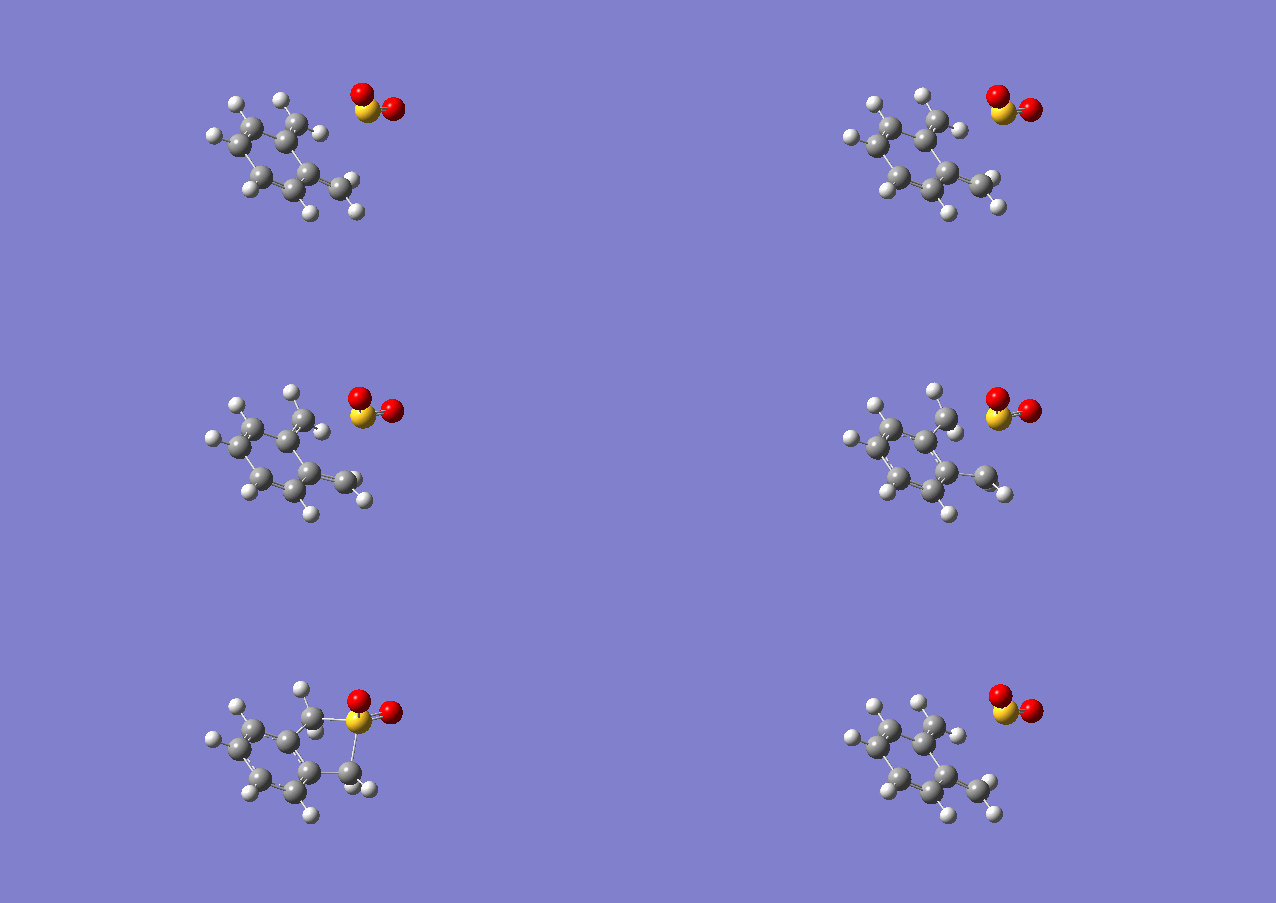
The transition states for the Diels-Alder reaction and the Cheletropic product were both determined and optimised and had vibrational frequencies of -351.62 cm-1 and -486.44 cm-1 respectively. Shown below are the intrinsic reaction coordinates of the two reactions.
| Diels-Alder | Cheletropic |
|---|---|
 |
|
Energies and Analysis
| Compound | ||
|---|---|---|
| Reactant | Xylylene | -309.50 |
| Sulfur Dioxide | -548.60 | |
| Product | Diels-Alder | -853.60 |
| Cheletropic | -853.53 |
(The energies quoted by Gaussian are in Hartree/particle. You have also swapped over activation and reaction energies. It seems that your product was the wrong structure (wrong number of atoms probably?). Unfortunately you've uploaded the PM6 geometries instead so I can't see what's happened. There is also the endo-DA reaction you've missed Tam10 (talk) 12:04, 7 March 2018 (UTC))
The energy values of the reactants and products are shown in the table on the right. The same method of calculation was used as that of the previous exercise and the results are shown in the table below.
| Diels-Alder Product | + 4.50 | +0.01 |
| Cheletropic Product | +4.57 | + 0.03 |
The differences between the two are also very small but it could still be seen that the Diels-Alder product was more favourable as the change in free energy is more negative than that of the cheletropic product. The general energy profiles of the two can be shown in the graph below.
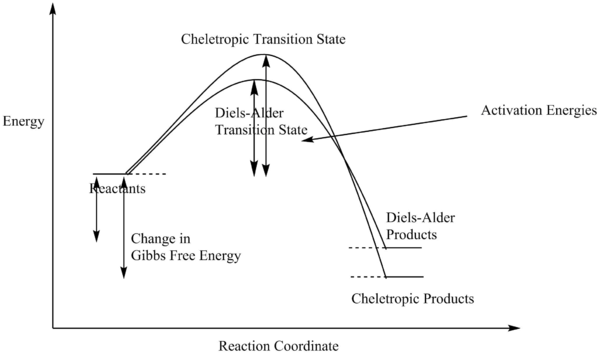
(This diagram doesn't correspond to the data you have provided Tam10 (talk) 12:04, 7 March 2018 (UTC))
Log File Uploads
Diels-Alder Intrinsic Reaction Coordinate
Cheletropic Intrinsic Reaction Coordinate
- ↑ Donald G. Truhlar, and Bruce C. Garrett Acc. Chem. Res., 1980, 13 (12), pp 440–448

