Rep:Mod:ccmodule2
Module 2: Chandra Chadalawada
Introduction
Investigating bonding in inorganic compounds can be more complicated than in organic compounds due to many factors including the ionic nature of many compounds, the larger number of electrons in the system and the relative insensitivity of many inorganic nuclei to spectroscopic techniques such as NMR. Fortunately, computational techniques can be used to model such compounds to a relatively high degree of accuracy. These techniques usually revolve around solving the Schrondinger equation for the electronic wavefunctions. Doing this analytically is almost impossible due to extreme complexity of many electron systems due to the huge number of electrons. However, by separating the electronic and nuclear wavefunctions using the Born-Oppenheimer approximation and approximating the electronic wavefunctions using a basis set and minimising the energy of the system the properties of inorganic systems can be calculated to a relatively high degree of accuracy. The accuracy of such methods, however depends on the basis sets and the methods used to calculate the minimum.
Optimisation of BH3
H3 was investigated using the Gaussview program for Windows. The trigonal planar BH3 molecule was constructed with the bond lengths all set to 1.5Å. The structure was investigated using the B3LYP method and the 3-21G basis set. The below summary of results was generated.
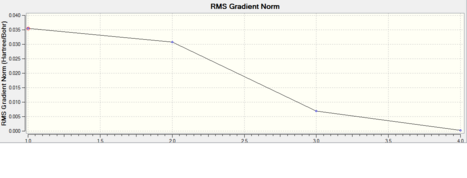
The success of the calculation can be roughly gauged using the gradient; a minima would have a gradient of 0. As can be seen the gradient is 0.00020672, implying a minimum has been generated. The spin state is a singlet, agreeing with LCAO theory (to be discussed later). The lack of a dipole moment is in agreement with the trigonal planar geometry expected. It is important to note, though a final energy in atomic units has been generated, this is specific to the method used and cannot be easily compared with the total energy of other molecules. Further information can be gleaned with reference to the text output which is reproduced below:
Item Value Threshold Converged?
Maximum Force 0.000413 0.000450 YES
RMS Force 0.000271 0.000300 YES
Maximum Displacement 0.001610 0.001800 YES
RMS Displacement 0.001054 0.001200 YES
Predicted change in Energy=-1.071764D-06
Optimization completed.
-- Stationary point found.
----------------------------
! Optimized Parameters !
! (Angstroms and Degrees) !
-------------------------- --------------------------
! Name Definition Value Derivative Info. !
--------------------------------------------------------------------------------
! R1 R(1,2) 1.1935 -DE/DX = 0.0004 !
! R2 R(1,3) 1.1935 -DE/DX = 0.0004 !
! R3 R(1,4) 1.1935 -DE/DX = 0.0004 !
! A1 A(2,1,3) 120.0 -DE/DX = 0.0 !
! A2 A(2,1,4) 120.0 -DE/DX = 0.0 !
! A3 A(3,1,4) 120.0 -DE/DX = 0.0 !
! D1 D(2,1,4,3) 180.0 -DE/DX = 0.0 !
--------------------------------------------------------------------------------
GradGradGradGradGradGradGradGradGradGradGradGradGradGradGradGradGradGrad
This shows the bond lengths ,which are all 1.1935Å, and the bond angles, which are all 120o. Further evidence to the success of the calculations is shown by the derivatives of the bond lengths and angle which are all almost 0. The D1 value of 180o tells us the molecule is planar, as expected. Further information can be gathered from the below graphs.
Vibrations of BH3
The success of the calculation was evaluated using the summary energy of the calculation which is reproduced below
Part of the text output is reproduced below:
Low frequencies --- -0.6560 -0.0170 -0.0018 20.2020 21.4873 21.4974
Low frequencies --- 1145.7147 1204.6590 1204.6600
Harmonic frequencies (cm**-1), IR intensities (KM/Mole), Raman scattering
activities (A**4/AMU), depolarization ratios for plane and unpolarized
incident light, reduced masses (AMU), force constants (mDyne/A),
and normal coordinates:
1 2 3
A2" E' E'
Frequencies -- 1145.7147 1204.6590 1204.6600
Red. masses -- 1.2531 1.1085 1.1085
Frc consts -- 0.9691 0.9478 0.9478
IR Inten -- 92.6991 12.3789 12.3814
Atom AN X Y Z X Y Z X Y Z
1 5 0.00 0.00 0.16 0.00 0.10 0.00 -0.10 0.00 0.00
2 1 0.00 0.00 -0.57 0.00 0.08 0.00 0.81 0.00 0.00
3 1 0.00 0.00 -0.57 0.38 -0.59 0.00 0.14 -0.38 0.00
4 1 0.00 0.00 -0.57 -0.38 -0.59 0.00 0.14 0.38 0.00
4 5 6
A1' E' E'
Frequencies -- 2592.7908 2731.3087 2731.3094
Red. masses -- 1.0078 1.1260 1.1260
Frc consts -- 3.9918 4.9491 4.9491
IR Inten -- 0.0000 103.8370 103.8302
Atom AN X Y Z X Y Z X Y Z
1 5 0.00 0.00 0.00 0.11 0.00 0.00 0.00 0.11 0.00
2 1 0.00 -0.58 0.00 0.02 0.00 0.00 0.00 -0.81 0.00
3 1 0.50 0.29 0.00 -0.60 -0.36 0.00 -0.36 -0.19 0.00
4 1 -0.50 0.29 0.00 -0.60 0.36 0.00 0.36 -0.19 0.00
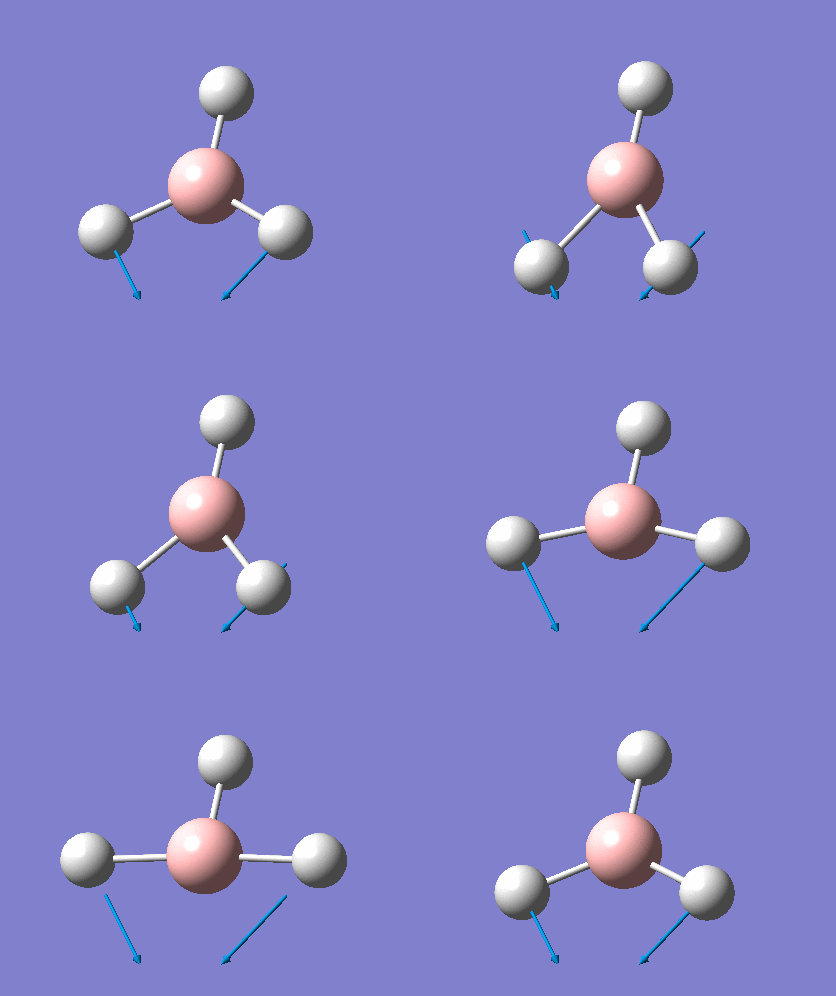
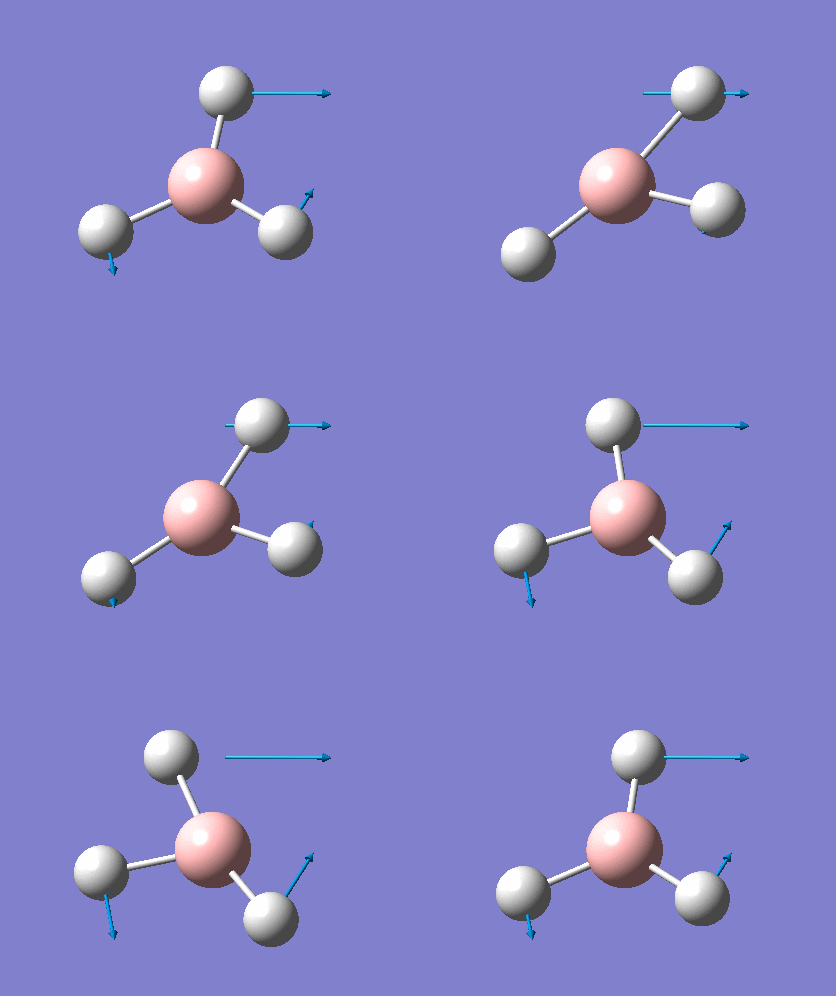
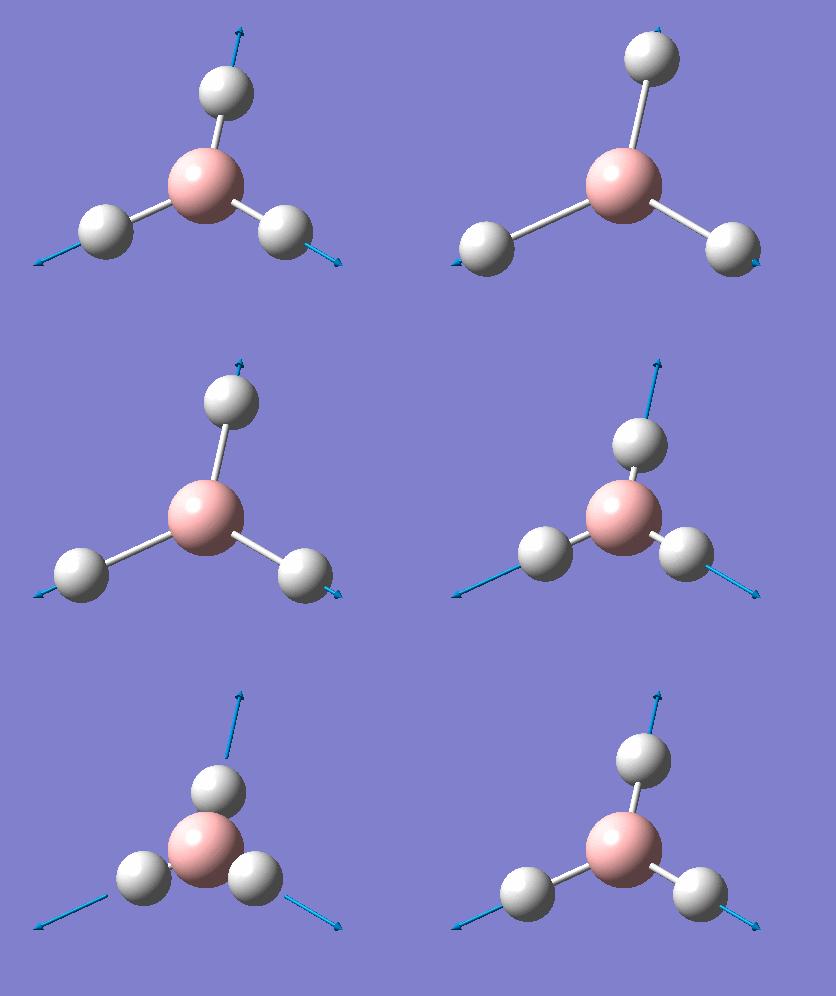
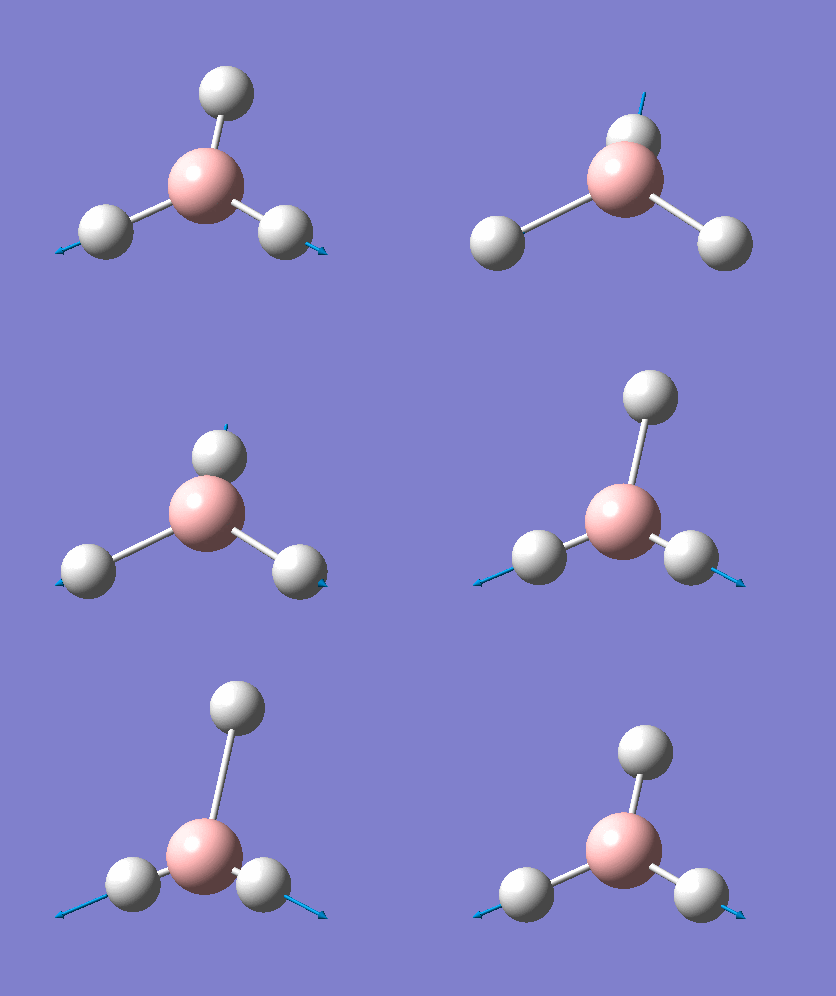
As can be seen the low frequencies are very close to 0. Negative frequencies of a large magnitude would also imply the calculation was unsuccessful as negative frequencies are indicative of a transition state. The negative sign implies the state can get more stable from the point found and at an enery minimum this cannot be possible. There are 6 vibrational modes as predicted by the 3N-6 rule (12-6), however the predicted IR spectrum (below) only shows 3 peaks. This can be explained with reference to the character tables. Vibrations 5 and 6 are degenerate and so are vibrations 2 and 3. Furthermore vibration 4 has an intensity of 0 due to the lack of a net dipole moment in a symmetric stretch. The varation in intensities can be ascribed to the changes in dipole moment in each mode. The larger the net change in dipole moment, the greater the intensity of the vibration mode. As can be seen from the animation, the net change for vibrations 2 and 3 is very small. This is likely to lead to difficulties in viewing these peaks experimentally.
Molecular Orbitals of BH3
LCAO provides a highly useful method for the approximation of molecular orbitals. Experimentally they are very difficult to assertain so quantative computational techniques are extremely useful for critique of the qualatative LCAO theory. Therefore the molecular orbitals for BH3 will be calculated using Gaussian and contrasted with MO's generated using LCAO theory.
Firstly the MO diagram is reproduced for BH3
http://www.huntresearchgroup.org.uk/teaching/teaching_MOs_year2/L3_Tut_MO_diagram_BH3.pdf
The MO's for BH3 will now be reproduced and individually compared with the LCAO equivalents. The same method and basis set used in the optimisation will be used.
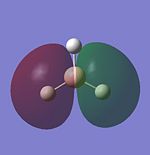
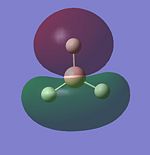
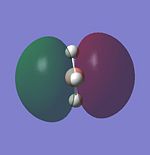
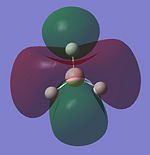
The power of the LCAO approach is shown clearly. The energies and degeneracies of the MO's predicted by LCAO were reflected well in the Gaussian MO's. The only significant differences arose in the LUMO+1,+2 and +3 MO's where the ordering was different from the LCAO method. However this ordering is very tentative as the stronger s-s interactions can lead to greater destabilisation of the 3a'1 orbital but similarly the contributing AO's are of a lower energy than the 2e' orbtial leading the relative stabilisation. This difficulty in ordering is reflected in the very similar energies of . Guassian suggests the 2e' orbitals are of higher energy and this is confirmed experimetally. The propensity BH3 to act as a lewis acid is also reflected; the LUMO is still of a low energy (1.6eV as calculated using AM1). This compares well to the energy calculated BLAH BALH
The chemist's electronic book of orbitals
By Tim Clark, Rainer Koch
NBO analysis
A NBO analysis can tell us many useful things about the molecule. The natural bonding orbitals are the orbitals produced by Gaussian through combination of the atomic orbitals. The atomic basis set is first transformed into natural atomic orbitals which are transformed into natural bonding orbitals. The occupancy of the natural bonding orbitals tells us the charge distribution of the molecule. This is especially useful for BH3 as it is a strong Lewis acids and the computational results should show this. Therefore a NBO analysis will be performed.
The same method and basis set used in the optimisation will be used. The graphical results of the NBO analysis are reproduced below:
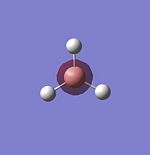
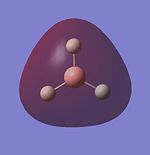
The NBO analysis shows the low electron density on the central boron atom in comparison to the electron density of the hydrogen atoms qualatively with the bright green and red colours of the respective atoms and quantatively with a charge of 0.331 reported for boron and a charge of -0.110 reported for each hydrogen atom. Essentially these charges tell us the difference between the lewis structure of the molecule and the real structure; positive deviations tell us the atom is deficient of electrons and the converse is true for negative deviations.
The text output of the NBO analysis is reproduced.
Summary of Natural Population Analysis:

                                      Natural Population
               Natural  -----------------------------------------------
   Atom  No    Charge         Core      Valence    Rydberg      Total
-----------------------------------------------------------------------
     B    1    0.33126      1.99904     2.66970    0.00000     4.66874
     H    2   -0.11042      0.00000     1.11010    0.00032     1.11042
     H    3   -0.11042      0.00000     1.11010    0.00032     1.11042
     H    4   -0.11042      0.00000     1.11010    0.00032     1.11042
=======================================================================
  * Total *    0.00000      1.99904     6.00000    0.00097     8.00000
We can see in more detail the origins of the charges. The 2 core electrons of boron, as expected are barely affected. As discussed in the molecular orbital section, these 2 electrons are too low in energy to interact with the hydrogen atoms, so the core electron charge is almost 2. The valence electrons interact strongly hence the large charge. The NBO analysis can also tell us the relative contributions of each orbital to the bonds found in the molecule.
      (Occupancy)   Bond orbital/ Coefficients/ Hybrids
---------------------------------------------------------------------------------
    1. (1.99851) BD ( 1) B   1 - H   2
               ( 44.49%)   0.6670* B   1 s( 33.33%)p 2.00( 66.67%)
                                           0.0000  0.5774  0.0000  0.0000  0.0000
                                           0.8165  0.0000  0.0000  0.0000
               ( 55.51%)   0.7451* H   2 s(100.00%)
                                           1.0000  0.0000
    2. (1.99851) BD ( 1) B   1 - H   3
               ( 44.49%)   0.6670* B   1 s( 33.33%)p 2.00( 66.67%)
                                           0.0000  0.5774  0.0000  0.7071  0.0000
                                          -0.4082  0.0000  0.0000  0.0000
               ( 55.51%)   0.7451* H   3 s(100.00%)
                                           1.0000  0.0000
    3. (1.99851) BD ( 1) B   1 - H   4
               ( 44.49%)   0.6670* B   1 s( 33.33%)p 2.00( 66.67%)
                                           0.0000  0.5774  0.0000 -0.7071  0.0000
                                          -0.4082  0.0000  0.0000  0.0000
               ( 55.51%)   0.7451* H   4 s(100.00%)
                                           1.0000  0.0000
    4. (1.99904) CR ( 1) B   1           s(100.00%)
                                           1.0000  0.0000  0.0000  0.0000  0.0000
                                           0.0000  0.0000  0.0000  0.0000
    5. (0.00000) LP*( 1) B   1           s(100.00%)
    6. (0.00000) RY*( 1) B   1           s(  0.00%)p 1.00
This analysis shows boron has sp2 hybridisation as expected emperically shown by the 1:2 ratio of the s and p orbitals in the bonds. The contribution of each atom to the bond is also shown above. The boron orbital contribution to the 44.49% and the contribution by each hydrogen is 55.1%
The LCAO evaluation of BH3 shows there is no mixing and this is supported by the Second Order Pertubation theory results reproduced below: Second Order Perturbation Theory Analysis of Fock Matrix in NBO Basis
    Threshold for printing:   0.50 kcal/mol
                                                                             E(2)  E(j)-E(i) F(i,j)
        Donor NBO (i)                     Acceptor NBO (j)                 kcal/mol   a.u.    a.u.
===================================================================================================
within unit  1
  4. CR (   1) B   1                / 10. RY*(   1) H   2                    1.51    7.55    0.095
  4. CR (   1) B   1                / 11. RY*(   1) H   3                    1.51    7.55    0.095
4. CR ( 1) B 1 / 12. RY*( 1) H 4 1.51 7.55 0.095 5.
Significant mixing would result in lager energy coefficients so it is reasonable to say there is no siginificant mixing in BH3, as implied by LCAO.
Optimisation of TlBr3
The larger size of Thallium and Bromine relative to boron and hydrogen neccessitating the use of psuedo potentials. The complicated effects of the motions of the core electrons are replaced with a psuedopotential, with direct modification of the Schrodinger equation. Furthermore, if the core electrons were all included the cost in computer time would be extremely large as a very large basis set would be required. A psuedo potential models the core electrons as being fixed with only the valence electrons dealt with directly.
The method used will still be B3LYP but a LanL2DZ basis set will be used. This uses a Los Alamos psuedo potential on heavier elements. Thallium’s large size neccessitates the use of restriction of the symmetry. Unless the symmetry is restricted, there will be a large number of available geometries, leading to a large number of vibrational modes. There will be a large number of geometries available due to the diffuse nature of the bonding orbitals, meaning the usual repulsive interactions which usually restrict the geometry will be largely reduced, allowing many unusual geometries to be formed which would have unusual dipole moment changes, causing a large number of vibrational modes to be generated.
The optimised structure is reproduced below
The bond lengths generated were 2.65A and the bond angles were
The summary of the calculation is reproduced below:
A frequency analysis was carried out on the optimised molecule in order to assess the validity of the analysis. The log file of the frequency analysis shows the low frequency vibrations are very close to 0 (VALUES)
Guassian is a very capable program but lacks intelligence. Often in inorganic compounds the bonds will be left out from the optimised structure as the bond lengths are beyond the parameters set by Gaussian defining a bond. This does not mean there is not a bond and the details of the bond are still visible in the NBO analysis log file. This is due to the fact Gaussian is usually used for organic molecules which have smaller bond lengths. For example, a C-C bond varies from 120-154ppm whilst the bond lengths for a molybdenum-phosphorous bond are approximately double this.
A bond is the attraction between 2 atoms due to the high electron density between the 2 nuclei. There is a coulombic interaction between the 2 positively charged nuclei and the shared negatively charged electron density which requires energy to be broken. This is the case in a covalent bond which is formed if the electronegativies are roughly equal. Difference in the electronegativity causes the bond to be polarised, leading to a partial charge on both speceis. In an ionic bond, the situation is slightly different; the large difference in electronegativity causes the electrons to be fully located on the more electronegative atom meaning one atom has a full negative charge and the other has a full positive charge. Coloumbic attaction holds them together. These are the simplest types of bonds, however there are many others such as 2 centre- 3 electron bonding, aromatic bonding and metallic bonding which require wavefunctions for a full description. Generally, here the electrons are delocalised over the system but the general principle of electrostatic attraction holds.
Optimisation of Mo(Co)4L2
In this section the cis and trans isomers of an octahedral molybdenum complex will be investigated using optimisation and generation of the IR spectrum. The molecules under study are cis-tetracarbonyl-bistrichlorophosphine-molybdenum and trans- tetracarbonyl-bistrichlorophosphine. The complexity of these molecules means that 2 optimisations must be carried out. The first optimisation used the LANL2MB basis set which accurately optimises many of the structual features of the molecule, however to ensure the dihedral angles are accurately described a LANL2DZ basis set must be used. Using 2 methods reduces the computing cost of calcualtion
Mini project
In this project the structure and bonding of chloroaluminate ionic liquids will be compared and contrasted with the structure and bonding in flouroaluminate ionic liquids. The molecules to be investigated will be AlCl3, Cl-, AlCl4-, Al2Cl7-, AlF3, F-, AlF4-, Al2F7-. The bond lengths, angles and dipole moments will be compared and the nature of the bonding in each structure will also be investigated. The molecular orbitals of the molecules will also be compared.
Introduction
Ionic liquids are ionic salts in the liquid state. In the liquid state the usually strong ionic bonds between the anion and cations are weakened considerable, allowing use as solvent due to their liquid state. Such ionic liquids are very versatile and strong solvents with chloroaluminate solvents able to dissolve substances such as C60, kerogen and many polymers. Simple ionic salts such as ones from [EtNH3] and [NO3] are formed of a single species. However chloroaluminate and fluouroaluminate ionic liquids consist of a range of species. The properties of the ionic liquid is dependent on the properties of each individual speceis so it is very useful to calculate the properties of the individual species. This is especially relevant as ionic liquids are promising green solvents which are poised to reduce the huge environmental impact of organic solvents the near future. All calculations will be performed using an MP2 method and a 6311G (d,p) basis set to ensure high accuracy and comparibility of results. An initial optimisation will be performed using a low level basis set and method (B3LYP and LANL2MB) to reduce computing time and increase accuracy. Overall, first an optimisation will be performed, then an NBO analysis, followed by a vibration analysis for each compound to ensure a minimum is found .
Important notes: The queue for the SCAN system was extremely long and as a result, all of the below calculations were run on the laptop. As a result it was not possible to publish the results on the d space. Links to the individial log, chk and files are provided at the end of this page. To conserve space on the server, the files have been grouped by experiment and “zipped”.
AlCl3
A summary of the results for the initial B3LYP optimisation is given below.
| Optimised structure | Bond length (A) | Bond angle | Energy | Gradient |
| 2.32 | 120 | -46.91 | 0.00000729 |
A summary of the results for the final MP2 optimisation is given below.
| Optimised structure | Bond length (A) | Bond angle | Energy | Gradient |
| 2.07 | 120 | -1621.12 | 0.00001140 |
Both optimisations can be regarded as having gone to completion as the gradient is less than 0.00001.
First it must be noted the 2 energies cannot be compared due to the difference in the method of calculation. Energies generated using a particular method can be compared and the energies of the species in solution will be compared in the conclusion. The bond angles and bond lengths, however can be easily compared. The decrease in the bond length with use of the MP2 method is due to an increase in accuracy; the literature value is 2.06. As expected the dipole moments for both results were 0, reflecting the trigonal planar structure.
Chemical Physics LettersVolume 32, Issue 2, 15 April 1975, Pages 231-232
An NBO analysis will now be performed on the MP2 optimised molecule to investigate the bonding and structure. For clarity text outputs will not be reproduced unless totally necessary due to the large number of orbitals. For further information, I direct you to the log files attached below.
These results are as expected; the aluminium is sp2 hybridised with the bonding orbital having 32.94% s character and 64.16% p character. There is a very small amount of d character (2.09%) which is expected with a good basis set as aluminium is a 3rd row element so the d orbitals are relatively low lying. The chlorine is sp3 hybridised with a 71.74% p character with a 0.21% d character. The high charge of both aluminium and chlorine is expected due to the large difference in electronegativity and this difference in charge is reflected in the charge density diagram below. The bright colours also show visually illustrate the difference well.
File on desktop
AlCl3 is a known lewis acid; in the solid phase it exists almost exclusively as a dimer. This property can be investigated using the molecular orbital output. The LUMO is reported as having an energy of 0.05104 which is very low, therefore occupancy will not reduce the strength of the bond. The LUMO is reproduced below.
LUMO picture
The vibrational analysis was run to confirm a correct minimum was generated. As can be seen from the log files, no negative low frequencies were calculated supporting the idea a minimum had been found. 6 vibrational modes were found , following the 3N-6 rule and the IR spectrum showed 3 peaks, due to degenaracies found in the D3h point group at 147, 206.66 and 645cm-1.
Cl-
Since Cl- is a single molecule the B3LYP analysis was omitted and the results for the MP2 analysis are reproduced below.
| Optimsed structure | Energy | Gradient |
| -459.70 | 0.0000000000 |
A vibrational analysis was not performed as molecule has no bonds.
The NBO analysis however does show the high energy of the HOMO at -0.14401 which explains the strong lewis base properties of this anion.
AlCl4-
A summary of the results for the initial B3LYP optimisation is given below.
| Optimised structure | Bond length (A) | Bond angle | Energy | Gradient |
| 2.38 | 109.47 | -62.91 | 0.0000000020 |
This structure was then optimised using the MP2 method, generating the below results.
| Optimised structure | Bond length (A) | Bond angle | Energy | Gradient |
| 2.15 | 109.47 | -2080.95 | 0.0000000214 |
The increased energy and bond length are expected; lone pair donation from the Cl- causes a decrease in bond length and an increase in energy relative to AlCl3. The NBO analysis also shows a large change in properties upon coordination of the Cl- ion. The charge density is again similar with the negative charge delocalised onto the chlorine atoms as would be qualatively expected using the electronegativities. The charges on the aluminium and chlorine atoms are also greater in magnitude as would be expected due to the formal negative charge on the molecule. This is shown pictorially below. The increased charges also result in a reduction in the contribution to the bonding orbital for the aluminium atom and an increase for the chlorine. In AlCl3, the contribution is 17.55% and in AlCl4- it is 16.17% for alumium and for the chlorine it is 82.45% in AlCl3 and 83.83% in AlCl4-. The increased negative charge on the chlorine atoms lowers the energy of the valence electrons. The character of the bonding orbitals is dominated by the lower energy orbital; the lower the energy the greater the contribution.
Image on desktop
As expected the aluminium is now sp3 hybridised with a 25% contribution from the s orbital and a 72.07% contribution from the p orbital and 2.93% from d orbitals. This is expected due to the tetrahedral nature of the new complex. The chlorine remains sp3 hybridised with largely the same contributions from the s and p orbitals. The NBO analysis confirms that the charge from the coordinating anion is delocalised over the entire molecule. If it remained localised on that particular anion, this would be clear from the text output and the graphical analysis. If this was the case, one of the chlorine atoms would have a charge of -1 which is not the case. Furthermore the overall dipole moment is still 0 reflecting the symmetrical charge density which would not be present if one chlorine had a full negative charge.
The vibration analysis will also tell us about the success of the optimisation. The Td symmetry of the molecule means the vibrations are very different from the vibrations in AlCl3. By the 3N-6 rule, 9 vibrational modes would be expected. There are 3 sets of degenerate modes due to result with a very small peak at 118, a larger one at 182.41 and a strong peak at 519cm-1. Though it is difficult to compare the absorptions between these and the peaks for the AlCl3 molecule due to the difference in symmetry, all the absorptions in AlCl4- are at a lower frequency than the absorptions in AlCl3. From this we can say the bonds are weaker in AlCl4-, meaning less energy is needed to stretch or bend the bonds. This is expected from the NBO analysis. In AlCl3, the bonds are formed from Alsp2-Clsp3 overlap and in AlCl4- the bonds are formed from Alsp3-Clsp3 overlap. The more diffuse nature of sp3 orbitals leads to a weaker bond and hence lower IR absorption frequencies.
The energy of an individual AlC4- ion is -2080.95 compared to -459.70+-1621.12=-2080.82. This equates to a difference of 0.13au. 1 au=2625kJ/mol, therefore the formation of an AlCl4- ion from an AlCl3 molecule and a Cl- anion results in a stabilisation of 341.25kJ/mol. This large stabilisation implies that in an ionic liquid the reaction would go essentially to completion.
AlF3
Fluorine is a much smaller molcule compared to chlorine so the initial optimisation with the B3LYP method was omitted and only an MP2 calculation was performed. This is because an MP2 calculation is unlikely to require a large amount of computational cost for such a small molecule.
| Optimised structure | Bond length (A) | Bond angle | Energy | Gradient |
| 1.65 | 120.00 | -541.22 | 0.00000023 |
Firstly it must be noted the energies for the fluoro complexes cannot be directly compared with the equivalent chloro complexes as only molecules with exactly the same atoms and bonds can be compared. However, bond lengths, etc. can be compared. The very low gradient implies the optimisation was successful, allowing further analysis. The bond length of 1.65 is shorter than AlCl3. This is due to the increased electronegativity of F, which causes the contributing atomic orbitals to be lower in energy, lowering energy of the bonding orbital which causes a higher bond strength. Furthermore a larger partial charge is present on the F and Al atoms compared to the Cl and Al, meaning there is a greater ionic contribution to the bond; there is columbic attraction between the positively charged aluminium and negatively charged fluorine. This can be seen more clearly in the NBO analysis. The fluorine atoms have a charge of 0.557 compared to a charge of 0.522 on the chlorine with a correspondingly higher charge on the aluminium. This shown pictorially below.
File on desktop
The ratios of p and s contribution appear to be very similar to AlCl3 which is expected. However the contributions to the bond from fluorine at 92.72% compared to 82.45% for chlorine in AlCl3. This shows that the bonding electrons are essentially located on the flourine meaning AlF3 is ionic. In contrast, AlCl3 appears to be covalently bonded but highly polar agreeing well with experimental results. The stronger interactions between the orbitals lead to a marginally more destabilised LUMO with an energy of 0.05869 reported compared to 0.05104 for AlCl3 meaning AlF3 is slightly less lewis acidic agreeing with literature.
The reported dipole is 0, agreeing with the D3h symmetry.
The vibrational analysis contains some very interesting data. Due to the similar point group as for AlCl3, 6 modes were found which caused only 3 absorptions in the IR spectrum at 247, 302 and 980cm-1. Due to the similar point group, each vibration corresponds to the same movement of the atoms so they can be directly compared. The first thing to note is the strong shift to higher wavenumbers for all the absorptions. This reflects the much stronger Al-F bonds which require lots of energy for bending/stretching. Lastly the low frequencies were all around 0 with only 2 negative at -0.0012 and -0.0007 which implies the calculation was a success and a minimum was found.
F-
As for Cl- only the MP2 analysis was performed. The results are shown below:
| Optimsed structure | Energy | Gradient |
| -99.554 | 0.0000000000 |
AlF4-
Initially, when the MP2 analysis was performed the gradient was reported as 0.00016654 which does not correspond to a minimum as it is greater than 0.0001. The calculation was repeated with the same outcome. Therefore the tight convergence criteria were invoked and the below results were generated.
| Optimised structure | Bond length (A) | Bond angle | Energy | Gradient |
| 1.71 | 109.47 | -641.06 | 0.00000005 |
The relationship between AlF3 and Alf4- is very similar to the relationship between AlCl3 and AlCl4-, there is a longer bond length and the energy is larger reflecting occupancy of formally antibonding orbitals. The NBO analysis shows that, as in AlCl4-, there is an increase in the magnitude of the charge with the charge on the fluorine atoms now 0.8 compared to a charge of 0.557 for AlF3. The increase from AlCl3 to AlCl4 is far less dramatic with an increase of 0.552 to 0.5998. However, this could expected as the interactions fluorine, aluminium interactions are far stronger as discussed earlier. Therefore the charge can delocalise better in this complex. The
Al2F7-
The links to the log files are given below
https://wiki.ch.ic.ac.uk/wiki/index.php?title=Image:Alcl3_lanl2mb_opt_files.zip
https://wiki.ch.ic.ac.uk/wiki/index.php?title=Image:Alcl3_mp2_opt_files.zip
https://wiki.ch.ic.ac.uk/wiki/index.php?title=Image:Alcl3_mp2_nbo_files.zip
https://wiki.ch.ic.ac.uk/wiki/index.php?title=Image:Alcl3_mp2_vib_files.zip
https://wiki.ch.ic.ac.uk/wiki/index.php?title=Image:Alcl4_lanl2mb_opt_files.zip
https://wiki.ch.ic.ac.uk/wiki/index.php?title=Image:Alcl4_mp2_opt_files.zip
https://wiki.ch.ic.ac.uk/wiki/index.php?title=Image:Alcl4_mp2_nbo_files.zip
https://wiki.ch.ic.ac.uk/wiki/index.php?title=Image:Alcl4_mp2_vib_files.zip
https://wiki.ch.ic.ac.uk/wiki/index.php?title=Image:Alf3_lanl2mb_opt_files.zip
https://wiki.ch.ic.ac.uk/wiki/index.php?title=Image:Alf3_mp2_opt_files.zip
https://wiki.ch.ic.ac.uk/wiki/index.php?title=Image:Alf3_mp2_nbo_files.zip
https://wiki.ch.ic.ac.uk/wiki/index.php?title=Image:Alf3_mp2_vib_files.zip
https://wiki.ch.ic.ac.uk/wiki/index.php?title=Image:Cl_mp2_opt_files.zip
https://wiki.ch.ic.ac.uk/wiki/index.php?title=Image:Cl_mp2_nbo_files.zip
Pure Appl. Chem., Vol. 72, No. 7, pp. 1391–1398, 2000.


