
Rep:Mod:cbf5a234-49e7-4e4b-9d5d-85cf22add185
Introduction
The aim of this project is to explore the physical nature of ionic liquids, which have application in designing solvents through customisation of the nature of the cation and anion[1]. In this work, a variety of cations have been investigated to identify what trends are present in the variation in central atom and its ligands.
Structures of methyl-ligand complexes
Optimisations
A number of cations have been optimised using Gaussian 09 D.01, namely [N(CH3)4]+, [P(CH3)4]+ and [F(CH3)3]+. All these complexes have been optimised to a DFT B3LYP 6-31G(d,p) level with the int=ultrafine scf=conver=9 keywords and tight convergence - this is as a consequence of behaviour seen in previous work[2] where low frequencies did not exist within a tight range unless these keywords were specified. All calculations were run on the supplied laptop due to a significant queue of jobs on the HPC (except for [S(CH3)3]+ as it took a very long time), and the log files are available here:
- [N(CH3)4]+: media:Pk_log_nch34_opt.log
- [P(CH3)4]+: media:Pk_log_pch34_opt.log
- [S(CH3)3]+: The first attempt did not converge: DOI:10042/26201 . A partially optimised structure was resubmitted as a second attempt: DOI:10042/26205 . This also did not converge so a final optimisation was run on this partially optimised structure with the
nosymmkeyword. This converged: DOI:10042/26214 .
Once done, convergence was verified via inspection of the log file.
Summary outputs
[N(CH3)4]+
File Name	nch34_opt
File Type	.log
Calculation Type	FOPT
Calculation Method	RB3LYP
Basis Set	6-31G(d,p)
Charge	1
Spin	Singlet
E(RB3LYP)	-214.18128421	a.u.
RMS Gradient Norm	0.00000090	a.u.
Imaginary Freq
Dipole Moment	0.0000	Debye
Point Group	TD
Job cpu time:	0 days  0 hours  1 minutes 27.0 seconds.
[P(CH3)4]+
File Name	pch34_opt
File Type	.log
Calculation Type	FOPT
Calculation Method	RB3LYP
Basis Set	6-31G(d,p)
Charge	1
Spin	Singlet
E(RB3LYP)	-500.82701126	a.u.
RMS Gradient Norm	0.00000675	a.u.
Imaginary Freq
Dipole Moment	0.0001	Debye
Point Group	C1
Job cpu time:	0 days  0 hours 24 minutes 21.0 seconds.
[S(CH3)3]+
File Name	sch33_opt3
File Type	.log
Calculation Type	FOPT
Calculation Method	RB3LYP
Basis Set	6-31G(d,p)
Charge	1
Spin	Singlet
E(RB3LYP)	-517.68327460	a.u.
RMS Gradient Norm	0.00000101	a.u.
Imaginary Freq
Dipole Moment	0.9651	Debye
Point Group	C1
Job cpu time:	0 days  0 hours  2 minutes 52.2 seconds.
Convergence outputs
[N(CH3)4]+
         Item               Value     Threshold  Converged?
 Maximum Force            0.000003     0.000015     YES
 RMS     Force            0.000001     0.000010     YES
 Maximum Displacement     0.000014     0.000060     YES
 RMS     Displacement     0.000005     0.000040     YES
 Predicted change in Energy=-1.010077D-10
 Optimization completed.
    -- Stationary point found.
[P(CH3)4]+
         Item               Value     Threshold  Converged?
 Maximum Force            0.000014     0.000015     YES
 RMS     Force            0.000005     0.000010     YES
 Maximum Displacement     0.000026     0.000060     YES
 RMS     Displacement     0.000009     0.000040     YES
 Predicted change in Energy=-1.723206D-06
 Optimization completed.
    -- Stationary point found.
[S(CH3)3]+
Initial failed optimisation:
         Item               Value     Threshold  Converged?
 Maximum Force            0.000017     0.000015     NO
 RMS     Force            0.000006     0.000010     YES
 Maximum Displacement     0.002915     0.000060     NO
 RMS     Displacement     0.000869     0.000040     NO
 Predicted change in Energy=-5.685776D-09
 Optimization stopped.
    -- Number of steps exceeded,  NStep=  61
    -- Flag reset to prevent archiving.
During this failed optimisation, it appears the molecule just spent a large amount of time rotating around the C3 axis through the sulphur.
The final optimisation yielded:
         Item               Value     Threshold  Converged?
 Maximum Force            0.000002     0.000015     YES
 RMS     Force            0.000001     0.000010     YES
 Maximum Displacement     0.000049     0.000060     YES
 RMS     Displacement     0.000018     0.000040     YES
 Predicted change in Energy=-6.520157D-11
 Optimization completed.
    -- Stationary point found.
Frequency analysis
Following this, frequency analysis was conducted with the same keywords and calculation level to ensure a minima has been found. This is ensured by checking there are no negative vibrations in the molecule. Calculations were again run on the laptop, and the log files, summaries, and frequencies are listed below. Actual animations of the modes have not been exported, however a Jmol of the log file is available and the modes can be seen by right clicking and choosing model -> the mode you want to see. This time, a range of -30 to +30 cm-1 has been accepted for the low frequencies as molecules investigated are quite complex, and a relatively simple basis set has been used. Optimising to 6-311G(d,p) would likely bring the frequencies within the range used previously however this would be at the expense of much longer computation times.
- [N(CH3)4]+: media:Pk_log_nch34_freq.log
- [P(CH3)4]+: media:Pk_log_pch34_freq.log
- [S(CH3)3]+: DOI:10042/26273
Summary outputs
[N(CH3)4]+
File Name	NCH34_FREQ
File Type	.log
Calculation Type	FREQ
Calculation Method	RB3LYP
Basis Set	6-31G(d,p)
Charge	1
Spin	Singlet
E(RB3LYP)	-214.18128421	a.u.
RMS Gradient Norm	0.00000085	a.u.
Imaginary Freq	0
Dipole Moment	0.0000	Debye
Point Group	TD
Job cpu time:	0 days  0 hours  3 minutes 17.0 seconds.
         Item               Value     Threshold  Converged?
 Maximum Force            0.000001     0.000450     YES
 RMS     Force            0.000001     0.000300     YES
 Maximum Displacement     0.000009     0.001800     YES
 RMS     Displacement     0.000007     0.001200     YES
 Predicted change in Energy=-1.014288D-10
 Optimization completed.
    -- Stationary point found.
[P(CH3)4]+
File Name	PCH34_FREQ
File Type	.log
Calculation Type	FREQ
Calculation Method	RB3LYP
Basis Set	6-31G(d,p)
Charge	1
Spin	Singlet
E(RB3LYP)	-500.82701149	a.u.
RMS Gradient Norm	0.00000668	a.u.
Imaginary Freq	0
Dipole Moment	0.0001	Debye
Point Group	C1
Job cpu time:	0 days  0 hours 12 minutes 11.0 seconds.
         Item               Value     Threshold  Converged?
 Maximum Force            0.000026     0.000450     YES
 RMS     Force            0.000007     0.000300     YES
 Maximum Displacement     0.001774     0.001800     YES
 RMS     Displacement     0.000659     0.001200     YES
 Predicted change in Energy=-3.008780D-08
 Optimization completed.
    -- Stationary point found.
[S(CH3)3]+
File Name	sch33_freq
File Type	.log
Calculation Type	FREQ
Calculation Method	RB3LYP
Basis Set	6-31G(d,p)
Charge	1
Spin	Singlet
E(RB3LYP)	-517.68327460	a.u.
RMS Gradient Norm	0.00000104	a.u.
Imaginary Freq	0
Dipole Moment	0.9651	Debye
Point Group	C1
Job cpu time:	0 days  0 hours  9 minutes  6.7 seconds.
         Item               Value     Threshold  Converged?
 Maximum Force            0.000003     0.000450     YES
 RMS     Force            0.000001     0.000300     YES
 Maximum Displacement     0.000093     0.001800     YES
 RMS     Displacement     0.000033     0.001200     YES
 Predicted change in Energy=-7.179584D-11
 Optimization completed.
    -- Stationary point found.
Vibration modes
[N(CH3)4]+
 Low frequencies ---    0.0007    0.0011    0.0013   21.5288   21.5288   21.5288
 Low frequencies ---  188.5488  292.6546  292.6546
Right click and use the Model menu to see the available modes
Vibration |
[P(CH3)4]+
 Low frequencies ---  -15.1139   -0.0002    0.0012    0.0012    5.8940   14.7736
 Low frequencies ---  156.2222  191.5376  191.9513
Right click and use the Model menu to see the available modes
Vibration |
[S(CH3)3]+
 Low frequencies ---   -8.5871    0.0029    0.0049    0.0051    5.7111    9.1755
 Low frequencies ---  162.4159  200.3446  200.5391
Right click and use the Model menu to see the available modes
Vibration |
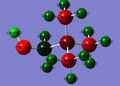
Conclusions on molecular structure
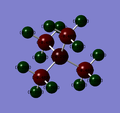
Investigation of structures is focused on the central atom as this is the only point at which variance should occur. The length of the M-C bonds and the angle between C-M-C on each complex is reported below:
| Complex | M-C Length (Å) | Angle (°) | M-C length (lit[3]) (Å) |
|---|---|---|---|
| [P(CH3)4]+ | 1.82 | 109.5 | 1.84 |
| [N(CH3)4]+ | 1.51 | 109.5 | 1.46 |
| [S(CH3)3]+ | 1.82 | 102.7 | 1.79 |
Literature bond lengths are found by adding the covalent radii for the atoms.
Two key trends are:
- As you go down a group, the bond length decreases
- As you go across a group (so losing a ligand), the bond angle is reduced)
The first trend is straightforward to explain, as bond lengths increase down the group. This is in tandem with the increase in atomic radius down the group as orbitals in a greater shell begin to be filled. Thus, as you move from period 2 (N) to period 3 (P), the length of the bond increases and is in turn the overall size of each ion. There is slight variance in the length of a C-H bond in each complex, however no pattern is immediately discernible (it increases in the order S > P > N) - it is thought this is just some random error in the calculation.
Whilst there is an increase in bond length, there is no change in orientation of the bonds, thus the symmetry of TD is maintained in both the phosphorous and nitrogen molecules. As a result of this, the bond angle is the same for these two complexes. No other arrangement of the ligands is sterically possible, so ensuring that this symmetry label cannot be changed, and therefore the bond angle also cannot change. The bond angle is different for sulphur, as a result of the change of symmetry to C3v, it is not known if the change in central atom contributes to this change - further investigation would be required.
Of note, the bond length does not appear to change going across the period. There is actually a small increase of 0.01Å if the bond length is reported accurate to 0.001Å, however it is not known if this is just an inherent error in the calculation or not. In any event, it is expected that there is a slight decrease in the bond length as you move towards the right of a period, as the increased nuclear charge better shields the electrons and thus shortens the bond length, but this is not observed here. This may be a result of this complex containing one less ligand, with the arrangement instead taken (along with the lone pair) resulting in some interactions (steric or electronic repulsion) which causes the carbon and core atoms to move apart from each other. This theory is supported by the large deviation from bond length for the sulphur complex, indicating some feature about the arrangement it has taken is causing the bond length to be artificially lengthened.
Otherwise no strange observations are seen with the structures, with all methyl groups taking the expected tetrahedral structure, and either tetrahedral or C3v structures for the central atom as expected by the number of ligands which are present.
Molecular orbitals and NBO charges of methyl-ligand complexes
All three complexes discussed previously have been subject to a full NBO and MO analysis via an energy calculation with the pop=(full,nbo) keyword, retaining any previously used keywords as appropriate. Calculations were performed on the laptop due to load on the HPC, except for the sulphur complex as the calculation took too long on the laptop.
Log files are available as follows:
- [N(CH3)4]+: media:Pk_log_nch34_egy.log
- [P(CH3)4]+: media:Pk_log_pch34_egy.log
- [S(CH3)3]+: DOI:10042/26274
Calculation output
[N(CH3)4]+
File Name	NCH34_EGY
File Type	.log
Calculation Type	SP
Calculation Method	RB3LYP
Basis Set	6-31G(d,p)
Charge	1
Spin	Singlet
E(RB3LYP)	-214.18128421	a.u.
RMS Gradient Norm	a.u.
Imaginary Freq
Dipole Moment	0.0000	Debye
Point Group	TD
Job cpu time:	0 days  0 hours  0 minutes 19.0 seconds.
[P(CH3)4]+
File Name	PCH34_EGY
File Type	.log
Calculation Type	SP
Calculation Method	RB3LYP
Basis Set	6-31G(d,p)
Charge	1
Spin	Singlet
E(RB3LYP)	-500.82701105	a.u.
RMS Gradient Norm	a.u.
Imaginary Freq
Dipole Moment	0.0001	Debye
Point Group	C1
Job cpu time:	0 days  0 hours  1 minutes 20.0 seconds.
[S(CH3)3]+
File Name	sch33_egy
File Type	.log
Calculation Type	SP
Calculation Method	RB3LYP
Basis Set	6-31G(d,p)
Charge	1
Spin	Singlet
E(RB3LYP)	-517.68327460	a.u.
RMS Gradient Norm	a.u.
Imaginary Freq
Dipole Moment	0.9651	Debye
Point Group	C1
Job cpu time:	0 days  0 hours  0 minutes 57.7 seconds.
Sample MOs for [N(CH3)4]+
A variety of 5 molecular orbitals have been calculated and shown below. Only occupied non-core MOs from the totally bonding to totally antibonding are shown.
| MO number | Energy (hartree) | Picture | Degeneracy | Notes |
|---|---|---|---|---|
| 6 | -1.19645 |  |
Singly degenerate | This MO exhibits a great degree of strong bonding interactions across the entire molecule up to the protons, the orbitals of which do not appear to be part of this MO. This is seen by the huge red surface containing almost the entirety of the molecule. As a result of the huge amount of delocalisation seen in the MO, there is a lot of through space interactions between adjacent carbon groups, as seen by how the MO forms a 'cage' around the entire molecule - the empty space between two carbon atoms is part of this red object. As there are no other molecular orbitals other than this huge one, there is no concept of a node in this MO diagram. |
| 10 | -0.80745 |  |
Singly degenerate | This is the first MO in this series of 5 to contain a slight degree of antibonding character, as seen by the fact each ligand is in its own (+) phase orbital, whereas the central atom is in a (-) phase one. This leads to a minor degree of antibonding character, and also a node in the centre of the M-C bond where the two MOs end. Through space interactions are present in each ligand MO, with all the protons and the central carbon existing within the boundaries of the MO, and hence there are through-space interactions between the protons. MOs of the same phase interact weakly with each other due to the large distance between each green orbital (seen in the picture), however the interaction between the (+) and (-) orbitals is quite strong as the nodal area is very small in size - the orbitals are nearly touching. The level of delocalisation is reduced, with delocalisation only occurring across each ligand group - the ligands themselves are not delocalised onto one unit. |
| 14 | -0.62248 |  |
Doubly degenerate | For this MO, nodes exist on every carbon atom, as each MO covers two halves of a carbon atom, two protons, and nothing else. This does lead to delocalisation across the protons and carbon atoms, however this also does result in strong antibonding interactions at each carbon as the (+) and (-) MOs become quite close. Some protons, and the central atom are not covered at all by this MO, however from what is delocalised, there is a significant amount of through space interactions between protons on differing methyl ligands - this is of note as the ligand protons are quite a distance away. There may be some weak bonding interactions between orbitals of the same phase, however they are quite a distance away (separated by the central atom) so this is expected to be quite weak. |
| 17 | -0.58035 |  |
Triply degenerate | This one again has a node on each carbon, however it differs in that each orbital only covers a single proton and half a carbon. This results in there being no through-space interactions in this molecule. Additionally, there are many strong antibonding interactions as all the orbitals are quite close together, with the a (+) orbital being surrounded by a (-) orbital on every side. If there are any bonding interactions, these are going to be very weak. |
| 21 | -0.57934 |  |
Triply degenerate | This MO is similar to the previous, but differs in that each orbital now consists of two protons, so there are no protons which aren't enclosed in an orbital. Again, there are nodes in each carbon, but also a node in the central atom, with orbitals now also covering the central atom. This results in there being strong antibonding interactions over almost the entire molecule, with (+) interacting with (-) almost over the entire surface of every orbital. Through-space interactions are now back with there being two protons in each orbital, making it possible for these to interact, and there is also the potential for protons and central atom to interact as well. This orbital is only slightly higher energy than the previous one, and this is solely because of the increased degree of antibonding interactions present. |
NBO charge distributions
NBO charge distributions were calculated from the checkpoint file for a range of -1.750 to 1.750 as this ensured the range of charges for all 3 complexes could be accommodated on the same scale. The charges are as follows:
| Complex | Central atom charge (e) | Carbon charge (e) | Proton charge (e) |
|---|---|---|---|
| [P(NH3)4]+ | 1.667 | -1.060 | 0.298 |
| [N(NH3)4]+ | -0.295 | -0.846 | 0.297 |
| [S(NH3)3]+ | 0.917 | -0.483 | 0.269 |
-
 Nitrogen complex
 -
 Phosphorous complex
 -
 Sulphur complex


There appears to be a slight trend of the central atom's charge with electronegativity, with the charge much lower as it becomes more electronegative (and hence drawing a greater share of electrons to it). This in turn makes the carbon more positive as electron density is removed from it. The protons remain rather positively charged and do not appear to be greatly affected by the centre, but this is likely because they are too far away for the inductive effect to occur.
Interestingly, nitrogen is more eletronegative than sulphur, yet sulphur has a greater negative charge. The reduced degree of polarisation in the bond for the nitrogen complex also suggests why the bond length for the nitrogen complex is shorter compared to the sulphur. The reason for this increased amount of negative charge is due to the lone pair present on sulphur (hence the configuration it takes according to the Jmol clip above), and so there is simply more negative charge present on the sulphur.
Thus, for the general complex [NR4]+, the positive charge located on the nitrogen in the picture is indeed located on the nitrogen, however it is somewhat delocalised over the protons too. As the nitrogen contains the greatest degree of positive charge, though, the + sign is conventionally placed here as it gives the indication as to where most of the charge is.
Analysis of the log files show the exact NBO contributions to the bond:
[P(NH3)3]+
     1. (1.98031) BD ( 1) P   1 - C   2
                ( 40.43%)   0.6358* P   1 s( 25.00%)p 2.97( 74.15%)d 0.03(  0.85%)
                                            0.0000  0.0001  0.5000 -0.0008  0.0000
                                            0.0000 -0.4030  0.0006  0.0000 -0.4429
                                            0.0006  0.0000  0.6188 -0.0009  0.0385
                                           -0.0538 -0.0591 -0.0036  0.0254
                ( 59.57%)   0.7718* C   2 s( 25.24%)p 2.96( 74.67%)d 0.00(  0.08%)
                                            0.0002  0.5021  0.0171 -0.0020  0.4044
                                           -0.0074  0.4444 -0.0081 -0.6209  0.0114
                                            0.0121 -0.0169 -0.0186 -0.0011  0.0080
This shows almost equal contribution from each atom to the bond, with each atom assuming a sp3 arrangement as is expected by the TD symmetry. Carbon is sp3 as expected due to its saturation. As the carbon is slightly more negatively charged according to the charge distributions, the marginal increase in contribution from the carbon vs the phosphorous agrees with the charge distribution seen.
[N(NH3)3]+
     4. (1.98452) BD ( 1) C   1 - N  13
                ( 33.65%)   0.5801* C   1 s( 20.77%)p 3.81( 79.06%)d 0.01(  0.16%)
                                            0.0003  0.4552 -0.0237  0.0026 -0.5129
                                           -0.0218 -0.5129 -0.0218 -0.5129 -0.0218
                                            0.0234  0.0234  0.0234  0.0000  0.0000
                ( 66.35%)   0.8146* N  13 s( 25.00%)p 3.00( 74.97%)d 0.00(  0.03%)
                                            0.0000  0.5000 -0.0007  0.0000  0.4999
                                           -0.0001  0.4999 -0.0001  0.4999 -0.0001
                                            0.0103  0.0103  0.0103  0.0000  0.0000
A similar argument can be made here. The large contribution from the nitrogen is surprising, but considering the smaller bond length for this complex based on the central atom, an increased contribution from the nitrogen is not unreasonable. However this does disagree somewhat with the charge distribution which shows there is a much larger electron density on the carbon. It is thus thought that since it is possible to reach orbitals closer to the core on nitrogen rather than phosphorous, it makes nitrogen able to donate a greater share of electrons, and so polarises the bond towards it as a result of its electronegativity.
[S(NH3)3]+
     4. (1.98631) BD ( 1) C   1 - S  13
                ( 48.67%)   0.6976* C   1 s( 19.71%)p 4.07( 80.16%)d 0.01(  0.14%)
                                           -0.0003 -0.4437 -0.0140  0.0033  0.7546
                                           -0.0059  0.3161 -0.0025  0.3634  0.0098
                                           -0.0189 -0.0222 -0.0093 -0.0186  0.0096
                ( 51.33%)   0.7165* S  13 s( 16.95%)p 4.86( 82.42%)d 0.04(  0.63%)
                                            0.0000 -0.0001 -0.4117  0.0075 -0.0012
                                            0.0000 -0.7489  0.0330  0.0000 -0.3137
                                            0.0138  0.0000 -0.4037 -0.0260 -0.0353
                                           -0.0572 -0.0240 -0.0347  0.0051
Finally, for the sulphur, the bond is an almost equal contribution from each atom in the bond. The charges of the S and C atoms according to the charge distribution are both similar and negative, suggesting little polarisation in this bond, and so the balance seen here is to be expected.
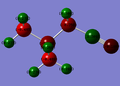
Ligand influences on nitrogen centre complexes
To investigate how changes to the ligands affects the cation, two variants on the nitrogen complex analysed previously have been used. One has one of the protons on a methyl ligand replaced with CH2OH, the other has the proton replaced with CH2CN. Each complex is then optimised and subject to a frequency analysis so as to allow for investigation of its structure. A MO and NBO calculation is then subsequently run to analyse how the change in ligand affects the ions electronic behaviour.
Optimisations
Optimisations were conducted to the 6-31G(d,p) level directly with the same keywords as used previously (but no nosymm). The log files are available below on Dspace after being optimised on the HPC.
- [N(CH3)3(CH2OH)]+: DOI:10042/26206
- [N(CH3)3(CH2CN)]+: DOI:10042/26207
Summary output
[N(CH3)3(CH2OH)]+:
File Name	nch33ch2oh_opt
File Type	.log
Calculation Type	FOPT
Calculation Method	RB3LYP
Basis Set	6-31G(d,p)
Charge	1
Spin	Singlet
E(RB3LYP)	-289.39470724	a.u.
RMS Gradient Norm	0.00000102	a.u.
Imaginary Freq
Dipole Moment	2.1358	Debye
Point Group	C1
Job cpu time:	0 days  1 hours 22 minutes 37.5 seconds.
[N(CH3)3(CH2CN)]+:
File Name	nch33ch2cn_opt
File Type	.log
Calculation Type	FOPT
Calculation Method	RB3LYP
Basis Set	6-31G(d,p)
Charge	1
Spin	Singlet
E(RB3LYP)	-306.39376383	a.u.
RMS Gradient Norm	0.00000045	a.u.
Imaginary Freq
Dipole Moment	5.7642	Debye
Point Group	C1
Job cpu time:	0 days  0 hours 50 minutes 39.5 seconds.
Convergence output
[N(CH3)3(CH2OH)]+:
         Item               Value     Threshold  Converged?
 Maximum Force            0.000002     0.000015     YES
 RMS     Force            0.000000     0.000010     YES
 Maximum Displacement     0.000034     0.000060     YES
 RMS     Displacement     0.000008     0.000040     YES
 Predicted change in Energy=-5.591936D-11
 Optimization completed.
    -- Stationary point found.
[N(CH3)3(CH2CN)]+:
         Item               Value     Threshold  Converged?
 Maximum Force            0.000001     0.000015     YES
 RMS     Force            0.000000     0.000010     YES
 Maximum Displacement     0.000036     0.000060     YES
 RMS     Displacement     0.000011     0.000040     YES
 Predicted change in Energy=-2.269581D-11
 Optimization completed.
    -- Stationary point found.
Frequency analysis
Optimisations were conducted to the 6-31G(d,p) level directly with the same keywords as used previously (but no nosymm). The log files are available below on Dspace after being optimised on the HPC.
- [N(CH3)3(CH2OH)]+: DOI:10042/26290
- [N(CH3)3(CH2CN)]+: DOI:10042/26291
Summary outputs
[N(CH3)3(CH2OH)]+
File Name	nch33ch2oh_freq
File Type	.log
Calculation Type	FREQ
Calculation Method	RB3LYP
Basis Set	6-31G(d,p)
Charge	1
Spin	Singlet
E(RB3LYP)	-289.39470724	a.u.
RMS Gradient Norm	0.00000106	a.u.
Imaginary Freq	0
Dipole Moment	2.1358	Debye
Point Group	C1
Job cpu time:	0 days  0 hours 26 minutes 10.7 seconds.
         Item               Value     Threshold  Converged?
 Maximum Force            0.000003     0.000450     YES
 RMS     Force            0.000001     0.000300     YES
 Maximum Displacement     0.000102     0.001800     YES
 RMS     Displacement     0.000029     0.001200     YES
 Predicted change in Energy=-5.078379D-11
 Optimization completed.
    -- Stationary point found.
[N(CH3)3(CH2CN)]+
File Name	nch33ch2cn_freq
File Type	.log
Calculation Type	FREQ
Calculation Method	RB3LYP
Basis Set	6-31G(d,p)
Charge	1
Spin	Singlet
E(RB3LYP)	-306.39376383	a.u.
RMS Gradient Norm	0.00000059	a.u.
Imaginary Freq	0
Dipole Moment	5.7642	Debye
Point Group	C1
Job cpu time:	0 days  0 hours 29 minutes 19.0 seconds.
         Item               Value     Threshold  Converged?
 Maximum Force            0.000002     0.000450     YES
 RMS     Force            0.000001     0.000300     YES
 Maximum Displacement     0.000065     0.001800     YES
 RMS     Displacement     0.000019     0.001200     YES
 Predicted change in Energy=-6.144746D-12
 Optimization completed.
    -- Stationary point found.
Vibrational modes
[N(CH3)3(CH2OH)]+
 Low frequencies ---   -8.4158   -5.0201   -1.2272   -0.0010   -0.0008   -0.0007
 Low frequencies ---  131.1073  213.4620  255.7131
Right click and use the Model menu to see the available modes
Vibration |
[N(CH3)3(CH2CN)]+
 Low frequencies ---   -8.4158   -5.0201   -1.2272   -0.0010   -0.0008   -0.0007
 Low frequencies ---  131.1073  213.4620  255.7131
Right click and use the Model menu to see the available modes
Vibration |
MO and NBO calculations
pop=(nbo,full) energy calculations were then performed on the complexes to generate MOs and NBO charge diagrams, just as has been done previously. All calculations were performed on the HPC and log files are available as follows:
- [N(CH3)3(CH2OH)]+: DOI:10042/26294
- [N(CH3)3(CH2CN)]+: DOI:10042/26295
Summary outputs
[N(CH3)3(CH2OH)]+
File Name	nch33ch2oh_egy
File Type	.log
Calculation Type	SP
Calculation Method	RB3LYP
Basis Set	6-31G(d,p)
Charge	1
Spin	Singlet
E(RB3LYP)	-289.39470724	a.u.
RMS Gradient Norm	a.u.
Imaginary Freq
Dipole Moment	2.1358	Debye
Point Group	C1
Job cpu time:	0 days  0 hours  1 minutes 59.3 seconds.
[N(CH3)3(CH2CN)]+
File Name	nch33ch2cn_egy
File Type	.log
Calculation Type	SP
Calculation Method	RB3LYP
Basis Set	6-31G(d,p)
Charge	1
Spin	Singlet
E(RB3LYP)	-306.39376383	a.u.
RMS Gradient Norm	a.u.
Imaginary Freq
Dipole Moment	5.7642	Debye
Point Group	C1
Job cpu time:	0 days  0 hours  2 minutes 25.0 seconds.
NBO charge distributions
The main difference between these ligands is that CN is an EWG, and OH is an EDG, the latter due to the lone pairs which make it possible to enolise. Therefore comparison of the charge density of the structure can show how these ligands affect the overall structure of the molecule. The NBO charge distributions from -0.750 to 0.750 are shown below.
-
 CN ligand complex
 -
 OH ligand complex


n.b. the charge for the atom in the centre of the CN complex is -0.289
It is seen that, in both cases, the nitrogen makes up the majority of the C-N bond to the C with the substituent:
OH case:
     4. (1.98195) BD ( 1) N   1 - C  14
                ( 67.28%)   0.8202* N   1 s( 23.48%)p 3.26( 76.49%)d 0.00(  0.03%)
                                            0.0000 -0.4845 -0.0026 -0.0002  0.7401
                                           -0.0032  0.3146 -0.0015  0.3438 -0.0026
                                           -0.0092 -0.0105 -0.0043 -0.0088  0.0045
                ( 32.72%)   0.5720* C  14 s( 20.28%)p 3.92( 79.55%)d 0.01(  0.18%)
                                           -0.0003 -0.4501  0.0135  0.0006 -0.7171
                                           -0.0206 -0.3677 -0.0077 -0.3815 -0.0037
                                           -0.0247 -0.0249 -0.0101 -0.0185  0.0102
CN case:
     4. (1.97747) BD ( 1) N   1 - C  14
                ( 64.52%)   0.8033* N   1 s( 24.08%)p 3.15( 75.89%)d 0.00(  0.04%)
                                            0.0000  0.4907 -0.0010  0.0003  0.6601
                                           -0.0021  0.5684  0.0038  0.0000  0.0000
                                            0.0166  0.0000  0.0000  0.0024 -0.0097
                ( 35.48%)   0.5956* C  14 s( 20.81%)p 3.80( 79.05%)d 0.01(  0.14%)
                                            0.0000  0.4557 -0.0205  0.0000 -0.6428
                                           -0.0249 -0.6135 -0.0174  0.0000  0.0000
                                            0.0320  0.0000  0.0000 -0.0011 -0.0197
Ligand influence on charge distribution
There is quite a significant change in electron density for the OH complex with the carbon between the OH group and the centre becoming much more positive. This is surprising considering the OH is a donating group, however this is simply explained. As the carbon is between two electronegative groups, a lot of electron density is withdrawn from it, and hence it becomes very positive. However, the centre has become more negatively charged (-0.322 vs -0.295). Hence, the donated electrons are moving straight from the oxygen to the centre, while the carbon between's electrons are also donated to both the oxygen and nitrogen as part of the electronegative pull these atoms have on the carbon.
Regarding the CN complex, the electron withdrawal is clearly seen on the carbon the CN ligand is bonded to, as this has become less negatively charged (-0.289 vs -0.295), showing that once again, electron withdrawal is occuring at a distance that causes electrons to travel from the nitrogen through the carbon.
In conclusion, it is seen that the electron inductive effects of the ligands has a direct influence on the central atom, as these effects travel through the carbon to directly pull or push electrons from the central atom. This is likely due to the large contribution of charge from the nitrogen in the CN bond to the relevant C, so meaning any inductive effects on the C are very likely to influence the N due to the polarisation of the bond towards the N seen.
Sample MOs
The HOMO and LUMO for these two complexes are reported below:
| [N(CH3)3(CH2OH)]+ |
[N(CH3)3(CH2CN)]+ | |
|---|---|---|
| HOMO |  |

|
| LUMO |  |

|
| HOMO Energy (hartree) | -0.48763 | -0.50047 |
| LUMO Energy (hartree) | -0.12459 | -0.18183 |
Discussion of MOs
The most notable change is that there is an increased amount of delocalisation present in the alcohol-containing complex's LUMO vs the cyanide containing one. Whilst it was thought that this is a result of the electron donation, further investigation showed that this is one orbital created by through-space interactions of every proton in the complex. The present of the alcohol group adds protons to fill a space in the molecule where would there otherwise be no protons (see the cyanide complex). This means that the distance between any two protons is small enough for an interaction to occur, and as there are protons around the entirety of the molecule, one orbital surrounds the entire molecule. The original theory was discarded after it was noted that the nitrogen centre has its own orbital of the opposite phase in the centre of the complex, which leads to a very large number of strong antibonding interactions as it comes close to the delocalised proton orbital. Despite the increased degree of through-space interactions, this LUMO is higher in energy than the CN one, simply because of the increased number of antibonding interactions.
The CN complex LUMO does not have such a large delocalisation, and as a result some methyl protons occupy their own orbital of the opposite polarity.
A similar story is seen for the HOMO, which is lower in energy for the CN molecule. The overall volume of orbitals is smaller for the CN molecule, as the CN group is symmetric and simple (pi-bond like) in nature, leading to a very simple arrangement of orbitals at this point. In contrast, for the OH complex, a very complex d-orbital MO is seen over the alcohol group, which then results in some interactions over the nitrogen.
One possible result of this is that it is easier to perform electrophillic attacks on the OH complex at the nitrogen, as the presence of an orbital over the nitrogen would allow for a positively charged group to come in and perform some reaction. These reactions may include ligand substitution or oxidative addition. This kind of attack would not be possible on the CN complex HOMO as no orbital exists on the central nitrogen, and hence cannot be attacked. The only reactions possible on this HOMO would therefore be substitutions on the CN group, which is not as interesting as ligand substitution or oxidative addition on the center of the complex.
Likewise, the OH complex is likely to be more susceptable to attack by nucleophiles. This is however not due to the large delocalised MO (which is present on the CN complex too), as this only covers protons and does not allow any reactions to occur on a ligand or on the nitrogen. However on the OH group, there is an orbital which contains both the nitrogen centre and the OH ligand, making it incredibly likely that nucleophillic attack will lead to substitution of the CH2OH group. This is necessary as this large orbital covering the entire molecule is likely to hinder attack of the nitrogen centre - as any attack of the nitrogen center must be on an orbital of the nitrogen centre. This cannot occur on the CN group as the orbital over the nitrogen is completely shielded by other orbitals.
Finally, the HOMO-LUMO gap has changed from 0.31864 e (for the CN complex) to 0.36304 e. This makes it harder for an electron to be promoted from the HOMO to the LUMO in the OH complex. Therefore, any photochemical reactivity which is seen would occur in the CN complex but not the OH one. Considering there is a wealth of reported[4] photoreactivity for CN systems, it is very likely that photochemistry will occur with the cyanide-containing complex.
Conclusions
Ionic solvents are formed of a liquid solution of cations and ions, the nature of which massively alter thes behaviour of the solvent. This nature has been shown to be changed by altering the central atom, structure, and ligands of various positive complexes, as has been seen. This report examined how the electronegativity and periodicity of the central atom, and the electron donating ability of a ligand affects the chemistry of the ion in terms of changing the structure, charge density, and molecular orbitals. Some possible pathways of reactivity of the ions have been proposed, which gives some indication as to how a change of the ion's nature massively changes its solvation properties, as solvation can occur through the coordination of the solute to the solvent ion.
Future work can include investigation into how the different ions coordinate to different substrates added to the calculation, and molecular orbital and NBO calculations can give some idea into whether the theories proposed as to where the ion may be reactive are correct.