Rep:Mod:bwalker2
Module 2: Bonding
Barnaby Walker
Introduction
Getting Familiar With Gaussian
In order to become familiar with the techniques employed in modelling an inorganic molecule, the first task was to model BH3, a small and therefore computationally less demanding molecule. The techniques used in modelling this molecule were optimisation of geometry, analysis of Natural Bond Orbitals (NBOs), and vibrational analysis. For comparison, and as practice in using pseudo-potentials, a geometrically similar but larger molecule was modelled using the same techniques, with the exception of NBO analysis. In this case, the larger molecule will be thallium tribromide, TlBr.
Optimisation
To optimise both molecules, they were first drawn in the GaussView interface. An optimisation was then set up for each using the B3LYP method and the 3-21G basis set for BH3. For TlBr3 it was necessary to use a larger basis set that incorporates a pseudo-potential for the Thallium atom.
The optimisations for both work by solving the electronic Schrödinger equation to find the energy of the molecule. To do this the Born-Oppenheimer approximation is applied, allowing the nuclei in the molecules to be taken as stationary coordinates. After calculating the energy of the starting geometry, the coordinates of the nuclei are changed and the electronic Schrödinger equation solved to find the energy of this new geometry. At each new geometry there will be a different energy for the molecule, as the interactions between the particles in the system will be different. These energies are plotted against the optimisation step number, and thus indirectly the nuclear separation, by the program to give a potential energy surface.
The calculation is terminated when an energy minimum is found. This minimum is found by using the first derivative of the potential energy surface of the optimisation, which results in a force. When the energy of the molecule is at a minimum, there will be no force acting upon. However, when the energy of the molecule is not at a minimum, there is a force exerted on the molecule, changing the geometry so that it is in the lowest energy conformation. As such, the energy minimum is found when the force is equal to zero.
Gaussian returns the potential energy surface as well as the root mean squared (RMS) gradient of the potential energy surface. From this information, as well as by looking in the output file, it can be determined if the optimisation has run to completion or not.
BH3
Before setting up the calculation for optimising the geometry of BH3, all of the B-H bond lengths were set to 1.50 Å. This was then used as the starting geometry for the molecule in setting up the optimisation calculation. As the molecule is small, and the 3-21G basis set is also small, this calculation was not very computationally demanding.
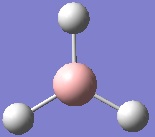
After running the optimisation it was found that the calculated B-H bond length was actually 1.19 Å. The geometry returned was trigonal planar with a D3h point group. From the summary of the results it can be judged whether or not the optimisation has completed by reading the value of the gradient. For this optimisation the RMS gradient was 0.0002 a.u. which is close to zero, meaning that the optimisation was completed. Also from the summary is the total energy of the system, using this method the total energy was found to be -26 a.u.. However, this is only comparable to systems modelled using the same method and basis-set.
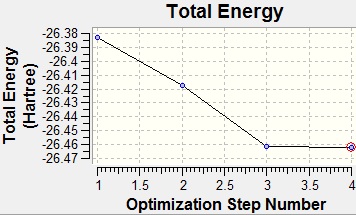
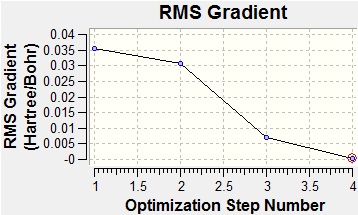
As well as giving a summary of the results, the optimisation steps can be visualised using Gaussian. These are shown below, along with the graphs showing the potential energy surface of the optimisation and its gradient.
| Optimisation Step | Geometry | Bond Length/ Å | Potential Energy Surface and Gradient |
|---|---|---|---|
 |
 | ||
 |
|||
 |
 | ||
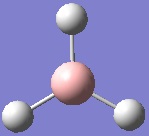 |
From the graphs above it can be seen that by step four the RMS gradient fell close to zero. It can also be seen that the energy difference between steps three and four is not that great. This once again confirms that the optimisation was completed. Another interesting result from the optimisation is that steps 1 and 2 were returned with the bonds missing. However, this is not due to a lack of bonding in the molecule, but because of the way that GaussView handles bonds. In GaussView bonds are only drawn in when their length falls below a certain value, specific to the atoms involved in the bonding. As such, the bonds GaussView are just for structural convenience, to allow easier manipulation of the molecule, rather than an actual description of the bonding.
TlBr3 and Pseudo-potentials
To optimise the geometry of a larger molecule of the same point group, thallium tribromide, the same B3LYP method was used. However, this time the atoms in the molecule are much larger than boron and hydrogen, with each bromine having 35 electrons and thallium itself having 81 electrons. Clearly modelling these using the same basis set as before will be largely inaccurate. Similarly, both bromine and thallium have electrons that are in orbitals very different from the hydrogenic s and p orbitals, as well as experiencing relativistic effects. Whilst the 3-21G basis set used before can be modified by adding diffuse and polarization functions, these are not enough to accurately model the TlBr3 molecule. For this molecule a pseudo-potential is needed. These are functions that use a basis set to only model the valence electrons in each atom, replacing the rest of the electrons with an effective nuclear charge, or pseudo-potential. This can be done as in most cases, the bonding of a molecule is adequately described by the valence electrons of the atoms.
| Calculation Type | FOPT |
| Calculation Method | RB3LYP |
| Basis Set | LANL2DZ |
| E(RB3LYP) | -91 a.u. |
| RMS Gradient Norm | 9 x 10⁻⁷ a.u. |
| Dipole Moment | 0 Debeye |
| Point Group | D3H |
In this case a medium-level pseudo-potential, LANL2DZ, has been used. This uses a D95V basis set for all elements from hydrogen to argon and a Los Alamos ECP, or pseudo-potential, for all heavier elements. A more accurate pseudo-potential was not used as these are more difficult to implement, and are much more computationally demanding. Before running the optimisation the symmetry of the molecule was restricted to D3H in order to prevent the program from trying other symmetries for the molecule.
The Tl-Br bond length returned by the optimisation was 2.65 Å, which is fairly close to the literature value for the hydrated TlBr3 complex of 2.51 Å[1]. Thus we know that the molecule has been modelled fairly accurately. Like in BH3 the optimised molecule is trigonal planar with an optimised Br-Tl-Br bond angle of 120o. The increase in bond length from BH3 to TlBr3 can be explained by the large increase in the size of the atoms, with thallium and bromine having much larger radii than boron and hydrogen.
As noted above, GaussView can return a summary of important information about the calculation. This information can be seen in the table below for the optimisation of TlBr3. The RMS gradient is very small, confirming that the optimisation was completed.
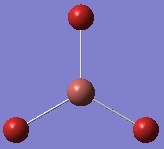
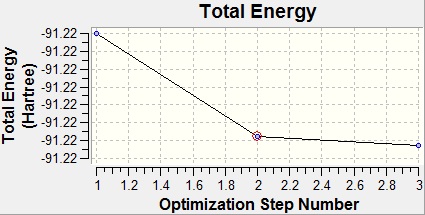
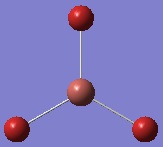
Below are the separate optimisation steps for the calculation:
| Optimisation Step | Geometry | Bond Length/ Å | Potential Energy Surface and Gradient |
|---|---|---|---|
 |
 | ||
 |
|||
 |
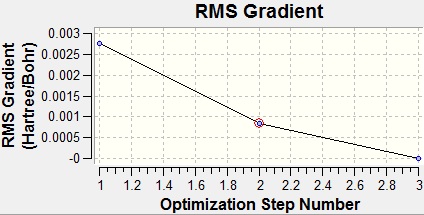 |
As can be seen from the above table, the starting point of optimisation of TlBr3 was much closer to the optimum Tl-Br than the starting point of the BH3 optimisation was to the optimum B-H bond length. As such, the optimisation only took three steps this time rather than four. Furthermore, all of the bond lengths in the steps for TlBr3 were within the maximum value that GaussView had for the Tl-Br bond length, as can be seen by all of the geometries tried having the bonds drawn in above.
Frequency Analysis
Whilst the optimisation traverses the potential energy surface of the molecule and finds a minimum energy conformation by calculating the first derivative of this, the minimum it has found may not actually be a minimum. This is because the slope of the potential energy surface, given by the first derivative, is zero at all stationary points. As the optimisation stops when the slope is at or close to zero, it can also find points of maximum energy, such as transition states.
In order to make sure that the above geometries of BH3 and TlBr3 are actually energy minima, a frequency analysis of the optimised geometries can be carried out. This calculates the vibrational modes of the molecules as well as their frequencies by taking the second derivative of the potential energy surface. The second derivative gives the curvature of the potential energy surface; if the curvature is positive this means a minimum has been found, if it is negative this means a maximum has been found. As such, if any of the vibrational modes returned by the calculations have a negative frequency then the minimum energy conformation has not been found - if only one vibrational mode has a negative frequency then a transition state has been found.
The number of vibrational modes for a molecule is given by the formula 3N-6 where N is the number of atoms in the molecule. The -6 term is to remove any of the translational modes of the molecule that result from movements of the centre of mass. The frequencies of these modes are reported in the log file of the calculations, and are typically much smaller than the vibrational frequencies.
The vibrational analyses for both molecules must be carried out with the same method and basis set as the geometry optimisations.
BH3
As BH3 has four atoms the number of vibrational modes is 6. The lower frequency vibrational modes are reported in the log file of the calculation above the vibrational frequencies:
Low frequencies ---  -66.7625  -66.3592  -66.3589   -0.0019    0.0032    0.2123
 Low frequencies --- 1144.1483 1203.6413 1203.6424
As can be seen, the translational modes have much lower frequencies, being at the most one order of magnitude smaller.
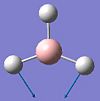
Below are the vibrational modes of BH3 returned by the calculations, along with their frequency and symmetry label in the D3H point group:
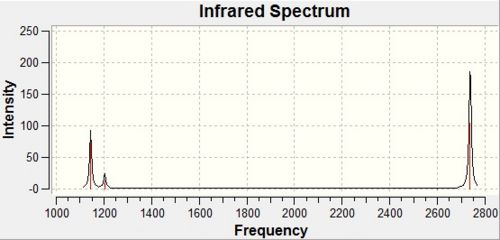
As well as reporting the frequencies of the vibrations, GaussView also reports the intensities. These are most easily visualised by using GaussView to predict the IR spectrum of the molecule:
|
Whilst there are 6 vibrational modes for BH3, there are only 3 peaks observed in the calculated IR spectrum. Two of these peaks are as a result of degeneracies, as can be seen in the table above there are two degenerate vibrational modes at 1204 cm-1 and again at 2737 cm-1. However, this leaves 4 peaks rather than 3. The other reason why a vibration would not show up in the IR spectrum of the molecule is that it has no intensity. This is true for the vibration at 2589 cm-1.
A vibration is only IR active if there is a change in the dipole moment of the molecule. All of the above vibrations involve a change in a dipole moment, as a result of the vibrations not being completely symmetric. However, the exception is the vibration at 2589 cm-1, as this is totally symmetric. Thus there is no change in the dipole moment of the molecule during this vibration, and therefore it is not IR active.
TlBr3
The frequency analysis for TlBr3 showed the following in the output file:
Low frequencies ---   -3.4213   -0.0026   -0.0004    0.0015    3.9367    3.9367
 Low frequencies ---   46.4289   46.4292   52.1449
The lowest real frequency is 46 cm-1. These frequencies are much lower than for BH3. This is as a result of the increased masses of the atoms in TlBr3, leading to an increased moment of inertia. This also indicates that the Tl-Br bonds are much lower in energy than the B-H bonds, as the stretching vibrations are lower in energy, thus meaning it takes less energy to break the Tl-Br bonds.
Below are the vibrational modes of TlBr3:
The main difference between the vibrational modes of BH3 and TlBr3, apart from the lowering of all frequencies, is that the completely symmetric A'1 stretch is now higher in energy than the degenerate E' scissoring modes. Again, this is a result of the increase in reduced mass of the molecule.
As none of the normal vibrational modes for TlBr3 or BH3 are negative, both of the above optimised structures are the lowest energy geometries for the molecules.
MO Analysis
Another way that the bonding of the molecules can be analysed is by studying the Natural Bond Orbitals. Again, these can be calculated using the GaussView interface for Gaussian, and must be carried out using the same method and basis set as for the geometry optimisation.
Before carrying out the NBO calculations, the molecular orbitals of BH3 can be predicted using the qualitative linear combination of atomic orbitals method (LCAO). This has been done below using the valence orbitals of boron and hydrogen:
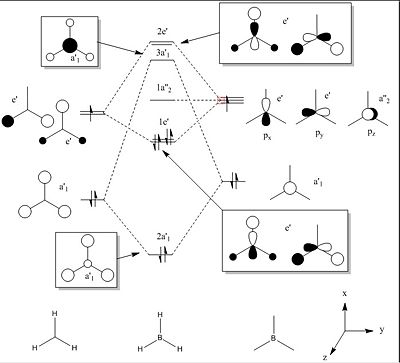 |
This qualitative method predicts that the highest occupied molecular orbital (HOMO) of BH3 should be fully occupied, and be a set of two degenerate orbitals with one nodal plane along either the y axis or x axis. Furthermore, it predicts that the lowest unoccupied molecular orbital (LUMO) will be a nonbonding orbital formed from the pz orbital of the boron atom.
Another prediction that can be drawn from the qualitative MO diagram is that there is no mixing of the resultant MOs due to there being no MOs of the same symmetry close enough in energy to interact. This second order peturbation of the wavefunctions is reported in the output file of the NBO calculations in the following field:
Second Order Perturbation Theory Analysis of Fock Matrix in NBO Basis

     Threshold for printing:   0.50 kcal/mol
                                                           E(2)  E(j)-E(i) F(i,j)
Donor NBO (i)                Acceptor NBO (j)            kcal/mol   a.u.    a.u.
As can be seen, there is no second order perturbation above the threshold value of 0.50 kcal/mol. Thus, the calculations support the prediction of no mixing between the MOs.
These qualitative MOs can be matched to the calculated NBOs by visualising the latter in GaussView. Below is a comparison of the calculated NBOs and the estimated MOs, along with the calculated energies of the NBOs:
| Energy/ eV | Calculated NBO | Estimated MO | Orbital Label |
|---|---|---|---|
| -0.517 |  |
 |
2a'1 |
| -0.356 |  |
 |
1e' |
| -0.356 |  |
 |
1e' |
| -0.074 |  |
 |
1a2 |
| 0.188 | 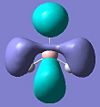 |
 |
2e' |
| 0.188 |  |
 |
2e' |
| 0.192 |  |
 |
3a'1 |
From the calculations it can be seen that the HOMO and the LUMO were as predicted, with both fully occupied HOMO orbitals having an energy of -0.356 eV and a nodal plane along the x or y axis. Similarly the LUMO is the non-bonding pz orbital from the boron atom, the non-bonding character of the orbital being shown by how close to 0 eV the energy of the orbital is.
The rest of the predicted MOs resemble closely their calculated NBO counterparts, with all have the required number of nodal planes. The only discrepancies seem to be as a result of the calculations modelling the actual constructive and destructive interference between the orbitals, whereas the qualitative LCAO analysis merely shows the combination of the atomic orbitals.
There is a marked difference however between the predicted relative energies of the 3a'1 orbital and the 2e' orbitals. The qualitative LCAO method predicted that the 2e' orbitals would be higher in energy than 3a'1, yet the NBO calculations placed them around the other way. This seems to make sense, as the 3a'1 has three nodal planes whereas the 2e' orbitals have only two. As an MO with more nodal planes will have a higher energy, this suggests that the 3a'1 orbital is higher in energy. However, this picture is complicated by the small positive interactions between the three in phase hydrogen atoms, which lower the overall energy of this orbital. This means placing it relative to the 2e' orbtials in the qualitative LCAO method rather difficult. This difficulty is further reinforced by the NBO calculations showing that the orbitals are in fact very close in energy.
As well as returning the shapes of the NBO, the calculations also give the contributions of each atomic orbital to the bonding of the molecule. Below is the results for this analysis:
 (Occupancy)   Bond orbital/ Coefficients/ Hybrids
 ---------------------------------------------------------------------------------
     1. (1.99853) BD ( 1) B   1 - H   2
                ( 44.48%)   0.6669* B   1 s( 33.33%)p 2.00( 66.67%)
                                            0.0000  0.5774  0.0000  0.0000  0.0000
                                            0.8165  0.0000  0.0000  0.0000
                ( 55.52%)   0.7451* H   2 s(100.00%)
                                            1.0000  0.0000
     2. (1.99853) BD ( 1) B   1 - H   3
                ( 44.48%)   0.6669* B   1 s( 33.33%)p 2.00( 66.67%)
                                            0.0000  0.5774  0.0000  0.7071  0.0000
                                           -0.4082  0.0000  0.0000  0.0000
                ( 55.52%)   0.7451* H   3 s(100.00%)
                                            1.0000  0.0000
     3. (1.99853) BD ( 1) B   1 - H   4
                ( 44.48%)   0.6669* B   1 s( 33.33%)p 2.00( 66.67%)
                                            0.0000  0.5774  0.0000 -0.7071  0.0000
                                           -0.4082  0.0000  0.0000  0.0000
                ( 55.52%)   0.7451* H   4 s(100.00%)
                                            1.0000  0.0000
     4. (1.99903) CR ( 1) B   1           s(100.00%)
                                            1.0000  0.0000  0.0000  0.0000  0.0000
                                            0.0000  0.0000  0.0000  0.0000
     5. (0.00000) LP*( 1) B   1           s(100.00%)
From the above it can be seen that in all of the bonds (BD), orbitals 1 through 3, the hydrogen atoms contribute electron density from orbitals with 100 % s-character. However, in these bonds the boron atom contributes density from three orbitals, each with 33 % s-character and 67 % p-character. This suggests that the boron atom forms three sp3 orbitals to bond with the three hydrogen 1s atomic orbitals. Orbital 4 corresponds to the core (CR) 1s orbital of the boron atom, that has been omitted from all of the MO analysis above as it is too low in energy to interact with any of the valence orbitals.
The remaining orbital, number 5, is for the unoccupied boron lone pair (LP*) orbital on the boron. In the calculation this was returned as having 100 % s-character. However, from the shape of the calculated NBOs this should clearly have 100 % p-character instead. This may be an error introduced by using a low-level basis set such as 3-21G.
The final piece of information that can be extracted from the NBO analysis is the charge distribution of the molecule. This is available in the section of the output file below, as well as for visualisation in the GaussView program.
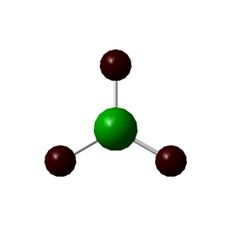
Summary of Natural Population Analysis:

                                       Natural Population
                Natural  -----------------------------------------------
    Atom  No    Charge         Core      Valence    Rydberg      Total
 -----------------------------------------------------------------------
      B    1    0.33161      1.99903     2.66935    0.00000     4.66839
      H    2   -0.11054      0.00000     1.11021    0.00032     1.11054
      H    3   -0.11054      0.00000     1.11021    0.00032     1.11054
      H    4   -0.11054      0.00000     1.11021    0.00032     1.11054
As can be seen, the central boron atom has a partial positive charge, whilst each of the hydrogen atoms has a small partial negative charge. This reflects the fact that BH3 is a lewis acid, meaning that the central boron atom can accept electron density. This is also shown in the fact that the LUMO is a non-bonding pz orbital, that is low enough in energy to accept donation of electrons.
Analysis of Mo(CO)4L2 Isomers
 |
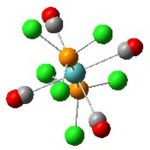
The above techniques can be used to predict which of two isomers is the most thermally stable, and predict the differences in their spectroscopic behaviour. One such problem is encountered in the synthesis of Mo(CO)4(PPh3)2. This forms an octahedral complex with two possible isomers, a cis or a trans form shown below.
To solve this problem, the geometries of the isomers must first be optimised. After this a frequency analysis can be carried out to ensure that the optimum geometries for both was found, and also to predict the IR spectra for each.
Geometry Optimisations
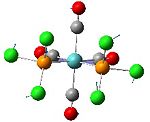
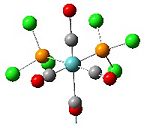
As the phenyl groups in triphenyl phosphine are rather large, and there are six of them, the optimisation of Mo(CO)4(PPh3)2 would be very computationally demanding. As such, the phenyl groups were replaced by chlorine. This can be done as the chlorine atoms have similar electronic effects on the molecule as the phenyl groups, as well as exerting a similar steric bulk.
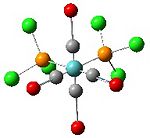
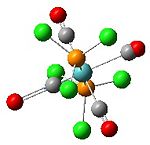
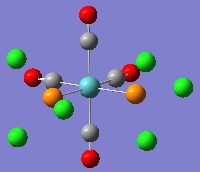
The geometries were optimised using basis sets that include a pseudo-potential, because of the transition metal Mo. First, they were optimised using the B3LYP method and a low-level basis set, LANL2MD. This was to make sure that the bond lengths and angles in the isomers were about right, before using a more accurate basis set, in order to reduce the computation time. The geometries produced by this low level calculation can be seen below.
 |
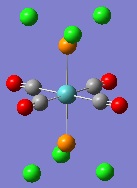 |
One of the first things that jumps out from this is that the P-Cl bonds have disappeared. This is once again as a result of the bond lengths exceeding those set as normal in GaussView. Furthermore, although the bond lengths and angles may be close to their optimum values, the dihedral angles do not look quite right.
This suggests that the above geometries are not the minimum energy conformations. This can occur because the calculations find an local energy minimum, where the gradient of the potential energy surface is zero, and terminates there. These local energy minima may not actually be the minimum energy conformation of the molecule. As such, before using a more accurate basis-set it was necessary to change conformation that the calculations used as a starting point. This has the effect of moving the conformation away from the local energy minimum, and giving the calculations a nudge towards the total energy minimum.
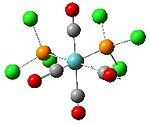
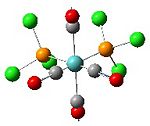
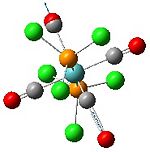
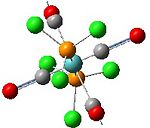
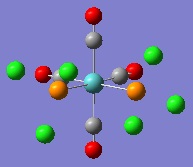
Thus, the dihedral angles between the chlorine atoms and the carbonyl groups were altered. For the cis isomer on PCl3 group was set so that there was a dihedral angle of 0o between one of the chlorine atoms and a CO group, whilst the other PCl3 group was set so there was an angle of 180o to this same CO group. For the trans isomer, both PCl3 groups were set to eclipse each other, and have a dihedral angle of 0o between one chlorine atom and a CO group. The calculations were then carried out again using the more accurate LANL2DZ basis-set. This gave the geometries below:
 |
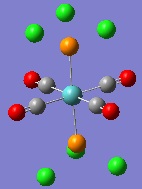 |
As can be seen, the energy minima found for the isomers now have geometries with starkly different dihedral angles than before. The PCl bond lengths are still too long for GaussView to draw them in, at 2.24 Å. However, this geometry can be made more accurate still. This is because the d-character of the electrons on phosphorus atoms have not been taken into account by the method used for the calculations. This can be rectified by altering the Gaussian Input File for the optimisation by adding the keyword 'extrabasis', and the following string at the bottom of the file:
P 0
D  1  1.0
0.55  0.100D+01
****
This adds d-character to the phosphorous atoms, and thus makes the calculations more realistic. The optimised geometries of the isomers are shown below next to tables showing the bond lengths and angles:
|
|
|
As can be seen, the bond lengths deviate deviate by only a small amount from the literature values, with the bond angles being close to the literature values as well. The main differences in bond length involve the phosphorous atom, which may be due to the fact that the phenyl groups have been switched for chlorine atoms to make the calculation less demanding. Adding the d-character to the phosphorous atoms has decreased the P-Cl bond length, enough to be within the values set in GaussView.
Below is the optimised structure of the cis-isomer:
|
|
|
As can be seen, all the values are close to the literature values again, except for those involving the phosphorous atoms. This is once again most likely due to the substitution of chlorine atoms for phenyl groups. In terms of bond lengths, the Mo-P bond length is slightly longer in the cis-isomer than in the trans-isomer. Similarly, the bond angles in the cis-isomer deviate more from the ideal octahedral geometry than in the trans-isomer, with less of the bond angles around the molybdenum centre being equivalent in the cis-isomer. This is due to the cis-isomer having lower symmetry, in the C4v point group, than the trans-isomer, in the D4h point group. The increased deviation from the ideal octahedral geometry suggests that the cis-isomer is more strained, and thus that the trans-isomer is the lower in energy. From the calculations, the energy of the cis-isomer is -623.6929 a.u. (-1,637,509.5 kJ/mol) compared to -623.6942 a.u. (-1,637,505.7 kJ/mol) for the trans-isomer. This would make the trans-isomer the lower in energy, and thus more stable. However, the accuracy of the calculations is ~10 kJ/mol (~0.004 a.u.). As such, the difference in energy of 0.0013 a.u. (3.8 kJ/mol) is less than the accuracy of the calculations. Thus, the two isomers do not differ significantly in energy and it is not possible to firmly say which is lower in energy based on the calculations.
However, it has been reported that at room temperature trans-Mo(CO)4(PPh3)2 converts to the cis-isomer[4]. This suggests that the cis-isomer is the more stable of the two.
As the strain in the cis-isomer is much larger than in the trans-isomer, it would seem as if making the substituent on the phosphine ligand smaller would make the cis-isomer more stable by reducing the strain. This is supported by the literature[4], as well as by the fact that by changing the substituent to the more bulky nButyl group causes the trans-isomer to become more stable[5]. Another way to influence which isomer is the more stable is by replacing the phenyl substituent in the phosphine group with a group that can accept a proton, such as pyridine. This allows intramolecular hydrogen bonding to occur between ligands in the same complex, which stabilises the cis-isomer[6].
Vibrational Analysis
As before, the vibrational analyses had to be carried out with the same method and basis set as the optimisation calculations. This meant that the Gaussian Input Files had to be edited in order to add in the d-character on the phosphorous atoms.
Both analyses returned normal vibrational modes with all positive frequencies, confirming that the optimisations found the minimum energy conformations of both isomers. Furthermore the low frequencies for both are close to zero:
trans = Low frequencies ---   -2.2976   -1.9599   -0.0001    0.0002    0.0006    2.8689
cis = Low frequencies ---   -1.2717   -0.0004   -0.0003    0.0003    0.8274    1.9636
Both isomers have normal vibrational modes that have rather low frequencies. These are shown in the table below:
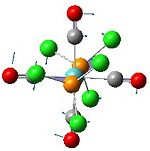
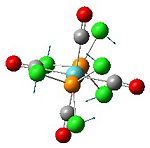
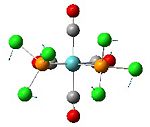
At room temperatures the translational and rotational modes represented by the six low frequencies, as well as the low frequency vibrations shown above, will be significantly populated. This means that, in the gas phase at least, the conformation of the isomers is not locked, with the phosphine groups rotating about the Mo-P bond.
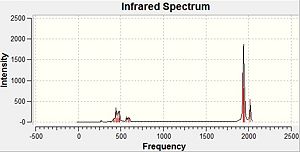
The computed IR spectra for the isomers are shown below:
 |
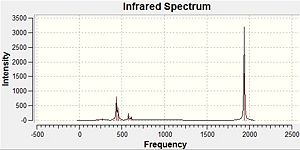 |
The main difference between the two IR spectra is that the cis-isomer has many more peaks than for the trans-isomer. This is as a result of the decreased symmetry from the trans-isomer to the cis-isomer, leading to fewer degenerate vibrations of the cis-isomer, and thus more peaks. Furthermore, more vibrations in the more symmetrical trans-isomer will be totally symmetric, leading to no change in the dipole moment of the molecule so little or no IR intensity for the vibrations.
These differences between the two isomers is most easily seen by focusing on the carbonyl stretches in the molecules, between 2000 cm-1 and 1900 cm-1. These can be seen below for both isomers:
From the above it can be seen that the two lowest carbonyl stretches for the trans-isomer are degenerate, however for the cis-isomer these have different symmetry to each other. As such, these vibrations lead to one peak for the IR spectrum of the trans-isomer, but two for the cis-isomer. Furthermore, the two higher energy stretches for the trans-isomer lead to little or no change in the dipole moment, making the intensity of these peaks being very small in the IR spectrum. For the cis-isomer however, these lead to a large change in the dipole moment. Thus the IR spectrum of the cis-isomer has four carbonyl peaks, whilst the trans-isomer has just one.
Mini Project: Disilenes
Introduction
Until the last few decades it had be taken as granted that whilst there are many compounds containing C=X (X = C, N, S, O, etc.), silicon did not form compounds containing Si=X bonds (X = Si, C, O, etc.)[7]. Since the first synthesis of a stable disilene, Mes2Si=SiMes2, by West et al. in 1981[8] there has been much interest in such compounds. One interesting problem is that disilenes have been found experimentally and theoretically to take up trans-bent geometries, rather than the planar ones favoured by alkenes.
This can be explained by looking at the species formed by homolytic cleavage of the double bonds: carbenes for alkenes and silylenes for disilenes. These can either be two triplet fragments or two singlet fragments, which form the planar geometry or trans-bent geometry respectively[9].
For all elements below Period 2, the singlet state is the most stable. Thus, alkenes can be thought of as being formed through 2 triplet state carbenes, whilst disilenes are formed from two singlet state silylenes. Using the CGMT model[10] shows that a trans-bent double bond will be formed when ΣΔE(S->T)>1/2Eσ+π, where ΔE(S->T) is the preparation energy needed to promote the ER2 fragment from the singlet state to the excited triplet state and Eσ+π is the energy of forming a π bond from two triplet fragments. Obviously, if the energy produced by forming such a double bond is less than the energy needed to form the excited triplet state then a planar double bond is unfavourable and a trans-bent molecule will be formed. As the trans-bent double bonds are formed from dative interactions, these will be weaker than the more classical double bonds formed in planar geometries.
The singlet state of ER2 fragments can be stabilised by using electronegative R groups, as the E-R bonds will use the R p-orbitals, thereby increasing the s-character of the lone pair involved in forming the double bond[10]. By extension, electropositive R groups should increase the p character of this lone pair, and thus stabilise the triplet state. For this reason, the geometry and bond lengths will be examined for the disilenes: Li2Si=SiLi2, H2Si=SiH2, F2Si=SiF2. This should show that the more electronegative R groups, F, cause a large amount of trans-bending and longer bond lengths, whilst the more electropositive R group, Li, shows more planar geometry and shorter bond lengths.
It has also been reported that the triplet state can be stabilised by using bulkier R groups[10], as these force larger angles between the R-groups, which is favoured by the triplet state. As such the bond lengths and geometrie will be compared for the disilenes: H2Si=SiH2, (SiH3)2Si=Si(SiH3)2, (SiMe3)2Si=Si(SiMe3)2. From this it would be expected that the bulkiest disilene would have the most planar geometry and the shortest bond lengths, as the triplet state will be most stabilised.
Changing Electronegativities
In order to optimise the geometries of the disilenes the method used was the DFT method B3LYP. At first a low-level basis set, 3-21G, was used. This was followed by an optimisation using the more accurate 6-311G(d) basis set. It should be noted that the (d) term represents an added polarization function, allowing mixing of the d and p atomic orbitals on the silicon atoms to polarize the p-AOs. After this, a vibrational analysis was carried out using the same method to ensure the highest energy geometry has been found.
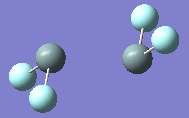
These are shown below for each disilene:

|

|
|
As can be seen from above the trans-bending is greater for the fluorine substituted disilene than the hydrogen substituted one, suggesting the singlet state is more stabilised in the fluorine substituted disilene. This can be seen better in the table below with the dihedral angles of the R groups, as well as the bond lengths. Also included is the frequency of the Si=Si stretching vibration delivered by the vibrational analysis.
Whilst the lithium substituted disilene is planar as suspected, it involves bridging of two of the lithium atoms between the silicons. As such, the bonding is not analogous to an alkene and no judgement can be made about the relative stability of the triplet or singlet states.
| R Group | Dihedral Angle/o | Si=Si Bond Length/ A | v(Si=Si)/ cm-1 |
|---|---|---|---|
| Li | 180 | 2.25 | 535 |
| H | 40 | 2.17 | 561 |
| F | 71 | 2.62 | 275 |
From these it can be seen that increasing the electronegativity of the R group does weaken the double bond, as the bond length in the fluorine substituted disilene is much longer than for the hydrogen substituted one, 2.62 A compared to 2.17 A. Furthermore, the stretching frequency for R=F is about half of that for R=H, and thus much weaker. The longer bond length and weaker bonds may suggest that the greater the degree of trans-bending in the molecule, and thus the stability of the singlet state of the silylene, the lower the degree of double-bonding there is between the silicon atoms.
Compared to the Si-Si bond length in disilane, of 2.35 A, it can be seen that when R=H for the disilene, the bond length is much shorter. This suggests that there is indeed a double bond there for this disilene. When R=F however, the supposed Si=Si bond length is much longer than the Si-Si bond length for disilane. This suggests that when R=F there is very little double bond character.
However, as these are non-classical double bonds, using bond lengths to judge the degree of double-bonding is not very good. Thus, the NBOs were calculated for when R=H and F, and compared to the corresponding alkenes. The frontier orbitals from this can be seen below.
N.B. - All of the above geometries can be confirmed as the optimum ones as all the normal vibrational frequencies were positive, and the low frequencies were close to zero.
However, in optimising the geometries of the two trans-bent species, the first structures delivered by the 6-311G(d) basis set were planar and the vibrational analyses had one negative frequency in the normal vibrational modes. This suggests that the planar geometries found were transition states, and thus energy maxima.
Changing Bulk
The optimisations were carried out as above, although no transition states were found this time.
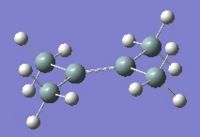
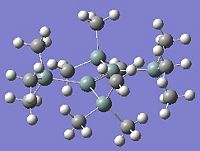
Below can be seen the optimised geometries of disilenes where R=H, SiH3, and SiMe3.

|
|
|
References
- ↑ Glaser, J.; Johansson, G. Acta Chem. Scan., Ser. A, 1982, 36, 125 DOI:10.3891/acta.chem.scand.36a-0125
- ↑ 2.0 2.1 Hogarth, G.;Norman, T., Inorg. Chim. Acta, 1997, 254(1), 167DOI:10.1016/S0020-1693(96)05133-X
- ↑ 3.0 3.1 Cotton, F. A.;Darensbourg, D. J.; Klein, S.; Kolthammer, B. W. S., Inorg. Chwm., 1982, 21(1), pp249-299DOI:10.1021/ic00131a055
- ↑ 4.0 4.1 Bennett, D.W.; Siddiquee, T.A.; Haworth, D.T.; Kabir, S.E.; Camellia, F.K., J. Chem. Crystallogr., 2004, 34(6), 353-359DOI:10.1023/B:JOCC.0000028667.12964.28
- ↑ Darensbourg, D.J., Inorg. Chem., 1979, 18(1), 14-17DOI:10.1021/ic50191a003
- ↑ Hirsivaara, L.; Haukka, M.; Pursiainen, J., J. Chem. Commun., 2000, 3(10), 508-510Template:DO!
- ↑ Kira, M., J. Organomet. Chem., 2004, 689(24), 4475-4488DOI:10.1016/j.jorganchem.2004.05.054
- ↑ West, R.; Fink, R.J.; Michl, J., Science, 1981, 214(4527), 1343-1344DOI:10.1126/science.214.4527.1343
- ↑ Grützmacher, H; Fässler, T.F., Chem. Eur. J., 2000, 6(13), 2317-2325DOI:<2317::AID-CHEM2317>3.0CO;2-X 10.1002/1521-3765(20000703)6:13<2317::AID-CHEM2317>3.0CO;2-X
- ↑ 10.0 10.1 10.2 Carter, E.A.; Goddard, W.A.' J. Phys. Chem., 1986, 90(6), 998-1001DOI:10.1021/j100278a006


