Rep:Mod:bwalker1
Module 1: Structure and Spectroscopy
Modelling Using Molecular Mechanics
Hydrogenation of Cyclopentadiene Dimer
An example of the way that computational chemistry can be used to gain further insight into a reaction is in the dimerisation of cyclopentadiene, followed by its hydrogenation.

The dimerisation of cyclopentadiene proceeds readily at room temperature by a Diels-Alder, [4+2] cycloaddition, reaction. This can lead to the two isomers 1 and 2 shown.
Experimentally it has been shown that the formation of the endo-isomer 2 is favoured. By finding which of these is thermodynamically more stable, it can be determined whether this reaction is under thermodynamic or kinetic control. This can be found by using the molecular mechanics method to optimise the geometry of each conformation, and then deliver the relative energies of these conformations.
| Interaction | Energy of Isomer 1/ (kcal/mol) | Energy of Isomer 2/ (kcal/mol) |
|---|---|---|
| Stretch | 1.2834 | 1.2493 |
| Bend | 20.5873 | 20.8508 |
| Stretch-Bend | -0.8420 | -0.8372 |
| Torsion | 7.6431 | 9.5123 |
| Non-1,4 Van der Waals | -1.4099 | -1.5534 |
| 1,4 Van der Waals | 4.2429 | 4.3292 |
| Dipole/Dipole | 0.3771 | 0.4485 |
| Total Energy | 31.8819 | 33.9994 |
In this case, ChemBio 3D was used to carry out the molecular mechanics calculations. This allowed the conformations to be drawn in an easy manner, and then to be optimised using the MM2 force field. It also delivered the energy of the optimised conformation, along with the contributions of each type of interaction considered. For isomers 1 and 2, this gave the energies shown in table 1.
As can be seen the lowest energy conformation is the exo-isomer 1 with an energy of 31.8837 kcal/mol, compared to an energy of 33.9994 kcal/mol for the endo-isomer 2.
As it is not the most thermodynamically stable conformation of the dimer that is predominantly formed, but the higher energy endo-isomer, then this suggests that the reaction is under kinetic control.
This kinetic control is as a result of secondary orbital interactions stabilising the approach of the dienophile cyclopentadiene underneath the diene cyclopentadiene to lower the transition state of the endo product[1].

The hydrogenation of cyclopentadiene dimers only yields the tetra-hydrogenated product after extensive hydrogenation. For normal reaction times, a di-hydrogenated product is formed with two possible isomers, 3 and 4. By using molecular mechanics as before, the relative energies of these two isomers as a result of the above interactions can be found. The relative ease of hydrogenation will then be indicated by which of the two isomers is thermodynamically more stable, assuming the reaction is under thermodynamic control.
| Interaction | Energy of Isomer 3/ (kcal/mol) | Energy of Isomer 4/ (kcal/mol) |
|---|---|---|
| Stretch | 1.2772 | 1.0970 |
| Bend | 19.8262 | 14.5421 |
| Stretch-Bend | -0.8324 | -0.5479 |
| Torsion | 10.8302 | 12.5020 |
| Non-1,4 Van der Waals | -1.2121 | -1.0834 |
| 1,4 Van der Waals | 5.6386 | 4.5071 |
| Dipole/Dipole | 0.1621 | 0.1406 |
| Total Energy | 35.6896 | 31.1576 |
The results from the molecular mechanics calculations can be seen in table 3 and table 4. As can be seen, isomer 4 is more stable, with an energy of 31.1576 kcal/mol, than isomer 3, with an energy of 35.6898 kcal/mol. This suggests that the double bond hydrogenated in isomer 4 is more easily hydrogenated than the one hydrogenated to produce isomer 3, as the product of the former is more thermodynamically stable.
The greatest contribution to the energies of both isomers comes from the bending energy term, as well as the torsional energy term. The reduction in energy between the two isomers is largely due to the reduction in energy of the bending term from isomer 3 to isomer 4. However, there is also a smaller but significant increase in the torsional energy term moving from isomer 3 to isomer 4. Another difference in energy is from a decrease in the 1,4 Van der Waals energy term from isomer 3 to isomer 4. All the other terms are remain largely the same between the two isomers.
Stereochemistry of Nucleophilic Additions to a Pyridinium Ring (NAD+ Analogue)

This technique can also be used to elucidate the mechanisms of reactions such as those involving the NAD+ analogues 5 and 7. Although the molecular mechanics model is unable to find the structures of transition states for reactions where bonds are formed or broken, it can be used to find the most thermodynamically stable conformations of the reactants 5 and 7. From the structures of these conformations, some judgements may be made about the mechanism of the reactions that would help to explain the stereochemistry of the products 6 and 8
For both, the MM2 field was once again applied to structures drawn in ChemBio3D to optimise the geometry. It was necessary to run the optimisation a number of times, each time altering the starting geometry of the five and seven-membered rings in 5 and 7 respectively. This was done because each time the molecular mechanics calculations would converge at a local minimum, which was necessarily the lowest energy conformation. The lowest energy conformation was arrived at when changing the starting geometry no longer lowered to energy gained.
The lowest energy conformation for reactant 5 gives an energy of 39.1325 kcal/mol. In this conformation the carbonyl oxygen is angled above the plane of the adjacent pyridine ring, having an angle of 13.3o above the plane.

The reaction of 5 with methylmagnesium iodide is both regio- and enantioselective, with the methyl group adding preferentially para to the nitrogen in the pyridine ring, but also only to the top face of the ring. To explain the observed regioselectivity, it has been suggested that the reaction proceeds first by coordination of the magnesium to the amide oxygen[2]. This then allows conjugate delivery of the attacking methyl group to the pyridine ring. As the oxygen is angled above the plane of the pyridine ring, as shown by the calculations above, the coordination of magnesium holds the methyl group above the pyridine ring. This means the only way the methyl group can attack the ring is from the top face, explaining the enantioselectivity observed.
The coordination of the methylmagnesium iodide to the amide oxygen could not be modelled by the MM2 force field. This was because when it was drawn into the program it did not have the necessary data to define the magnesium atom. If the data had been available to the program however, it would have been able to minimise the geometry of the methylmagnesium iodide species relative to NAD+ analogue 5, and thus model the coordination.
In the reaction of 7 with phenylamine, the phenylamine once again adds to the top face of the quinoline ring. However, the MM2 calculations show that the lowest energy conformation of 7, with an energy of 64.6241 kcal/mol, has the amide oxygen at an angle of -23.8o in relation to the plane of the quinoline ring. This means that, in contrast to the above situation, the amide oxygen is held below the plane of the ring, and the nucleophile adds to the top face of the ring.
Thus, it can be deduced that no coordination occurs at the amide oxygen[3] and the sterics of each face is the determining factor in the enantioselectivity. As the phenylamine group is relatively bulky, the downwards pointing amide oxygen now acts as a steric sheild, preventing attack of the bottom face.
N.B. - In the above case a bug has been reported with the version of ChemBio3D used to carry out the MM2 calculations, ChemBio3D Ultra 12.0. This bug causes an error when N+ is introduced into the structure, causing the resultant structure to be higher in energy and altering the lowest energy conformation slightly. The cause of this bug is most likely due to the program using incorrect force constants in the calculations.
However, the MOPAC semi-empirical molecular orbital method can be used instead to calculate the lowest energy conformation, as this considers the electronic environment of each atom, rather than classically modelling the geometry of multiple atoms. To find out how the bug affected the lowest energy conformations of the above reactants 5 and 7, the conformations optimised by the MM2 force field were subjected to the MOPAC calculations using the PM6 method.
Overall, this did not have a large impact on the geometries of the molecules. It did however increase the magnitude of the angle of the amide oxygen relative to the aromatic rings in both cases. For molecule 5 this was an increase from 13.3o to 28.8o. For molecule 7 this caused an increase from -23.8o to 43.7o. Thus the MM2 optimisations were sufficient for the points made above, with the MOPAC optimisations just showing that the effects described above are greater than they were thought to be.
Although the effect on the structures gained from the MM2 calculations for the lowest energy conformations has been demonstrated, the effect the bug has on the energies of these conformations can not be found using the MOPAC calculations. This is because the energy gained from the MOPAC calculations is a heat of formation, whereas the energy from the MM2 force field is as a result of the stresses and strains in the molecule. As such, these energies are not comparable.
Stereochemistry and Reactivity of an Intermediate in the Sythesis of Taxol
The molecular mechanics method can also be applied to the problem of atropisomerism. Atropisomerism occurs when rotation about a single bond is hindered, giving a large barrier to rotation. As such rapid conversion between two conformations does not occur at room temperature, allowing the two isomers to be isolated. Molecular mechanics can be applied to this problem to find which of two atropisomers is more thermodynamically stable. This can be useful in cases where one or a mixture of atropisomers is formed in a reaction, but over time all of a sample is converted into just one isomer.
An example of this is an intermediate in the total synthesis of Taxol proposed by Paquette et al[4]. Following an oxy-Cope rearrangement of a substituted norbornane, either molecule 9 or 10 is produced. As can be seen rotation of the carbonyl group is hindered by the bridged nine-membered ring and the fused cyclohexane unit. Thus the carbonyl group is either locked in the up position, as in molecule 9, or in the down position, as in molecule 10.
| Interaction | Energy of Isomer 9/ (kcal/mol) | Energy of Isomer 10/ (kcal/mol) |
|---|---|---|
| Stretch | 2.6649 | 2.5430 |
| Bend | 15.8618 | 10.6586 |
| Stretch-Bend | 0.3904 | 0.3230 |
| Torsion | 18.3138 | 19.5746 |
| Non-1,4 Van der Waals | -1.1505 | -1.1449 |
| 1,4 Van der Waals | 12.6768 | 12.5598 |
| Dipole/Dipole | 0.1445 | -0.1833 |
| Total Energy | 48.9018 | 44.3307 |
| MMFF94 Energy | 70.5533 | 60.5541 |
Over time, all of the product formed slowly converts into the more stable isomer. Using the MM2 method once again, it was found that isomer 10 is the more thermodynamically stable conformation, with an energy of 44.3307 kcal/mol compared to an energy of 48.9016 kcal/mol for the higher energy isomer 10. As such, this is the isomer that predominates over time.
The main difference in the geometries of the two isomers, apart from the orientation of the carbonyl group, is the geometry of the fused cyclohexane unit. In isomer 9 this occupies the higher energy twist-boat conformation, whilst in isomer 10 it is in the preferred chair conformation. As for the difference in energy, the main change between the two isomers is in the bending energy. The reason for this increase is that the bond angles in isomer 9 deviate from their ideal angles by a larger amount than they do in isomer 10. The main culprit for this is the angle about the carbonyl carbon. In isomer 10 this is close to the ideal value of 120o for an sp2 hybridised carbon, with an angle of 119.8o. However, in isomer 9 this same angle is 115.3o. Clearly the strain involved in the latter case raises the energy of isomer 9.
It has been observed that this isomer reacts significantly slowly. This is due to it belonging to a class of compounds called "hyperstable" alkenes. As reported by Scheyer et al[5], when a double-bond is located at the bridgehead of a medium-sized bridged ring the extra strain on the ring, as a result of the the double bond being placed in the ring, is negative. That this strain, the so-called olefinic strain, is negative means that the cycloalkene ring is less strained than the parent hydrocarbon, and thus more stable. This results in a heat of hydrogenation that is lower than usual for an alkene, thus meaning the alkene reacts slowly.
As well as running the optimisation with the MM2 force fields, it was also run with MMFF94 force fields. This gave higher energies for each, but also resulted in isomer 9 being higher in energy than isomer 10.
Modelling Using Semi-Empirical Molecular Orbital Theory
In the above examples it has been shown how molecular mechanics can be useful in solving a number of issues arising from the problem of isomerism. In each case, the lowest energy conformation of a molecule was found by applying an MM2 force field to the molecule, and then making judgements about the selectivity based upon the resulting structure as well as the energies of certain classical interactions that caused strain upon the molecule. Whilst this was sufficient for the cases above, the molecular mechanics method is not sufficient in cases where it is necessary to model the electronic interactions of a molecule. In such cases, it is necessary to use a method that utilises semi-empirical molecular orbital theory. One such example is the regioselective addition of dichlorocarbene.
Regioselective Addition of Dichlorocarbene
The reaction of molecule 12 with electrophilic reagents such as dichlorocarbene is highly regioselective. In this case, the regioselectivity cannot me explained by the mechanical properties of the molecule as neither double bond is significantly more strained than the other, nor are they significantly shielded towards electrophilic attack. Thus the issue comes down to which double bond is the more nucleophilic of the two. As mentioned before, the molecular mechanics method does not use any quantum mechanics in its calculations so cannot model electronic properties of a molecule. In this case, therefore, it is clear that a semi-empirical molecular orbital method must be used to model the molecular orbitals of the molecule and from these make a judgement about the selectivity.
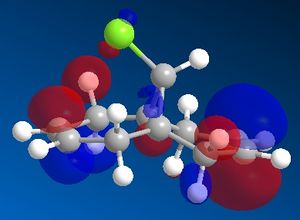
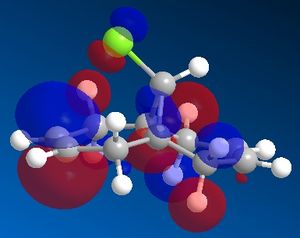
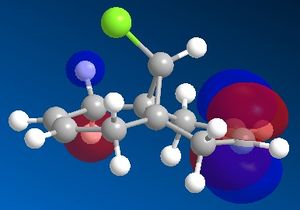
In order to model the molecular orbitals of molecule 12 the geometry was first optimised using the MM2 force field. Following this, the energy was minimised using the MOPAC/PM6 method. This also computed the molecular orbitals of the molecule, and the frontier orbitals are shown below.
 |
 |
 |
 |
In an electrophilic addition, the electron density from one of the double bonds will be donated into the LUMO of an electrophile. As such, the HOMO of molecule 12 will determine the reactivity towards an electrophile. From the MOPAC/PM6 calculations it can be seen that in the HOMO of molecule 12 there is significantly more electron density on the double bond endo to the chlorine atom, whilst there is very little density on the exo double bond. Thus it would seem that the endo double bond is much more likely to undergo electrophilic addition as it is the more nucleophilic of the two double bonds. However it must be noted that in some cases addition may be seen on the exo alkene, such as if the LUMO of the electrophile is low enough in energy, as there is significant density on both the endo and exo alkenes in the HOMO-1 orbital.
Another reason for the stability of the exo alkene to electrophilic addition is that, as can be seen, the LUMO has a favourable overlap with the electron density over the exo alkene on the HOMO-1 orbital. This corresponds to donation from the exo C=C π-orbital (HOMO-1) to the anti-periplanar C-Cl σ*-orbital (LUMO+1). This serves to stabilise the HOMO-1 orbital, making it too low in energy to be react with most electrophiles. It has been recorded that this stabilises the exo alkene by 0.08 eV[6] with respect to the endo alkene. As well as strengthening the exo C=C bond, donation into the C-Cl σ*-orbital increases the anti-bonding character of the C-Cl bond, thus weakening it.
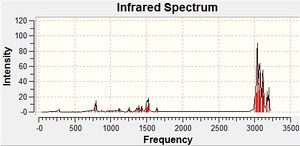
The effect of this interaction can also be seen by modelling the vibrations of molecule 12 using Gaussian. The method used for this was DFT/B3LYP with the 6-31G* basis set. For comparison, the vibrations of a version of the molecule with the exo alkene hydrogenated.
| Derivative | C-Cl/ cm-1 | exo C=C/ cm-1 | endo C=C/ cm-1 |
|---|---|---|---|
| Di-alkene | 770.8 | 1737.0 | 1757.4 |
| Mono-alkene | 775.0 | - | 1758.0 |
| -OH substituted | 765.3 | 1753.0 | 1757.8 |
| -CN substituted | 765.8 | 1706.3 | 1756.5 |
| -SiMe3 | 757.2 | 1688.4 | 1755.6 |
| -BH2 | 759.1 | 1657.8 | 1756.5 |
As can be seen, the C-Cl stretch is lower for the di-alkene, at 770.8 cm-1, than for the mono-alkene, at 775.0 cm-1. This shows that the C-Cl bond is weaker in the di-alkene, where πC=C -> σ*C-Cl donation occurs, than in the mono-alkene, where the exo alkene is not present so no donation can occur. Similarly, it shows that whilst the exo alkene is less nucleophilic than the endo alkene, the former is slightly weaker as it has a lower stretching frequency of 1737.0 for the exo alkene and 1757.4 cm-1 for the endo alkene.
Placing a substituent on one of the carbons in the exo alkene reduces the stretching frequency of the exo alkene. This suggests that the bond strength is weakened by the substitution. The weakening of the bond may be due to donation of electron density from the C=C bond into empty orbitals on the substituted group. This explains why the -BH2 substituted alkene has the lowest energy stretch, as the empty non-bonding p-orbitals on the boron group have the best overlap with the C=C π-orbital.
Structure Based Mini-Project Using DFT-Based Molecular Orbital Method
As well as predicting the course of a reaction, the above techniques can also be powerful tools in distinguishing between isomers of a product. This can be achieved by using DFT-based molecular orbital methods to predict spectroscopic data of the different isomers, such as the IR spectra as above, or NMR spectra. These can then be used to verify data that has been gained experimentally.
One problem this can be applied to is in the production of 2,6-DMT. This is a valuable precursor to 2,6-DMN - used for the synthesis of poly(ethylene naphthalate) and liquid crystal polymers - and was originally produced by separation from naptha oil. However, this has the problem of containing many isomers of 2,6-DMN, some of which have very similar physical properties to it. As such, there have been recent efforts to form 2,6-DMN through the isomerisation of various DMN isomers[7]. Although the barrier to isomerisation between a DMN isomer with the methyl group in the α position and one with the methyl group in the β is relatively low, the barrier between isomers where the methyl group is in the β position in both is much higher. This is due to the β-β double bond being longer than the α-β double bond.
However, in analogous isomers of DMT this problem is avoided as all of the double bond lengths are equal, making isomerisation between two isomers with the methyl group in a β position much more realistic. Thus the catalytic isomerisation of 2,7-DMT to 2,6-DMT has been suggested. Clearly predicting the spectroscopic data of these two isomers is useful to judge whether or not the isomerisation is successful. Furthermore, it has been reported that this isomerisation gives a mixture of isomers as the product, making the spectroscopic data vital for identify which isomers are formed.

Similarly, a regioselective synthesis of 2,6-DMT[8] has been reported based on a Heck coupling followed by a Friedel Crafts Alkylation. During this final acid-catalysed step, it was suggested that the methyl group could migrate, causing the formation of other isomers of DMT. However, it was reported that with a sufficiently strong Lewis acid this did not occur. This finding can be tested by modelling the spectroscopic data of likely isomers of 2,6-DMT to have formed in this fashion, such as 2,7-DMT, and seeing whether the data matches that reported.
Vibrational Analysis
The most complete data available about a large range of isomers of DMT is the IR spectra of them, reported in 1969 by Vaisberg et. al[9]. In this paper the IR spectra of 9 isomers of DMT was reported, including 2,7-DMT and 2,6-DMT. As such, the B3LYP/6-31G(d,p) method described in Part 4 above was used to model the vibrational spectra of the isomers of DMT with one methyl group placed on the aromatic ring and one on the saturated ring.
The main differences in the IR spectra of these isomers will be in the fingerprint region, most notably in a band caused by the out of plane bending of the phenyl C-H bonds. As such, it is the frequency of this vibration that will be compared between the isomers. However, it has been reported that the B3LYP method is insufficient for calculating vibrational bands in the fingerprint region, due to an error of up to 3%[10]. As such the values gained were compared to those reported in literature to judge this.
| Isomer | Calculated Frequency/ cm-1 | Experimental Frequency[9]/ cm-1 | Absolute Difference | Percentage Difference/% |
|---|---|---|---|---|
| 2,5-DMT | 786 | 770 | 16 | 2.0 |
| 2,6-DMT | 826 | 812 | 14 | 1.7 |
| 2,7-DMT | 829 | 820 | 9 | 1.1 |
| 2,8-DMT | 794 | 770 | 24 | 3.0 |
From this it can be seen that whilst the calculated frequencies do not match exactly the experimental values, they do fit the pattern shown in the literature, with α substituted DMT isomers having lower energy bends than for the β substituted isomers. Furthermore, the difference expressed between the α isomers and the β isomers suggests that this technique could be effective in determining between these two types of isomers by modelling the fingerprint region of the IR spectra with the B3LYP method. However, this does come with some caveats. Most notably is the absolute errors shown in the table. Although all the calculated values are higher than the experimental values, the absolute error on each is enough to place it in a band of another isomer - as seen with the calculated frequency for 2,6-DMT being higher than the experimental value for 2,7-DMT. As such, when reading an IR of an unknown isomer this enough to make an error in the characterisation.
 |
 |
 |
 |
By visual inspection of the calculated IR spectra it can be seen that the intensities of the bands in the fingerprint region differ from isomer to isomer. However, the difference is not especially large. This is highlighted when compared to the literature IR spectra, where the relative intensity of the peaks is larger, including the distinctive peaks listed in the table above.
From modelling the IR spectra of the DMT isomers, the differences between the DMT isomers in the fingerprint region have been shown. However, the accuracy of the method means that it is not possible identify which DMT isomer is responsible for an experimental IR spectrum based solely on the calculated IR spectra above.
13C NMR Analysis
As well as predicting the IR spectrum of a molecule, the DFT-based molecular orbital method can also be used to predict other spectroscopic data such as the 13C NMR spectrum. This can be particularly useful for isomers of DMT, as the chemical shift of the methyl carbon will change depending on whether it is in an α position or a β position. The real challenge is whether it can differentiate between two isomers where the methyl group is in the β position on both, such as 2,7-DMT and 2,6-DMT. Unfortunately, however, neither of the syntheses above list the NMR spectrum of any isomers other than 2,6-DMT. For this reason, the 13C NMR data for 2,6-DMT was calculated to test whether this could be reproduced computationally. Following this, the spectrum of 2,7-DMT was modelled to see if there was any difference between the two.
This was done by first optimising the geometry in Gaussian using the MPW1PW91 method with the 6-31(d,p) basis set. Following this, the file was altered and submitted for NMR calculations using the same method.
Below is the calculated 13C NMR spectrum for 2,6-DMT:
 |
| Carbon | Calculated shift/ ppm | Experimental shift[8]/ ppm |
|---|---|---|
| 1 | 132.1 | 134.8 |
| 2 | 122.9 | 126.2 |
| 3 | 125.8 | 128.9 |
| 4 | 130.8 | 133.8 |
| 5 | 133.2 | 136.4 |
| 6 | 126.4 | 129.4 |
| 7 | 39.0 | 37.7 |
| 8 | 30.7 | 29.2 |
| 9 | 32.2 | 31.6 |
| 10 | 32.2 | 29.4 |
| 11 | 22.4 | 20.9 |
| 12 | 23.6 | 22.0 |
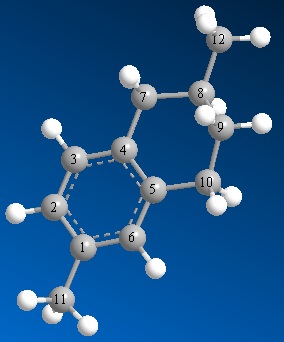 |
As can be seen from the table, whilst the calculated spectrum follows a similar pattern to the experimental spectrum, with the aromatic carbons 1-6 being much further upfield than the aliphatic carbons 7-12, the values returned from the calculations are all slightly different. This difference can be shown in the graph below.
From this it is clear that most of the chemical shifts are slightly lower than found in the literature, with the mean difference being -1.5 ppm and the values having a standard deviation of 2.8 ppm from this. As such, the computational method has reproduced the 13C NMR spectrum rather accurately. The only cause for concern is the resolution of peaks 9 and 10, which are shown as degenerate in the calculations but are clearly different from each other in the literature.
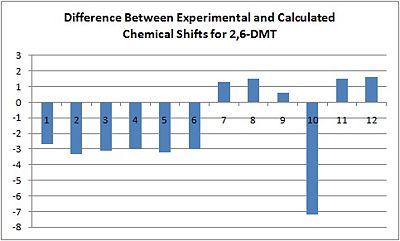 |
However, the standard deviation in the differences suggests that when comparing this calculated spectrum to that of 2,7-DMT there must be a difference of more than 2.8 ppm between analogous peaks for any conclusions drawn from this to be reliable.
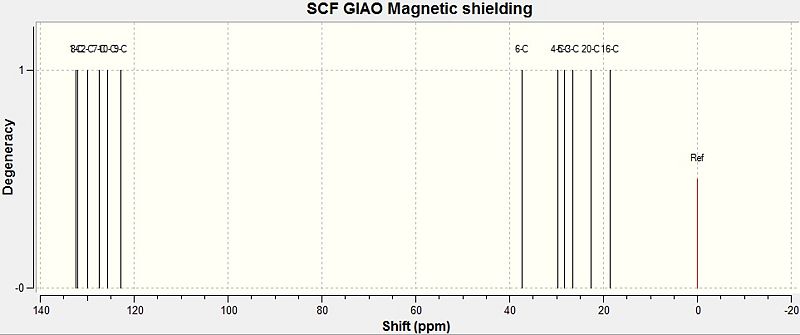
Below is the calculated NMR spectrum for 2,7-DMT. As the labelling for the two models is different, the labelling for 2,7-DMT is shown in brackets.
 |
| Carbon | 2,6-DMT/ ppm | 2,7-DMT/ ppm |
|---|---|---|
| 1 (8) | 132.1 | 132.0 |
| 2 (9) | 122.9 | 122.7 |
| 3 (10) | 125.8 | 125.8 |
| 4 (2) | 130.8 | 130.0 |
| 5 (1) | 133.2 | 132.4 |
| 6 (7) | 126.4 | 126.4 |
| 7 (3) | 39.0 | 26.7 |
| 8 (4) | 30.7 | 29.9 |
| 9 (5) | 32.2 | 28.2 |
| 10 (6) | 32.2 | 37.6 |
| 11 (20) | 22.4 | 22.7 |
| 12 (16) | 23.6 | 18.5 |
 |
From this it can be seen that all of the aromatic peaks are the same, as would be expected as the structure has not changed in this part of the molecule. However, some of the aliphatic peaks are lower then in 2,6-DMT by more than 2.8 ppm. One such peak is for the methyl group attached to the aliphatic ring, which is lower by 5.1 ppm. As such it is possible that this peak may be used to distinguish between the two isomers in experimental 13C NMR spectra.
Although these calculations have shown that the 13C NMR spectra of isomers of DMT can be modelled fairly accurately, and there is a possibility that the aliphatic methyl peak can be used to distinguish between two isomers where the methyl group is attached in the β position, it must be said that this cannot be verified without an experimental 13C NMR spectrum.
Conclusion
In conclusion, it has been seen that the spectroscopic data of the isomers of DMT can be modelled fairly well, and spectra such as the IR show differences between the data. However, with the IR spectra in particular, the accuracy of the method is not enough to be able to make predictions about whether an experimental spectrum belongs to a particular isomer or not. In contrast, the 13C NMR of the isomers can be modelled very accurately, but the spectra are largely similar so it may be difficult again to use them to differentiate between isomers. Furthermore, where there are large differences, the accuracy of these cannot be determined unless experimental NMR spectra are taken of a wider range of DMT isomers.
References
- ↑ Clayden, Greeves, Warren, Wothers, Organic Chemistry, 2001, Oxford University Press, Oxford, pp916-7
- ↑ A. G. Schultz, L. Flood, J. P. Springer, J. Org. Chemistry, 1986, 51, 838DOI:10.1021/jo00356a016
- ↑ S. Leleu, C. Papamicael, F. Marsais, G. Dupas, V. Levacher, Tetrahedron: Assymetry, 2004, 15, 3919-3928, DOI:10.1016/j.tetasy.2004.11.004
- ↑ S. W. Elmore, L. Paquette, Tetrahedron Lett, 1991, 319DOI:doi:10.1016/S0040-4039(00)92617-0
- ↑ W. F. Maier, P. von R. Schleyer, J. Am. Chem. Soc., 1981, 103 (8), 1891-1900DOI:10.1021/ja00398a003
- ↑ B. Halton, R. Boese, H. S. Rzepa, J. Chem. Soc., Perkin Trans. 2, 1992, 447 DOI:10.1039/P29920000447
- ↑ T. Chen, N. Y. Kang, C. W. Lee, H. Y. Kim, S. B. Hong, H. D. Roh, Y.-K. Park. Catal. Today. 2004, 371-376; DOI:10.1016/j.cattod.2004.06.028
- ↑ 8.0 8.1 B. H. Kim, J. G. Lee, W. K. Kim, Y. G. Kim. Org. Process Res. Dev., 2005, 9(6), 814-817: DOI:10.1021/op050072g
- ↑ 9.0 9.1 K. M. Vaisberg, I. I. Shabalin, E.D. Anatonova. J. Appl. Spectros, 1969, 11, 814-817DOI:10.1007/BF00612544
- ↑ H. Lewandowski, E. Koglin, R. J. Meier. Vib. Spectros, 2005, 39 (1), 15-22DOI:10.1016/j.vibspec.2004.10.003
