Rep:Mod:buheatsu
Inorganic Computational Chemistry
Introduction
In order to gain a full understanding of an inorganic reaction, apart from analysing the date from actual experiments, computational results play an important role as well. This allows further understanding of the reaction at a molecular level. By running computational calculations, the most stable conformers and its geometry can be found, other properties of the molecule such as its molecule orbitals, dipole moment and vibrational frequency can also be visualized. In this exercise, several calculations and analysis were done for BH3, TlBr3 as well as the cis and trans isomers of Mo(CO)4(PCl3)2. A mini project was then carried out to compare the geometries between different molecules.
Methods and Basis set used
In this experiment, Ab initio method is used. Ab initio method is one of the examples of electron structure methods which the calculations are based on the law of quantum mechanics instead of parameters derived from experimental process. Another method that is used throughout the experiment is known as Density Functional Methods (DFT), this includes B3LYP, MPW1PW91. It is a similar method compare to the Ab initio methods. One of the advantages of using this method is that this method takes the effects of electron correlation into account such that the interaction between electrons are encountered such that to improve the accuracy of the calculations.
When running a calculation, a model chemistry which consists of a theoretical method with a basis set is need, for example 3-21G, 6-31G(d). Each basis set contains a different approximation to the Schrodinger Equation. The name of the basis set indicates the basic functions that involved in the calculation. For example, 3-21G is the minimal basis set which contains a minimum number of basis function for each atom where 6-31G(d) basis set adds d function to the heavy atoms. The more functions added to the calculation, the more expensive the calculation will be.[1]
In this exercise, the method used will be DFT where in most case, the basis used will be either 3-21G, 6-31(G), LanL2DZ and LanL2MB.
Investigation of BH3 molecule
In this part of the exercise, the structure of BH3 will be optimized using the minimal basis set (3-21G) and B3LYP as method. The optimized structure will then be further investigated, for example, the vibration frequency of BH3, the charge of each of the atoms as well as the molecular orbitals at the HOMO-LUMO region. With the help of these information, a MO diagram of BH3 will be able to generate.
Optimization of BH3
The initial structure of BH3 with B-H bond length = 1.5Å was generated and optimized using GaussView. The optimized structure and the summary of the results are shown in Figure 1 and 2 respectively. The jmol structure can be viewed here:
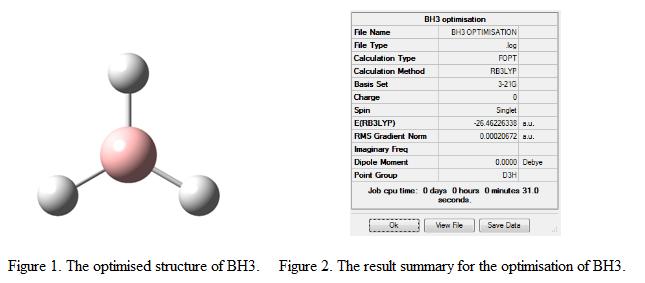
From Figure 2, it shows that the file generated was a log file and the calculation method and basis set are identified to be RB3LYP and 3-21G where the calculation type is found to be FOPT. This summary table also displays the final energy of the optimized geometry as well as its dipole moment. These are found to be -26.46a.u and 0D respectively. The point group of the molecule can also be identified during the process, which is D3H.
The B-H bond length and the H-B-H bond angle was measured and found to be 1.19 Å and 120o where the literature value of the bond length reported by Allen et al was found to be 1.19 Å.[2]By modelling the structure of BH3 using VSEPR theory and from the literature, it was found that the bond angle in BH3 was 120o.[3] These shows that the computational results matches with the values reported in the literature. It is reckoned that as the size of the molecule is small such that the type of basis set and method used will not result in a big difference between the results. The optimization results can be visualized graphically. This is as shown below in Figure 3 and 4 respectively.
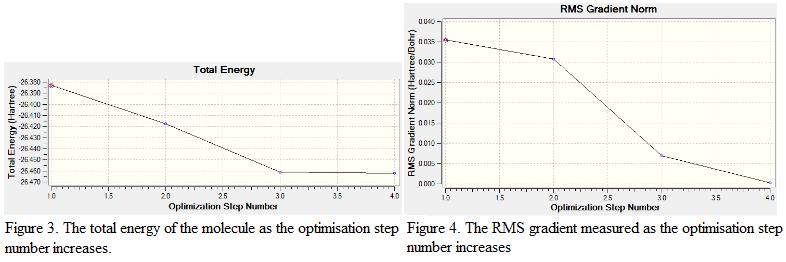
From Figure 3, it is found that as the optimization step number increases, the energy of the molecule becomes more negative. This shows that as the optimization process proceed further, a more stable geometry is generated. Notice that the energy change recorded during the last 10 steps of optimization is small, indicates that energy starts to converge and a stable geometry is generated.
The RMS (Root Mean Square) gradient represents the change in energy of the molecule with respect to the spatial separation of the atoms. As the energy decreases, the geometry becomes more stable and hence, the RMS gradient starts to approach to zero. Once the value of RMS gradient equals to zero, the structure is regarded as optimized and is having the lowest energy geometry. From the result summary table, it is found that the RMS gradient is 0.00020672. This showed that the structure is fully optimized and the minimum point is found.
Apart from the graphically representation and result summary, the log file generated after optimization will give useful information about the optimization process. This is shown under Figure 5.

For a complete optimization, its maximum force, RMS displacement and maximum displacement must be below the cutoff value of 0.00045, 0.0012 and 0.0012. In addition, its RMS force and must be equals to zero. From the output file, it can be seen that the requirement for a complete optimization is matched such that the geometry of BH3 obtained is considered to be optimized.
Natural Bond Orbital (NBO) Analysis
NBO analysis is carried out in terms of localized electron-pair bonding unit. The same basis set and method was used (i.e 3-21G and B3LYP). The charges of each atom can be computed such that its Lewis acid and base property can be determined. The charges of the atoms found in BH3 are calculated the results are shown under Figure 6.

Referring back to the result summary as shown in Figure 2, the overall dipole moment of the molecule was found to be 0. This is consistent with the numerical charge shown in Figure 6: The sum of the negative charges on the hydrogen atoms should equals to the charge on boron. This results in an overall charge of zero for the molecule. This can also be explained by the symmetry of the BH3 molecule (i.e they are symmetrical). The boron centre is highly electron deficient such that it bears a positive charge and appears to be green in colour (representing positively charged region) whereas the hydrogen atoms are bearing a negatively charges such that they appear to be red in colour (representing negatively charged region). From this charge analysis, this showed that BH3 is bearing an electron deficient boron and appears to be a strong Lewis base.
The boron centre in BH3 is known as sp2 hybridized. In fact, by carrying out NBO analysis, this showed that the three H atoms contributed 100% s-orbital during the bonding process, where the boron atom contributed 33% and 66% of s- and p- orbital character to the molecule. The computational results matches very well with the prediction.
Molecule Orbital (MO) of BH3
The structure and the energies of the molecule orbital found in BH3 can be generated using GaussView by entering the key work pop=full in the input file. The MO generated is compared with the MO proposed using Linear Combination of Atomic Orbitals (LCAO) approach. This is shown under Figure 7. Note that the same basis set and method was used to generate the MOs for BH3 (i.e 3-21G and B3LYP).

Comparing between the MO generated by GaussView and the MO generated by LCAO theory, it is found that the shape of the orbitals and the arrangement of the orbitals are the same with the phases matching with each other. This showed that by using qualitative MO theory, the shape of the orbitals can be predicted accurately.
Notice in Figure 7 that there is no information about the atomic orbital energies as well as their splitting energy. In addition, depending on the energy level of a1’ (from B fragment) and e’ (from H3 fragment), the position of 3a1’ and 2e’ will be different. If the energy level of a1’ is lower than e’, the resulting 3a1’ MO will be of lower energy than 2e’ where as if the interaction between s-s is strong than s-p interaction, the energy of 3a1’ MO will higher than 2e’. In this case, the energy difference between 3a1’ and 2e’ MO is around 4 kJ mol-1.
Hence, it can be concluded that although qualitative MO theory can be used to predict the shape of the MO, however, it cannot be able to predict the order of which the orbitals are filled due to the lack of electron density in the antibonding orbitals. In order to improve the prediction of MO energy level, it is suggested that to use a better basis set, for example, 6-311G(d,p) which encounters more terms during the calculation process.
The output file of this calculation can be found in the following link: DOI:10042/to-5753
Vibrational Analysis of BH3
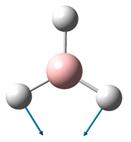
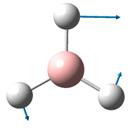
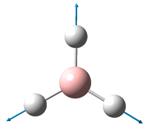
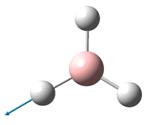
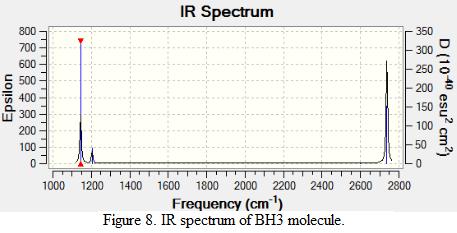
The frequencies of vibration of a BH3 molecule can be computed by adding a key work freq into the input file. The vibration modes of the molecule were recorded and shown under Table 1. All the vibration frequencies as shown in the table are found to be positive, this shows that the structure is fully optimized. The IR spectrum was also generated and is shown under Figure 8. Note that the point group of BH3 is D3H and the basis set and method of the calculation remains the same as the prvious section (i.e 3-21G and B3LYP)
Consider the structure of a BH3 molecule, which is a non-linear molecule. Hence, it will have 3N-6 normal modes of vibration where N is the number of atoms in the molecule. Within the modes for the “-6” terms, three of these vibrations are trans motion where the rest are rotational. By applying the formula, 6 vibration modes for a BH3 molecule are found.
By investigating the IR spectrum shown in Figure 8, only three peaks are presented in the spectrum, which is out of expected. This is explained by using the vibration frequency data shown in Table 1. It is found that two degenerate pairs of vibration presented (i.e at 1204cm-1 and 2737cm-1). As such, only two peaks are shown. Notice that the infra-red intensity for the vibration mode found at 2598cm-1 is zero. This is because the stretching of the B-H bonds in vibration mode 4 is symmetric such that the dipole moment cancels each other out. Note that infra-red signals depends on the change of dipole moment, therefore, the intensity of this vibration is shown to be zero and is not appear in the spectrum.
Table 1 also includes the literature values for the BH3 vibration frequencies. It is found that as the frequency of the vibration increases, the computational results starts to deviate from each other. For example, in vibration mode 6, the calculated value was found to be 2737cm-1 where the literature value is 2602 cm-1, giving a difference of 135cm-1 (~5%). The main reason for this deviation is due to the fact that in actual reality, the vibrations of molecule are anharmonic whereas the vibrations are assumed to be harmonic during the calculation process. This shows that the calculations is only useful to predict the number and the form of vibration modes presented in a molecule. If the frequencies of the vibration is to be calculated, the harmonic oscillation behaviour of molecule should be taken into account.
The output of this calculation is shown in this link: DOI:10042/to-5769
Optimisation of TlBr3 Molecule
In this part of the exercise, the structure of TlBr3 is optimised. TlBr3 has a similar structure as BH3. Therefore, it is expected that the properties of the molecule (e.g dipole moment and bond stretching frequencies) should be similar. When the structure is fully optimised, a frequency analysis was carried out. These results are them compared against each other (i.e with BH3).
Optimisation of TlBr3
The structure of TlBr3 is optimized. Notice that thallium is an element beyond the third row of the periodic table. Hence, the size of the nuclei will be large relative to the size of a boron atom that was used in the previous exercise. As such, the minimal basiss set (i.e 3-21G) is no longer suitable for optimisation. This is because the electrons near the nucleus of Tl have to be treated differently, via Effective Core Potentials (ECPs). This includes some relativeistic effect, which is essential to carry out calculations for large atoms. Therefore, in this exercise, LanL2DZ is used as the basis set where the method and the type of the calculation remained the same (i.e RB3LYP and FOPT). The optimized structure and the summary of the results are shown in Figure 9.
The jmol structure can be viewed here:
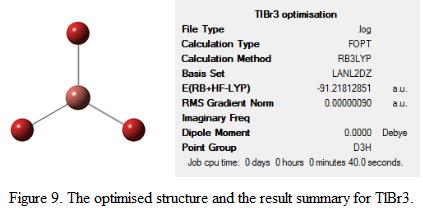
The result summary table provides information about the type of calculation and the method used for the optimization. From the table, it can be seen that the energy of the optimized structure is -91.22 a.u. The bond length and bond angle of TlBr3 was found to be 2.65Å and 120o respectively after optimization. The literature value of the Tl-Br bond length and bond angle was 2.51Å and 120o respectively.[4] This showed that by using this basis set and method, the bond angle can be predicted accurately but not the bond length. Note that TlBr3 is having the same structure as BH3 in the previous section, obviously, it adapts the same point group (i.e D3h) as BH3. This information is also shown under the result summary table.
The output file of the optimised structure of TlBr3 can be viewed here: DOI:10042/to-5767
Vibrational Analysis of TlBr3
A frequency analysis was preformed for TlBr3 using LanL2DZ and RB3LYP as the basis set and method. The same method and basis set must be used when carry out vibrational analysis such that the frequencies calculated are based on the optimized geometry obtained from the last part of the exercise. This would also improve the consistency of the results. The frequencies of the vibration and the IR generated from the calculation are shown under Table 2 and Figure 10. Note that the point group of TlBr3 is D3h (i.e same as BH3.)
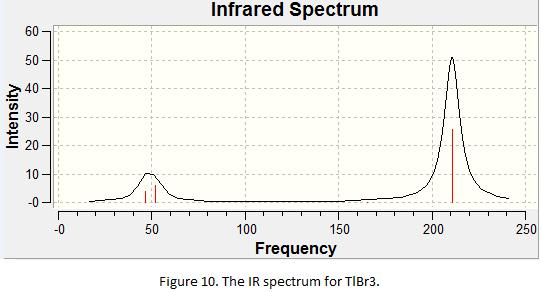
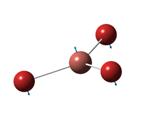
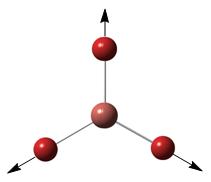
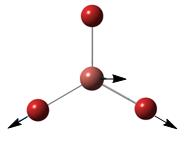
Table 1 shows that there are two pairs of degenerate vibration and one IR inactive vibration. As a result, one would expect three peaks to be appeared on the IR spectrum. In fact, this is shown in the IR spectrum in Figure 10. As the frequencies for the vibration mode 1, 2 and 3 are very similar (i.e 46 and 52), the peaks overlap with each other, forming a large broad peak. The “low frequencies” and “real normal mode” of the calculation is obtained from the log file and is shown under Table 3.
| Low Frequency /cm-1 | -3.42 | -0.00026 | -0.004 | 0.0015 | 3.94 | 3.94 |
| Real Normal Mode Frequency cm-1 | 46.43 | 46.43 | 51.14 | 165.27 | 210.69 | 210.69 |
Frequencies analysis is important when determining the most stable geometry of the structure. This is because when the geometry is optimized using the key work opt in Gaussview, the geometry calculated can either be a minimum or a maximum point. By taking the second derivative of the potential surface, it can ensure that the geometry calculated is a minimum but not a saddle point or a maximum. From the table, it is found that the “low frequencies” generated by the calculations are close to zero. This shows that the results obtained are fairy reliable for analysis.
In addition, all the read normal mode frequencies are positive with no imaginary frequencies (imaginary frequencies are represented by negative frequencies). This further ensures that the calculated geometry is a minimum point. By comparing the vibration frequencies of BH3 and TlBr3, it was found that the vibration frequencies of TlBr3 is relatively smaller than for the vibration frequencies found in BH3. This is due to the fact that BH3 is a lighter molecule such that if the same energy is applied to the molecule, BH3 will be able to stretch and bend at a higher frequencies relative to TlBr3, which is a large molecule with a heavier Tl centre.
The vibration analysis of TlBr3 can be assessed using this link: DOI:10042/to-5768
Limitaion of using Gaussview
During the optimization, it was found that in some cases, the bonds in the molecule “disappear”. One of the example will be the optimization of BH3 in the first part of the exercise. This is shown in Figure 11.
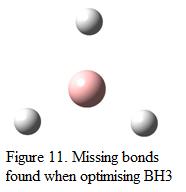
Although the B-H bonds shown in the figure “disappear”, that does not mean the bonds are not existed. In fact, Gaussview contains an internal list of bond distances. These bond distances are pre-defined such that if the bonds drawn are larger than the “default” bond length, Gaussview will not consider the present of the bond in the molecule. Typically, as organic bonds are shorter than inorganic bonds and Gaussian is often used to investigate organic system, this will have an effect of the “disappearance” of the B-H. Moreover, when a molecule of BH3 is drawn in Gaussview, its default bond length was found to be 1.18Å. Before optimization, the bond length of B-H was changed manually to 1.5Å. This elongation of bond distance causes the bond to be disappeared.
This leads to the discussion of the definition of a “bond”. A bond is formed when separate atoms moving towards each other until they get very close together such that there is an attraction force appears between the positively charged nuclei and the negatively charged electrons in the atom. There are few types of bonding, for example, if the electron pairs are shared between atoms, this will result in the formation of a molecule, which is known as covalent whereas if there is a transfer of electrons between atoms to achieve a full octet and to form ions, this is known as ionic bonding. There are other types of bonding such as hydrogen bonding, which refers to the interaction between hydrogen atom and some electronegative element such as oxygen and nitrogen.
Analysis of The Isomers of Mo(CO)4L2
In this part of the exercise, the isomers of Mo(CO)4PR2 will be investigated. Consider the structure of the cis and trans isomers of Mo(CO)4PR2 as shown in Figure 12.

The spectroscopic properties of the isomers are investigated and reported by Darensbourg et al that if a metal carbonyl complex has only one band of absorption within the region, the complex would likely have a trans- arrangement whereas if four absorption bands were found, the complex would likely be in a cis- arrangement.[5]
In this exercise, it is intended to investigate the vibrational mode of the two isomers as well as to carry out optimization of the structure such that stable isomer can be identified. However, instead of optimizing Mo(CO)4PR2, Mo(CO)4Cl2 is optimized as Cl- demonstrated a similar electronic contribution to the bonding property compared to phenyl groups and their size are large enough to be considered to have steric effect. By replacing the phenyl group with Cl-, the computational time will be reduced greatly.
The First Optimisation of Mo(CO)4Cl2 Isomers
The structure of cis- and trans- Mo(CO)4Cl2 isomers are optimized using Gaussian. The result summary tables for the two optimization processes are shown under Figure 13.
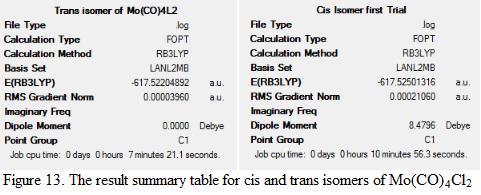
The method and basis set used in the calculation was RB3LYP and LANL2MB. The reason for using LANL2MB instead of 3-21(G) is because of the involvement of a third row element, Mo in the molecule. The energy, dipole moment as well as the Mo-P and P-Cl bond lengths are measured. This is shown under Table 4. Note that the literature value used corresponds to the structure of [Cr(CO)4(PPh3)2]. This is because the literature values for Mo(CO)4Cl2 isomers cannot be found. As mentioned in previous session that the electronic contribution from PPh3 and Cl- to the metal is the similar and that Mo is in the same group as Cr, therefore, the data can be used to compare with the calculated results.
| Items | Trans-isomers (calculated) | Literature values of Trans-isomers[6] | Cis-isomers (calculated) | Literature values of Trans-isomers[7] |
| Dipole moment /D | 0.00 | N/A | 8.48 | N/A |
| Total Energy /a.u | -617.52 | N/A | -617.53 | N/A |
| RMS Gradient | 0.000040 | N/A | 0.00021 | N.A |
| Averaged Mo-P Bond Length /Å | 2.48 | 2.36 | 2.53 | 2.58 |
| Averaged Mo-C Bond Length /Å | 2.10 | 1.87 | 2.08 | 2.04 |
| Averaged P-Mo-P Bond Angle /o | 180.0 | 176.7 | 95.5 | 104.6 |
| Averaged P-Mo-C (Trans to P) Bond Angle /o | 89.4 | 89.5 | 176.0 | 163.7 |
| Averaged P-Mo-C (Cis to P) Bond Angle /o | N/A | N.A | 90.6 | 80.6 |
| Jmol | N/A | N/A |
Note that the dipole moment for cis- isomers is 8.48D compare to that of trans-isomers (0D). This is due to the fact that trans-isomers are symmetrical and all the possible dipole moment effect is cancelled out. The stability of the isomer can be explained by using steric effect as well as trans effect theory. If the ligands are bulky and large, steric hinderance effect would increase between the two adjacent groups (i.e orthogonal) such that the overall stabilization energy of the complex would decrease whereas if the complex was a trans-isomer, the two groups would be further away from each other and hence remove the steric strain in between them. As a result, one would expected that the trans-isomer should be more stable relative to the cis-isomer. However, the computational results showed that in fact, the energy difference between the cis- and trans-isomers is 7.8 kJ mol-1, showing that cis-isomer is more stable. This can be explained by using trans-effect theory.
Consider the trans effect intensity for CO, it is high in the series. This indicates that CO is a strong trans ligand. By investigating the position of the CO ligand relative to each other in each of the isomers, it is found that in the trans-isomers, the four CO ligands present are trans to each other whereas only two CO ligands are found in the cis-isomer. As there is a fewer number of “trans CO pair” found in the cis-isomer, this makes the molecule to be more stable due to the minimization of trans effect. In this case, the trans effect contribute to the stability of the isomer overweigh the steric factor contribute. Hence, the cis-isomer is found to be more stable.
Notice that the differences between the literature values and the calculated values are small and similar. However, it is believed that if the structure is re-optimized, a more stable structure will be obtained. Hence, the difference between the literature and the calculated values will be reduced. The second optimsiation for the Mo(CO)4Cl2 isomers are preformed and is shown in the next section.
The Second Optimisation of Mo(CO)4Cl2 Isomers
To ensure that the geometry obtained in the last part of calculation is the global minima, it is decided to perform a second optimization based on the isomers generated from the previous section. Instead of using LANL2MB as the basis set, LANL2DZ is used. This would generate a more accurate result. The Cl-atoms in the molecules are adjusted manually such that both the PCl3 groups in the trans-isomer are eclipsed with one another. Note that the geometry of the cis-isomer is adjusted manually as well such that one of the Cl-atom in the PCl3 group points down and the other Cl-atom in another PCl3 group points down and parallel to the axial bond. The optimized geometry, together with the result summary is shown in Figure 14 as below whereas the bond angles and the bond length of the molecule is displayed under Table 5.
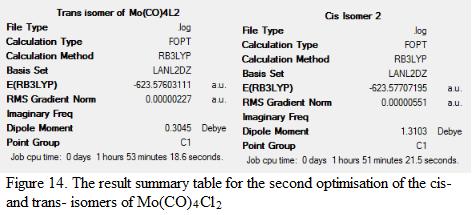
| Items | Trans-isomers (calculated) | Literature values of Trans-isomers[8] | Cis-isomers (calculated) | Literature values of Trans-isomers[9] |
| Dipole moment /D | 0.31 | N/A | 1.31 | N/A |
| Total Energy /a.u | -623.576 | N/A | -623.577 | N/A |
| RMS gradient | 0.0000027 | N/A | 0.00000551 | N/A |
| Averaged Mo-P Bond Length /Å | 2.44 | 2.36 | 2.51 | 2.58 |
| Averaged Mo-C Bond Length /Å | 2.05 | 1.87 | 2.06 | 2.04 |
| Averaged P-Mo-P Bond Angle /o | 177.3 | 176.7 | 94.2 | 104.6 |
| Averaged P-Mo-C (Trans to P) Bond Angle /o | 90.0 | 89.5 | 176.1 | 163.7 |
| Averaged P-Mo-C (Cis to P) Bond Angle /o | N/A | N.A | 89.1 | 80.6 |
| Jmol | N/A | N/A |
From the calculation, it is found that the energies of the isomers are further lowered (i.e -617 a.u to -623 a.u). The decrease in the RMS gradient indicates that the geometry is further optimized and the point of global minima is reached. The difference of the energy of the isomer is calculated to be 2.73 kJ mol-1 (N.B the energy difference found in the first optimization process is around 7.8 kJ mol-1). In addition, the difference between the calculated and the experimental bond angle and bond length decreases as well, showing that the geometry obtained from the second optimization process is more accurate. However, as the literature values are corresponding to [Cr(CO)4(PPh3)2] and the size of Cr is smaller than Mo, the deviation of the result is inevitable.
Changes can be made to the PR3 ligand such that the ordering of the cis and trans isomers can be altered. Knowing that CO has a relatively large trans effect compare PR3 and other ligands such as F-, OH- and SCN-. By alternating the R group attached to the phosphorus, the level of trans effect can be adjusted. For example, if Cl- is used (which has a relatively lower trans effect compare to CO), the trans effect is large such that the cis-isomer appears to be the most stable isomer. By lowering the trans-effect presents in the complex, this will stabilize the tran-isomer and will become more stable relative to the cis-isomer. The output files for the calculations are as follows:
Optimisation of trans-isomer 1: DOI:10042/to-5770
Optimisation of trans-isomer 2: DOI:10042/to-5774
Optimisation of cis-isomer 1: DOI:10042/to-5772
Optimisation of cis-isomer 2: DOI:10042/to-5773
Frequency Analysis of Mo(CO)4Cl2 Isomers
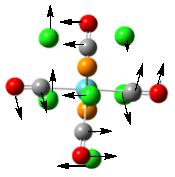
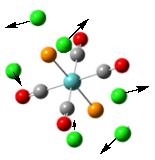
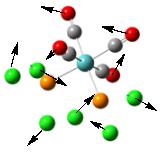
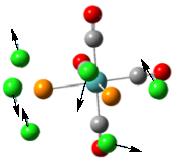
To further confirm the structure obtained from the second optimization is a global minimum, a frequency analysis was carried out. It is found that there are more than 45 vibrational modes presented in the molecule. Some of them occur at a very low frequency. These vibrational modes are identified and are shown under Table 6. The motions of the vibration are shown using the arrows marked on the figure.
From the table, it can be seen that most vibrations are rocking motion, vibrating with a small magnitude with a small intensity. Knowing that the frequency of the vibration is directly proportional to the energy of the vibration, by applying the equation: Energy = hf where h and f is the Planck’s constant and frequency, the energy requires to promote this vibration can be calculated. Indeed, the energy requires for vibrational mode (1) to occur is no more than 1 x 10-22kJ mol-1, which can be assessed at room temperature. In addition, as the gap between each of the vibration level is small, this can be assessed at room temperature, resulting in the rocking motion observed. Note that stretching a bond requires a relative large amount of energy, which is not observed in room temperature.
In addition, the lowest possible vibration is found to have a positive value. This further confirmed that the structure of the isomers is optimized to reach a global minima. The C-O bond stretching frequencies for both isomers are identified and are shown under Table 7. These values are compared against experimental values. Note that although the point group is recognized to be C1 as shown in the result summary table, the actual point group symmetry is found to be C2v. The IR spectrum is also predicted and is shown under Figure 15. The CO stretching frequencies are enlarged on the spectrum and are shown under Figure 15.
| Type of Isomer | Calculated Frequency /cm-1 | Calculated Intensity | Experimental Frequencies /cm-1[10] | Summetry Point Group |
| Trans- | 1950 | 1475 | 1896 | Eu |
| Trans- | 1950 | 1467 | 1896 | Eu |
| Trans- | 1977 | 1 | N/A | B1G |
| Trans | 2031 | 4 | N/A | A1G |
| Cis- | 1945 | 763 | 1986 | B2 |
| Cis- | 1949 | 1497 | 1994 | B1 |
| Cis- | 1958 | 632 | 2004 | A1 |
| Cis- | 2923 | 598 | 2072 | A1 |
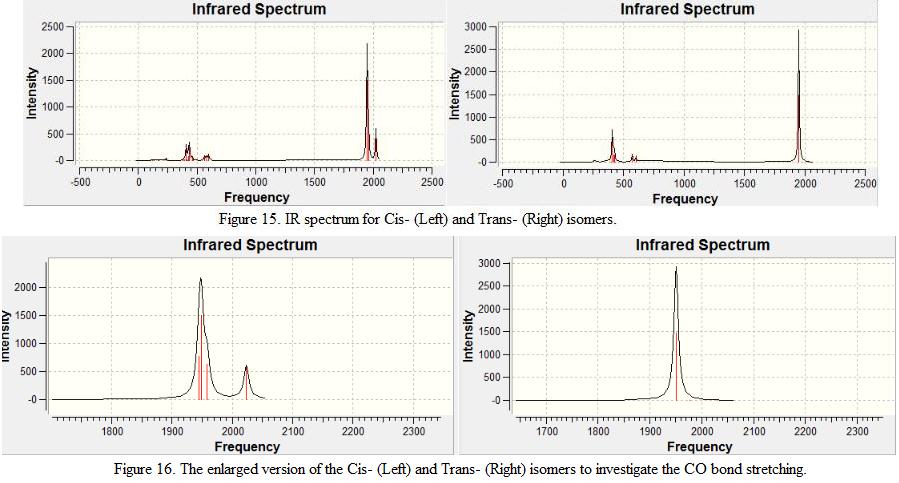
From the Table 7, Figure 15 and 16, it was found that although four vibrational modes are identified for the trans-isomer, only one major peak is presented on the spectrum. This can be explained by implementing the intensity of the vibration modes. It is found that two of the four C-O stretching frequencies are low in intensity (intensity of 1 and 4 respectively). As result, the intensity of the peak is too small to be shown on the spectrum. In addition, it is also found that a pair of degenerate vibration mode is presented at 1950cm-1. As a result, only one major peak is detected.
In the beginning of this exercise, it is reckoned that if a metal carbonyl complex has only one band of absorption within the region, the complex would likely have a trans- arrangement whereas if four absorption bands were found, then the complex would be in a cis- arrangement. In fact, it is found that the computation results matches with the experimental observation. This showed that by using computational technique, the possible products and their geometries can be predicted.The output file of the frequency calculation is shown as below:
Frequency analysis of Trans-isomer: DOI:10042/to-5783
Frequency analysis of Cis-isomer: DOI:10042/to-5784
Mini Project - Investiation of Ni4 and Si4 Cyclic Cluster
Introduction
Recent research reported that by capping inorganic clusters such as Ni4 and Si4 using polymerizable organic groups,[11] a new form of inorganic-organic hybrid polymer can be produced. In order to synthesize this type of polymer efficiently, it is important to understand the geometry of Ni4 and Si4. In this mini project, it is intended to investigate the geometry of the Ni and Si tetramers as well as its binding energy per atom. Frequency and NBO analysis will also be carried out such that its spectroscopic properties and reactivity can be evaluated.
Optimisation of Ni4 Tetramer
Giordano et al [12]showed that bare Ni4 cluster will have different geometries, for example, Td, C2v and D4h. In order to distinguish the most stable geometry adapted by the Ni4 clusters, calculations have been preformed for all three geometries. As heavy atoms are involved in this cluster (i.e Ni), pp (pseudo-potentials) is used such that calculations can be made easier and faster. The method and basis set used is B3LYP and gen respectively. The optimized results are as shown in Table 8.
| Symmetry of the Ni4 clusters | Td | D4h | C2v |
| Energy /a.u | -677.09 | -677.08 | -677.06 |
| Dipole Moment | 0.0022 | 0.0003 | 0.0009 |
| Bond Length | 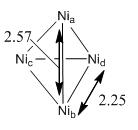 |
 |
 |
| Jmol |
From the table, it can be seen that tetrahedral structure Td is more stable relative to the rest of the geometries. This can be explained in terms of the size of a nickel atom. The atomic radius of Ni is found to be 1.62Å [13], which is relatively large. As such, consider the Ni-Ni bond length in the three structures as shown in Table 8, it is found that the Ni-Ni bond length in D4h and C2v is relatively shorter than in Td. As a result, if Ni is having a D4h or a C2v structure, there will be an increase in nuclei repulsion between atoms. Therefore, Ni4 clusters tend to adapt a Td structure. The literature value for the bond length found in Ni4 Td structure is 2.25Å [14]. This shows that the calculated results match with the experimental results. Notice that as the structure of the clusters are not perfectly symmetrical, as a result, dipole moment is observed.
The output file of the optimization can be viewed using the link as follows:
Optimisation of Td geometry: DOI:10042/to-5881
Optimisation of D4h geometry: DOI:10042/to-5880
Optimisation of C2v geometry: DOI:10042/to-5877
Optimisation of Si4 Tetramer
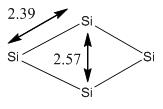
The possible geometries of Si4 tetramer are investigated. Zhai et al[15] proposed that Si4 clusters tend to form two possible geometry: D2h and C2v. It is also believed that Si4 may exist as Td structure. Therefore, optimization is also preformed for the Td geometry. The results are shown under Table 9.
| Symmetry of the Ni4 clusters | Td | D4h | C2v |
| Energy /a.u | -15.40 | -15.40 | -15.40 |
| Dipole Moment | 0.002 | 0.0001 | 0.0003 |
| Bond Length | 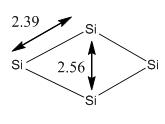 |
 |
 |
| Jmol |
|
During optimization, it was found that the optimized structure of Td was the same as the structure of C2v. Therefore, the position of the Si atoms were alternated manually to form a Td structure and optimized again. However, it was found that the structure turned back to C2v after optimization. It is obvious that the geometry C2v is more preferable than Td such that the change in geometry during optimization is observed. By comparing the energy of the tetramers, it is found that C2v appears to be a stable isomer compared to Td and D4h. This matches with the results obtained by Slee et al [16], which stated that C2v has the lowest energy. The literature bond length reported by Balasubramanian et al [17] was 2.30Å, which is smaller than calculated. This is mainly because the method and basis sets used are different. The method and basis set used by Balasubramanian et al was MRSDCI and 6-31(G). However, as the bond lengths are relatively similar, the results are still reliable to use for the next stage.
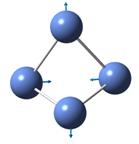
It is reckoned that the reason for Si4 cluster to adapt a C2v symmetry is due to the size of the atoms. The atom radius of Si is found to be 1.46Å,[18] which is shorter than the atomic radius of Ni. As a result, by forming a structure with C2v symmetry, this will be able to achieve maximum interaction between the nucleus and stabilize the structure (unlike Ni4, which by forming C2v structure would destabilize the structure due to its large atomic radius).
Frequency Analysis
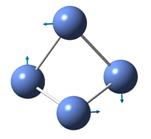
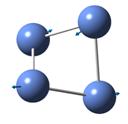
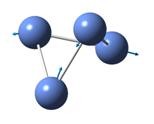
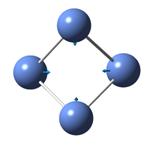
In order to confirm the structure obtained in the previous section is the global minimum, a frequency analysis was carried out for both Ni4(Td) and Si4 (C2v). The low frequencies were recorded for both clusters and are shown under Table 9. Note that the same basis set and method was used for the calculation (pp was included in the calculation).
| Ni4(Tid) | Low Frequencies /cm-1 | -0.0004 | 0.0003 | 0.0005 | 13.95 | 14.89 | 20.95 |
| Si4(D2h) | Low Frequencies /cm-1 | -1.14 | 0.00 | 0.00 | 0.00 | 5.60 | 6.40 |
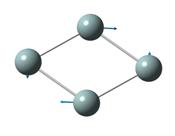
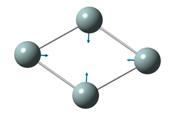
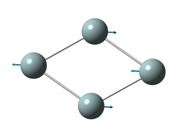
From the table, it can be seen that most of the low frequencies are close to zero, this indicates that the geometry optimized from the previous exercise is a global minimum. The real mode frequencies are also identified and are shown below under Table 10 and 11. The IR spectrum is also recorded and is shown in Figure 17.
From the table, it is found that there are three vibrational modes that are IR inactive (mode 1, 2 and 6) as they are exhibiting symmetric stretch. There is one pair of degenerate vibration pair found (mode 4 and 5), which exhibits rocking motion and the intensity is not as high as mode 2. This is because the intensities of the vibrational mode depends on the change in dipole moment, as the dipole moment in vibration mode 4 and 5 is weaker than mode 2, the intensity of mode 2 will be relatively larger. From the results as shown in the table, it is therefore predicted that 2 peaks will be presented in the spectrum. In fact, this matches with the IR spectrum generated.
Table 11 shows that there is no degenerate vibration mode presented in Si4 cluster. However, 4 IR inactive modes with symmetry stretch were observed. As a result, it is predicted that there will be 2 peaks found on the IR spectrum.

From the frequency analysis, it is found that all the vibrational mode are having a positive vibration frequencies, this shows that the structure optimized in the previous section is indeed a global minima. Both clusters consist of 4 atoms, by applying 3N-6 rule for non-linear molecule; it is found that there should be 6 vibrational mode presents. In fact, the calculation does show the presence of the 6 vibrational modes. In addition, by comparing the vibrational frequency of Ni4 and Si4 cluster, it is found that the vibrational frequency for Si4 is higher than Ni4. This can be explained by the fact that Si is a lighter atom with Ar = 28.1 (Ni has an atomic mass of 58.9). As such, Si atoms will be able to vibrate at a slightly higher frequency. The output file for the frequency calculation can be view in the following link:
Frequency Analysis of Ni4(Td): DOI:10042/to-5891
Frequency Analysis of Si4(Td): DOI:10042/to-5889
Energy of Formation
The bonding energy per atom can be calculated by using the following equation:
ΔE = -{Ecom – [Eatom x 4]}/4
Where Eatom can be Si or Ni
This can be used to characterize the stability of the cluster. In order to calculate the binding energy of the cluster, the energy of a single Si and Ni atom was calculated using the same basis and method (i.e B3LYP and gen). The energy of the Si and Ni atom was found to be -3.72 a.u and -169.19 a.u respectively. By applying the equation stated above, the binding energy per Si and Ni atom is found to be 343.2 kJ mol-1 and 222.1 kJ mol-1 respectively. The literature value for the binding energy per Ni atom was found to be 207kJ mol-1 [19] (binding energy for Si is not available). By comparing with the literature and the calculated value, this shows that the values are similar. Again, as the method and basis used are different (the basis set and method used in the literature was LCGTO-FF-DF), the value of energy may not be the same. The output file for the optimisation of the single Si and Ni atom is shown in the link as follows:
Output file for optimsiation of Si atom: DOI:10042/to-5903
Output file for optimsiation of Ni atom: DOI:10042/to-5904
Natural Bond Orbital (NBO) Analysis
In order to investigate the charge of the atoms in the cluster, NBO analysis was performed using the keyword pop=(full, nbo). The charges of the atoms found in the clusters are calculated and the results are shown under Figure 18.
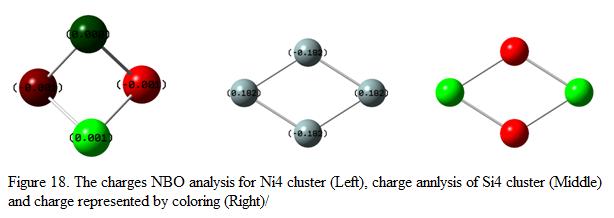
Refer back to the result as shown in Table 9, the overall charge of the Si cluster was found to be 0.0003. From Figure 19, this showed that the overall dipole moment is zero (the sum of negative charges on the Si equal to the sum of positive on the Si atoms). Consider the geometry and the charges of the Si4 cluster, it was found that the Si atoms found on the “edge” of the cluster (i.e atoms in green) are positively charge where the atoms in the “middle region” of the cluster are negatively charge. This showed that the “edge” of the cluster is like to attack by nucleophile.
Table 8 shows that the dipole moment of the Ni4(Td) cluster is 0.0022D. This indicates that the charges of the atoms found in the Ni4 cluster cannot be cancelled out to form a neutral species and the cluster is not symmetrical as well. Consider the numerical analysis of the charges found in the Ni4 cluster, it is found that two of Ni atoms bear a negative charge of -0.001 where the rest of the two Ni atoms are found to have a charge of +0.001 and 0.000. As such, the resulting dipole moment is found to be -0.001. Notice that the resulting dipole moment is small such that the calculated dipole moment is small too (i.e 0.0022D).
Molecular Orbital Analysis
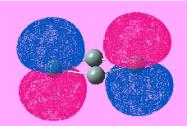
The reactivity and the interaction of the cluster can be determined by studying their molecule orbitals, particularly the HOMO-LUMO region. The MO is generated using the keyword pop=full (same method and basis set is used) and the MO generated are as shown below in Table 12 and 13 respectively.
| MO Type | Figure showing the MO | Energy of the MO /a.u |
| HOMO -1 |  |
-0.144 |
| HOMO |  |
-0.144 |
| LUMO |  |
-0.081 |
| LUMO +1 |  |
-0.078 |
| LUMO +2 | 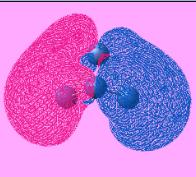 |
-0.078 |
Table 13 showed that two sets of degenerate orbitals are presented. They are of similar shape with the phases different from each other. The Ni4 (Td) structure has 4 electronic configuration (known as t13t21). As a result, the first order of Yahn-Teller distortion effect can be observed.Notice that the degeneracy of the orbitals will be removed when the symmetry has changed from Td to C3v or C2v. Petko el al shows that the cluster tends to have unfilled spin orbitals below the HOMO and can be used to represent excited state [20]. Referring back to the diagram as shown under Table 8 for the optimized structure of Ni4 cluster, it is found that the distance between Ni-atoms are different (2.57 and 2.25Å respectively). Petko el al realized that the spin density Δs is unevenly distributed over the atoms. Contributions from Nic and Nid are relatively smaller than Nia, which has a longer bond length. This is due to the fact that the s-orbitals of Nic and Nid contribute to the HOMO of the cluster where the s-orbitals of Nia contribute to the LUMO instead.
Consider the number of electrons found in the Si4 cluster, 8 electrons are presented. According to the 4N+2 aromaticity rule, Si4 cluster is found to have a σ-antiaromatic system with a rhombus distortion. However, Si4 retains its π-aromaticity due to the two delocalized π electrons. Consider the formation of Si42-, two electrons will enter the LUMO, LUMO +1 or LUMO+2 region. If the electrons are added to the pπ based orbitals, the cluster now becomes both π and σ- antiaromatic. Hence, the structure is like to change from rhombus to a parallelogram shape. In contrast, if the electrons are added to the Pσ-based instead, the cluster tends to remain its π-aromaticity and will distort to a butterfly shape.[21]The output file for the frequency calculation can be view in the following link:
Molecular orbital Analysis of Ni4(Td): DOI:10042/to-5891
Molecular orbital Analysis of Si4(Td): DOI:10042/to-5889
Conclusion
By using Ab initio method, the global minima and its saddle point on a potential energy surface can be identified. By using frequency analysis, the IR spectrum and the intensity of the peak can be predicted. Furthermore, the activity of the molecule can be evaluated by investigating the molecule orbitals in the HOMO-LUMO region. Hence, most molecules, even those with complex structure can be investigated by computational methods. For example, the activities and the conformation on ionic liquids are studied using Ab initio method. Properties of ionic liquids can be predicted first before carrying out the actual experiment. This reduces the waste of chemical and making the investigation process more efficient. In order to improve the computational results (i.e making the results more accurate compared to the experimental ones), it is suggested that to use a better basis set, for example B3LYP 6-311G (d,p).
References
- ↑ J. Foresman, A. Frisch, “Exploring Chemistry with Electronic Structure Methods”, 1996, 2nd Edition, pg. 5, 94 – 95
- ↑ F. Allen, I. Bruno, Acta Crystallographica Section B, 2010, 66(3), 380–386DOI:10.1107/S0108768110012048
- ↑ William H. Brown, Christopher S. Foote, “Organic Chemistry”, 1995, 2nd Edition, pg 227
- ↑ J. Glaser, G. Johansson, Acta Chemica Scandinavica A, 1982, 36, 122 - 135 DOI:10.3891/acta.chem.scand.36a-0125
- ↑ M.Darensbourg, D. Darensbourg, J. Chem. Ed, 1970, 47, 33
- ↑ D. W. Bennett, T. A. Siddiquee, J. Chem. Crys., 2004, 34, 353-359.DOI:10.1023/B:JOCC.0000028667.12964.28
- ↑ D. J. Darensbourg, R. L. Kump, Inorg. Chem., 1978, 17, 2680-2682. DOI:10.1021/ic50187a062
- ↑ D. W. Bennett, T. A. Siddiquee, J. Chem. Crys., 2004, 34, 353-359.DOI:10.1023/B:JOCC.0000028667.12964.28
- ↑ D. J. Darensbourg, R. L. Kump, Inorg. Chem., 1978, 17, 2680-2682. DOI:10.1021/ic50187a062
- ↑ F.A. Cotton, Inorg. Chem., 1964, 3, 702 DOI:10.1021/ic50015a024
- ↑ U. Schubert, Chem. of Material, 2001, 13(10), 3487 - 3494 DOI:10.1021/cm001258r
- ↑ L. Giordano, Surface Science, 2001, 473, 213 - 226 DOI:10.1016/S0039-6028(00)00974-2
- ↑ http://www.physlink.com/reference/ChemicalElements/nickel.cfm
- ↑ C. Luo, Modelling Simul. Mater. Sci. Eng, 2002, 10, 13 - 20
- ↑ H. Zhai, ChemPhysChem, 2004, 5, 1885 - 1891 DOI:10.1002/cphc.200400077
- ↑ T. Slee, Inorg. Chem, 1988, 28(12), 2256- 2261 DOI:10.1021/ic00311a004
- ↑ K. Balasubramanian, Chamical Physics Letters, 1987, 135, 283 - 287
- ↑ http://environmentalchemistry.com/yogi/periodic/Si.html
- ↑ P. Petkov, Physical Chemistry Chemical Physics, 2006, 8, 1282 - 1291 DOI:10.1039/b518175e
- ↑ P. Petkov, Physical Chemistry Chemical Physics, 2006, 8, 1282 - 1291 DOI:10.1039/b518175e
- ↑ H. Zhai, ChemPhysChem, 2004, 5, 1885 - 1891 DOI:10.1002/cphc.200400077


