Rep:Mod:bitoku
Computational Inorganic Lab, 3rd year, by Thomas CHAVAS
Study of the BH3 molecule
The aim of this section is to model the BH3 molecule, to optimise its structure and to predict its physical and spectroscopic properties using Gaussian and Density Functional Theory (DFT) calculations. The results obtained will then be compared with literature.
Optimisation and frequency analysis of the molecule
The BH3 molecule was initially optimised using the B3LYP method coupled to a low-level basis set, namely the 3-21G basis set. The upside of using a low-level basis set and hence generating low-accuracy results is that the optimisation of the molecule is very quick.
The output file shows that the gradient of the potential energy surface (i.e. its first derivative) is of the order of , which suggests that the program has reached a stationary point in the energy surface. This is confirmed when we look at the actual .log file, which tells us that force and displacement convergences have actually occurred.
However, the only certainty so far is that we have reached a stationary point in the energy profile of the molecule; this does not tell us whether we are at a maximum or at a minimum (i.e. whether we have reached a transition state or the ground state of the molecule, respectively). In order to check what kind of stationary point we have reached, we shall carry out a frequency analysis, which essentially computes the second derivative (or curvature) of the potential energy surface. We know from mathematics that the curvature of a function is positive at a minimum but negative at a maximum. Hence, if the frequency analysis returns some negative frequencies, we will know for sure that we have not reached a minimum; on the other hand, if none of the vibrational frequencies are negative, then we will know for sure that we have reached a minimum in the energy profile.
Thus, a frequency analysis of the molecule was carried out on the optimised structure, using the same method and basis sets as for the optimisation step. The additional keywords "pop=(full,nbo)" were added to request for an analysis of the electron density and molecular orbitals of the molecule, which we will study later on.
The first thing to check after the frequency analysis is that the energy of the molecule returned after this step is the same as the energy of the optimised structure. This is indeed what we observe, as both structures have an energy of . Next, we verify that we haven't obtained any negative frequencies by checking in the .log file returned by Gaussian. The "low frequencies" returned by the program after the frequency analysis of this molecule are the following:
-0.6560, -0.0170, -0.0017, 20.1986, 21.4875, 21.4975
As one can see, three of these vibrations are actually negative but very close to zero. The fact that these negative frequencies are very small (in absolute value) is only due to numerical difficulties, and so we can safely say that we have reached a minimum in the energy potential, and that our optimised structure is the ground state structure.
Now that we are certain that we have the ground state geometry of this molecule, let us have a look at some of its structural and spectroscopic properties.
The optimised B-H bond length is of 1.19 Å, and the H-B-H angle is of 120°, in agreement with the trigonal planar structure of the molecule.
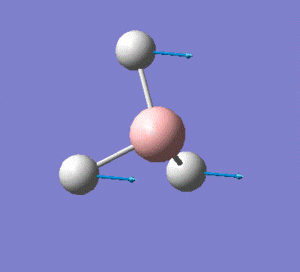
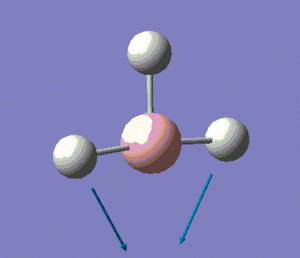
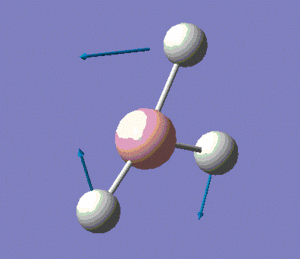
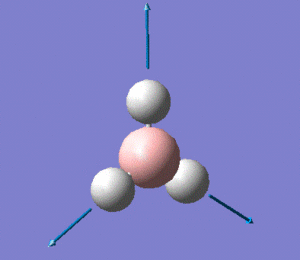
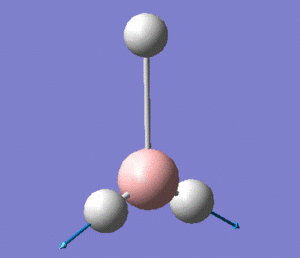
The molecule has vibrations, where is the number of atoms in the molecule. Gaussian computed all of the different vibrations of the molecule during the frequency analysis, and the results are summarised in the table below.
Note: the displacement vectors are represented to help visualise the vibrations.
Gaussview also allows us to visualise the predicted IR spectrum which is shown below.
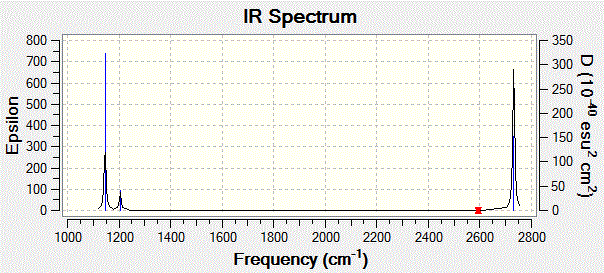
The first thing to note is that we only observe three peaks on the IR spectrum, although we know that this molecule has 6 vibrations, as shown in the table above. This means that not all the vibrations computed by Gaussian show up on the IR spectrum. This can be rationalised if one notices that modes 2 and 3 are degenerate, and so are modes 5 and 6, which explains why modes 2 and 3 show up as a single peak at 1205 cm-1, and why modes 5 and 6 both show up a single peak at 2731 cm-1. Moreover, one should bear in mind that a molecular vibration must involve a change in the overall dipole moment of the molecule for it to be IR-active. Looking back at vibration mode no. 4, we see from the displacement vectors that the vibration is completely symmetric (it is in fact a symmetric stretch), which means that there is no overall change in the dipole moment of the molecule. This explains why this particular vibration has an intensity of 0 (as reported in the table above), which in turn explains the absence of a peak at 2593 cm-1 on the spectrum.
NBO analysis of BH3
A population analysis of the optimised molecule was carried out using Gaussian, and the NBOs of the molecules were visualised using Gaussview. The full set of data returned by the program can be accessed by clicking on the following link: DOI:10042/to-7481 .
The information contained in the .log file can partly be visualised using Gaussview. We can observe, for example, the charge distribution in the molecule, as shown in the picture below.
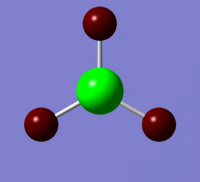
A deep red colour indicates a highly negative charge, while a bright green one indicates a highly positive charge. This is in agreement with the experimental observation that BH3 is a Lewis acid, i.e. an electron-pair acceptor. Gaussview can also display the actual numbers which are represented by the different colours. We find that all three hydrogen atoms have a charge of -0.093 a.u., while the boron atom has a charge of 0.278 a.u..
However, having a look at the actual .log file provides us with a lot more information than the Gaussview interface can display. For instance, we find that the boron atom is sp2 hybridised, with 33.33 % contribution from an s-orbital, and 66.67 % contribution from a p-orbital. Moreover, the results tell us that the boron atom contributes 45.37 % to each boron-hydrogen bond, and that all the hydrogen atoms contribute 55.51 % to their respective bond with boron. Finally, we see that the boron has a p-orbital which is labelled as LP (for lone pair) but that its occupancy is of 0, which rationalises the Lewis acidity of boron in this compound.
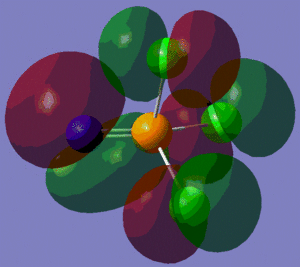
The population analysis also allows us to view the shape and energies of the computed molecular orbitals for BH3. This is very useful, as it enables us to compare the qualitative MO diagram of this molecule with the quantitative one computed by Gaussian. The eight lowest-energy MOs for BH3 are presented in the table below, along with their symmetry label (note that only the first four are occupied orbitals).
| MO number | MO 1 | MO 2 | MO 3 | MO 4 | MO 5 | MO 6 | MO 7 | MO 8 |
|---|---|---|---|---|---|---|---|---|
| MO representation | 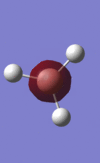 |
 |
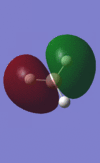 |
 |
 |
 |
 |
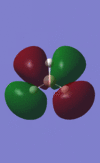 |
| Energy/(a.u.) | -6.77 | -0.515 | -0.353 | -0.353 | -0.0682 | 0.166 | 0.179 | 0.179 |
| Symmetry label D3h | a'1 | a'1 | e' | e' | a'2' | a'1 | e' | e' |
We can see from the energies returned by Gaussian that MOs 3 and 4 are degenerate (both have an energy of -0.353 a.u.) and so are MOs 7 and 8, as they both have an energy of 0.179 a.u..
As we can see from the comparative diagram shown below, this is indeed what is predicted in the qualitative MO diagram. Moreover, we observe that the ordering of the MOs in the qualitative diagram agrees with the quantitative analysis carried out by Gaussian. Not only that, but the shape of the LCAO MOs is very similar to that of the quantitative MOs, apart maybe for the two highest unoccupied MOs (MOs 7 and 8), for which the qualitative analysis predicts that the lobes are more or less "parallel" to each other, but where the quantitative analysis predicts that those lobes will actually be at a certain angle of each other. These observations nonetheless demonstrate that our pictorial way of "solving the Schrodinger equation" is actually fairly accurate. It should however be mentioned that it is very hard to use qualitative MO diagrams to estimate the relative "heights" of the different MOs, or to compare the energies of the MOs of two different compounds in order to -for example- predict trends in ionisation energies or electron affinities; this is were quantitative analysis comes into play.
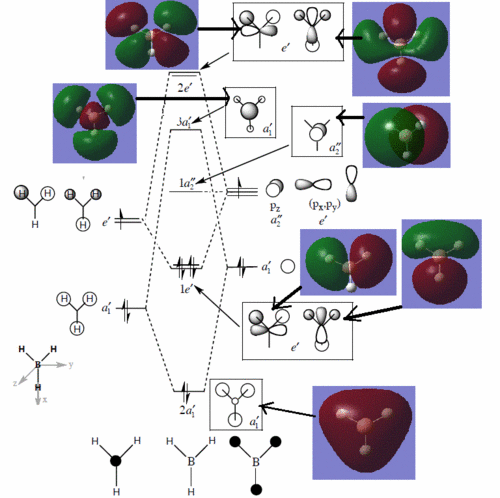
Comparison between qualitative and quantitative MO diagrams. Note: the qualitative MO diagram was taken from Dr. Hunt's notes of her second year lecture course, Molecular orbitals in inorganic chemistry.
Study of the TlBr3 molecule
In this instance, we shall again make DFT calculations using the B3LYP method but coupled this time to a medium-level basis set and pseudo-potential (as opposed to the low-level pseudo-potential that we used for BH3), namely the LANL2DZ one.
The .log file returned by Gaussian after this optimisation can be accessed by clicking on the following link. As one can see from this file, convergence has actually occurred. This is confirmed by the value of the RMS gradient which, as reported in the summary table shown below, is well inferior to 0.001.
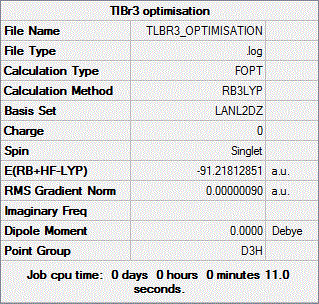
It should be mentioned that in this case, the geometry of the molecule was fixed to the D3h point group prior to optimisation.
This confirms that we have indeed reached a stationary point in the potential energy surface of the molecule, let us now have a look at the vibrational analysis to confirm that we have indeed reached a minimum on that surface.
The vibrational analysis was carried out using the same method (B3LYP), basis set and pseudo-potential (LANL2DZ) as for the geometry optimisation. WHY? The entire .log file returned by Gaussian can be viewed by clicking on the following link. We observe that the energy of the optimised structure is equal to that of the molecule which was returned by the vibrational analysis (-91.21812851 a.u.), which confirms that the latter was carried out on the right structure.
The "low frequencies" listed on this file are the following: -3.4226, -0.0026, -0.0004, 0.0015, 3.9361, 3.9361. Clearly, three of these are negative, but all of them have a value that is small enough in absolute value for us to assume that the negative values are only due to numerical difficulties. Hence, we can conclude that we have indeed reached a minimum on the potential energy surface (remember that the vibrational analysis computes the curvature of the surface, and that a positive curvature at a stationary point indicates that we are at a minimum on the surface).
Now that we are certain that our optimised structure is the ground-state structure, let us investigate some of the properties of the latter.
We observe that the Tl-Br bond length is of 2.65 Å, which agrees reasonably well with the literature[1] value of 2.512 Å. The difference between these two values is probably due to the fact that the bond length of this molecule was determined in aqueous solution, where the authors of the journal postulate that two water molecules bind to the thallium centre, thus forming a trigonal bipyramidal compound. The electronic and geometric changes brought about by the ligation of two water molecules will undoubtedly affect the bond lengths in that molecule. Finally, the bond angles in the molecule returned by Gaussian are of 120°, which is consistent with the D3h geometry which we imposed on the program prior to optimisation.
The low frequencies for TlBr3 are the following ones: -3.4226, -0.0026, -0.0004, 0.0015, 3.9361, 3.9361.
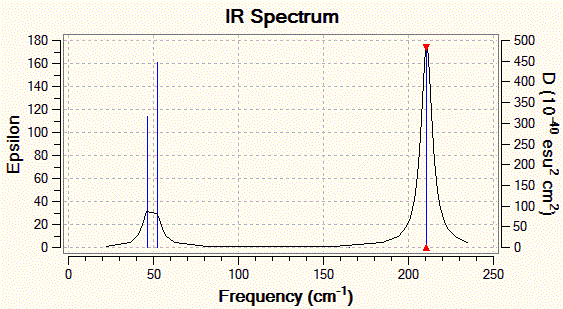
The lowest energy "real" mode is a degenerate mode, with two vibrations having a frequency of 46 cm-1. This vibrational mode is actually of much lower energy than the lowest energy vibrational mode for BH3 (1145 cm-1); this reflects well the fact that as we go down the periodic table, elements have more diffuse orbitals and as such the bonds they form are weaker. Indeed, the vibrational frequency of a bond is proportional to the square root of its force constant, which is why IR spectroscopy can be used to estimate bond strengths. This observation is consistent with the fact that the Tl-Br bond length is more than twice as long as the B-H bond length in BH3.
Those two low-energy vibrations for TlBr3 are presented in the table below, and the predicted IR spectrum for the compound is shown below this table.
| Mode number | Visual representation of the vibration | Frequency/(cm-1 | Intensity/(a.u.) | Symmetry D3h point group |
|---|---|---|---|---|
| 1 | 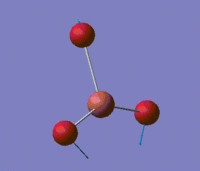 |
46 | 4 | E' |
| 2 | 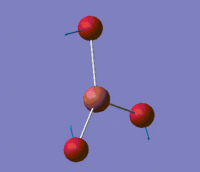 |
46 | 4 | E' |
A final remark would be on the fact that Gaussview does not always represent bonds between atoms. This is because Gaussview only bases itself on the distance between atoms to decide whether or not the bond between them should actually be represented as a line. This means that if a certain threshold distance between two atoms is exceeded, the program will not display a bond between the two. This strategy generally works well for organic compounds, but breaks down with many inorganic compounds, where the bond lengths span a wider range of values. But what is a chemical bond? One could argue that any form of attractive interaction between two atoms which leads to the cohesion of a higher order structure (i.e. a molecule) is a chemical bond. In that sense, there exists a bond between the boron and hydrogen atoms in the BH3 molecule studied previously since the .log file clearly states their existence and characteristics (energy, orbital contributions, etc...).
Cis- and Trans-isomerism in Mo(CO)4(PPh3)2
The aim of this section will be to predict and analyse thermodynamic and spectroscopic properties of these two isomers using Gaussian, and to see how they relate to experimental observations.
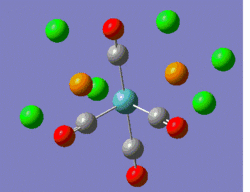
The first thing we are looking to do is to make reasonable approximations to simplify our model of the two molecules, in order to minimize the time required to carry out the calculations. In this case, we observe that the PPh3 ligands have a great number of atoms and will thus require a lot of computing power to be modelled. However, their inclusion in our model is not central to understanding the relative stability of the two isomers, or to predicting the IR spectra of the latter (indeed, we will be looking at the carbonyl stretches in the IR spectra of the two isomers, which are characteristic enough to allow us to distinguish between the two isomers). Hence, we shall replace the phenyl rings by chlorine atoms, which are also sterically demanding, but much simpler to model.
Geometry Optimisation
We first need to optimise the structures of our two complexes. To do so, both compounds were initially submitted to the SCAN suite for optimisation with the B3LYP method coupled to a low-level basis set and pseudo-potential, namely LANL2MB. A loose convergence criteria was also set, in order to get a roughly right geometry fairly quickly (the optimisation criteria were refined in the next step anyway). This indeed returns fairly accurate bond lengths and angles, but the computing of accurate dihedral angles requires tighter electronic convergence criteria and the use of a higher level basis set and pseudo-potential.
Hence, the two optimised structures returned by Gaussian were further optimised using the same B3LYP method, but coupled this time to the LANL2DZ basis set and pseudo-potential. Moreover, the electronic convergence criterion was increased by adding "int=ultrafine scf=conver=9" to the additional keywords. Finally, the dihedral angles of the PCl3 groups were slightly modified, such that the geometry of the two isomers before submission to the SCAN suite are the ones shown in the 3D representations below.
 |
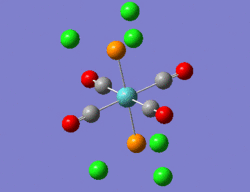 |
Shown below is the key information to take away from the summary tables returned by Gaussian after this optimisation step. Note that the full set of data returned by the program was published on D-space and can be accessed by clicking on the links shown at the bottom of each table. It should also be mentioned that the 3D structures returned by Gaussian after this step, which can be visualised in Gaussview are, to the eye, identical to those presented previously. Consequently, the reader is referred to those structures shown above if 3D visualisation of the compounds is required.
|
|
The first thing to notice from those tables is that in both cases, the RMS gradient has reached - by the end of the optimisation process - a value inferior to 0.001. This suggests that the job has converged, and this can be verified by looking at the .log file itself, which shows that force and displacement convergence has actually occurred.
Next, we observe that the dipole moment of the cis-isomer is much larger than that of the trans-isomer, the difference between the two values being of approximately 1 debye. This can be rationalised by looking at the structure of the two isomers. Indeed, in the trans-isomer, the strongly electron-withdrawing PCl3 ligands draw electron density away from the metal in perfectly opposite directions, and hence the two vectors representing dipole moment cancel out (the intensity of those two vectors is the same, since both groups are equally electron-withdrawing). Similarly, the carbonyl ligands withdraw electron density from the core of the complex in perfectly opposite directions due to their spatial arrangement, and with a similar intensity. Hence, the overall dipole moment of the compound is close to zero (this value is not actually equal to zero, and this is probably due to the PCl3 groups being eclipsed and not staggered).
It should also be pointed out that there is a small, but non-negligible, positive difference between the energy of the cis-isomer and that of the trans-isomer. More quantitatively, the cis-isomer is more stable than the trans- one by approximately 3 kJ/mol. We know that there are steric and electronic contributions to the value of the final energies reported above. From inspection of the structures of the isomers, we can immediately say that the steric repulsion will be lower in the trans-isomer than in the cis-analogue, since the bulky PCl3 groups are further away from each other in the former than in the latter. We thus have to conclude that the electronic contribution must account for the lower energy of the cis-isomer, and we can rationalise this inference by reminding ourselves that carbonyl ligands have a stronger trans-effect than their PCl3 counterparts.
Another thing which should be noted is that Gaussian predicts that the two Mo-P bonds in the cis-isomer will both have a length of 2.51 Å. It is found that this value is slightly larger than the Mo-P bond length in the related compound Mo-P(Me)3, which is of 2.46 Å according to literature[2]. With that being said, one should bear in mind that in this compound, the two bulky PCl3 groups are cis- to each other and probably prevent each other from having a "normal" Mo-P bond length. In the trans-isomer, on the other hand, the only ligands in the vicinity of the PCl3 groups are the less sterically demanding carbonyl groups, which is probably the reason why the Mo-P bonds in this complex are of 2.44 Å, which is closer to the value reported in literature[2].
Observing this difference in Mo-P bond lengths between the two isomers shows a potential path to follow if one wanted to change the relative ordering of the cis- and trans-isomers in terms of their stability. Indeed, making the phosphorus ligands bulkier would undoubtedly destabilise the cis-isomer more than the trans- one. Hence, if the PCl3 ligands were to be replaced by, say, tBu3 groups, we would probably observe that the trans-isomer is more thermodynamically stable than its cis-counterpart.
Finally, we observe that the P-Mo-P angle in the cis-isomer is of 94.2°, which is reasonably close to the literature[1] value of 94.78°, confirming once more that our geometry optimisation was successful. The P-Mo-P angle in the trans-isomer (177.4°) could not be compared with a literature value, but is fairly close to the expected 180° angle of an octahedral complex, which shows that our model "makes sense". F. Cotton, D. Darensbourg, S. Klein, B. Kolthammer, Inorg. Chem., 1982, 21, pp294-299
Vibrational Analysis
In this section, we shall focus on the analysis of the carbonyl stretches of the two isomers since those vibrations are, as we shall see, characteristic of each isomer. Hence, they allow us to distinguish between the two isomers fairly easily using a common characterisation technique, namely IR spectroscopy.
Using the optimised geometries shown above, a frequency analysis was carried out using the same method, basis set and pseudo-potential as for the geometry optimisation.
The table below summarises the properties of the carbonyl vibrations in the cis-isomer, and compares the frequency of the vibrations with those reported in literature[3]. Since we are looking at how well our model predicts the properties of the cis-[Mo(PPh3)2(CO)4] complex, the literature frequencies in the table below refer to the vibrations of this compound.
For the cis-isomer, the low frequencies reported by Gaussian in the output file are the following:
-1.7962, -0.0007, -0.0007, -0.0006, 0.9839, 1.4480
We observe four negative frequencies (out of the six "low frequencies") which are all very small in absolute value, thus confirming that the geometry optimisation was successful in the sense that a minimum was reached in the potential energy curve (the fact that some of them are negative is only due to numerical difficulties). This is also confirmed by the fact that the energy returned by Gaussian after vibrational analysis (-623.57707192 a.u.) is identical to the one which was obtained after geometry optimisation.
Note: the mode numbers assigned to the vibrations are arbitrary. The full vibrational analysis can be accessed by clicking on the following link: http://hdl.handle.net/10042/to-7573.
The first thing to notice is that the vibrational analysis was able to predict the correct number of carbonyl stretches which would appear in the actual IR spectrum of the compound. This is crucial bit of information since, as we shall see in the vibrational analysis of the other isomer, it allows us to distinguish the two isomers. Not only that, but the vibrational analysis has also returned carbonyl stretching frequencies which are all within 2% of the experimental value, showing how accurate those fairly simple calculations are.
Let us now have a look at the vibrational analysis of the trans-isomer.
The table below summarises the properties of the carbonyl vibrations in the trans-isomer, and compares the frequency of the vibrations with those reported in literature[3]. Since we are looking at how well our model predicts the properties of the trans-[Mo(PPh3)2(CO)4] complex, the literature frequencies in the table below refer to the vibrations of this compound.
For this isomer, the low frequencies listed in the output file are the following:
-2.2411, -1.6324, -0.0004, -0.0003, 0.0000, 2.9016
Again, the fact that we observe very small values for the "low frequencies" confirms that a minimum was reached in the potential energy curve, even if some are negative. Moreover, the energy of the molecule returned by Gaussian after vibrational analysis (-623.57603091 a.u.) is identical to the one which was obtained after geometry optimisation.
Note: the mode numbers assigned to the vibrations are arbitrary. The full vibrational analysis can be accessed by clicking on the following link:http://hdl.handle.net/10042/to-7574.
From this table, we observe the computational prediction that the trans-isomer only has two IR active vibrations (the intensity of the vibrations at 1977 and 2031 cm-1 are comparatively small and as such they are not visible on the IR spectrum). Moreover, these two vibrations are so close to each other in terms of frequency (1950 cm-1 versus 1951 cm-1) and intensity (1475 versus 1467) that it could be postulated that they will show up as a single peak on the actual IR spectrum of the compound. This is indeed what is observed experimentally, as literature reports a single peak at 1896 cm-1 for this isomer. Again, the percentage difference between the predicted and observed stretching frequencies is of 3%, which shows how well experimental and theoretical values agree.
One might wonder why the trans-isomer has fewer IR-active carbonyl stretches than its cis-counterpart. This can be rationalised if we bear in mind that only vibrations which induce an overall change in the dipole moment of the molecule are IR active. Indeed, the trans-isomer belongs to the D4h point group and is therefore of higher symmetry than the cis-isomer, which belongs to the C2v point group. This means that for the cis-isomer, in which the carbonyl groups are not opposite to each other, the symmetric carbonyl stretches (modes 3 and 4 in the table) are IR active since the sum of their associated vectors does not equal zero. On the other hand, in the trans-isomer, the symmetric carbonyl stretches (modes 7 and 8) are IR-inactive since the carbonyl ligands are trans- to each other, and the sum of the vectors representing those stretches equals zero.
Hence, comparing the two vibrational analyses, we can see that the mere number of carbonyl stretches in the IR spectrum allows us to immediately distinguish the two isomers, showing how powerful our model is, considering the approximations that we made. This is even clearer when we look at the predicted spectra of the two molecules, below.
 |
 |
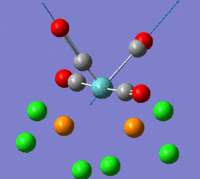
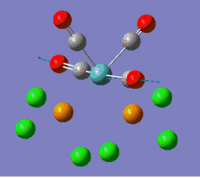
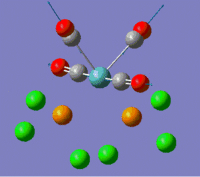
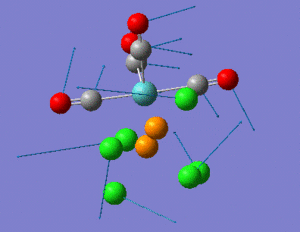
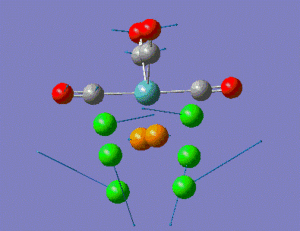
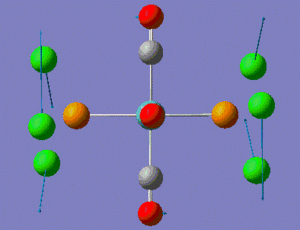
To conclude this section, we shall have a look at the low frequency vibrations of the two compounds we studied. The table below summarises the key information needed to discuss them.
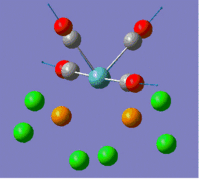
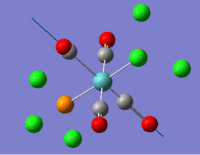
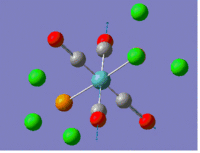
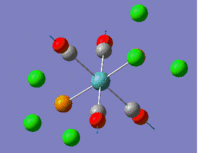
Note: the displacement vectors have voluntarily been lengthened, so as to make the vibrations clearer in the pictures.
We observe that all of those low-frequency (and hence low-energy) vibrations are rocking motions. One might wonder what happens to these low energy vibrations when the thermal energy provided by the surroundings is of approximately 25 meV, i.e. when we are at room temperature. From statistical thermodynamics, we know that the highest energy configuration of a system with multiple energy levels is an equal population of all the accessible levels, i.e. the ground energy level can never be empty. This means that even at room temperature, when higher energy levels are accessible, the molecular vibrations presented in the table above are still happening (even if we cannot witness them using IR spectroscopy, as they are IR-inactive!).
Mini-Project
In this mini-project, we shall study the following reaction:

Our aim is to provide chemists carrying out this reaction with a way of differentiating between the the three products obtained at the various steps of the synthesis. To do so, we are looking to generate optimised structures of those three molecules, and to study some of their geometric features as well as their vibrational characteristics.
DFT calculations were carried out on all three molecules. The B3LYP method was coupled to the 6-311 G9(d,p) basis set for the phosphorus, nitrogen and hydrogen atoms and the LANL2DZ pseudo-potential for the chlorine atoms. The geometry of all three molecules were initially optimised with this method, and when convergence was confirmed, a frequency analysis was carried out to verify that the optimised geometry was a ground-state structure.
Optimisation, frequency analysis and molecular orbital analysis of molecule 1
First of all, molecule 1 was drawn out in Gaussview, and its geometry was optimised using the method outlined above. Shown below is the structure of the molecule which was initially submitted for geometry optimisation and, at a later stage, vibrational analysis.
 |
The summary window shows that the RMS gradient is an order of magnitude smaller than the threshold value (exact value of 0.00020370), suggesting that convergence has occurred. This is confirmed by looking directly into the .log file returned by Gaussian, which can be accessed by clicking on this link.
Consequently, the optimised geometry was submitted to a vibrational analysis. The summary window confirmed that it had been carried out on the right molecule, since the energy of the structure after vibrational analysis is nearly identical to that of the structure returned by Gaussian after the optimisation step (-441.60191021 a.u. versus -441.60191020 a.u., respectively). The .log file returned by Gaussian can be viewed by clicking on the following link.
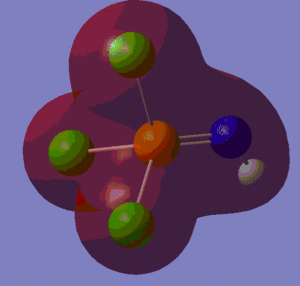
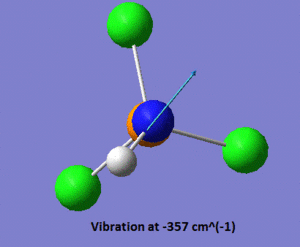
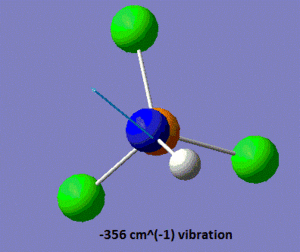
In the .log file, we observe that there are two vibrations with very negative frequencies listed under the heading "low frequency", one of them having a frequency of -356 cm-1, and the other one a frequency of -357 cm-1. Those values are far too negative to be the sole result of numerical difficulties, which indicates that the optimised geometry shown above is a transition state rather than a ground state structure. Shown below is a pictorial representation of the movement of the atoms in these vibrations of negative frequencies.
 |
 |
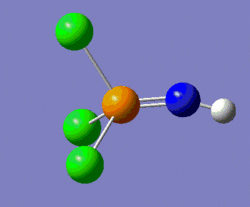
The nature of these vibrations can give us insight into the actual ground-state structure of the molecule; in this case it was postulated that distorting the structure of this molecule from linear, by modifying the P-N-H bond angle to 160° (instead of the 180° of the previous structure), could potentially lead us to the ground-state structure. Hence, a geometry optimisation was carried out on the molecule shown on the left below, and the molecule shown on the right of it was the structure returned by Gaussian. One should notice that the optimum angle as computed by Gaussian is actually a lot smaller than that, with a value of 123°.
 |
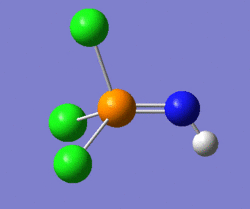 |
It was found by looking at the .log file that convergence had actually occurred, as can be seen by clicking on this link. Hence, this structure was submitted to a vibrational analysis, and the .log file returned by Gaussian shows that out of the six "low frequencies", five are negative. However, these low frequencies are actually fairly small in absolute value (the largest in absolute value is of -8.3 cm-1), and so we can assume that this is due to numerical difficulties, which confirms that we have the ground-state structure of this molecule.
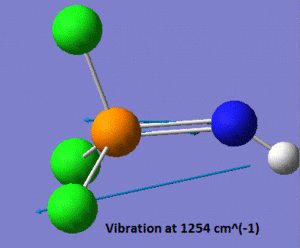
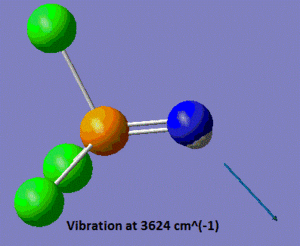
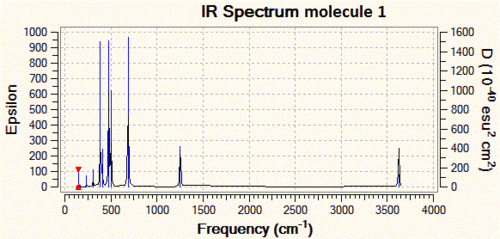
As mentioned in the introduction, we shall focus on the properties of the P=N vibrations in the three molecules we are planning to study. In this case, the vibrational analysis shows us that the frequency of the P=N stretch is of 1254 cm-1. We shall see at a later stage how this compares to the P-N stretches in the two other molecules. Another noticeable vibration in this molecule is the N-H stretch, which has a frequency of 3624 cm-1, which is within the range of stretching frequencies of an N-H bond, suggesting that our model "makes sense". A snapshot of those two vibrations is shown below.
 |
 |
Finally, it is worth mentioning that the P=N bond length is, according to our model, of 1.52 Å. This compares rather well to the value of 1.535 Å reported in literature[4], which points towards the idea that our optimised geometry is a reasonable one (it should however be mentioned that this literature bond length was obtained at the MP2/6-31G level of theory).
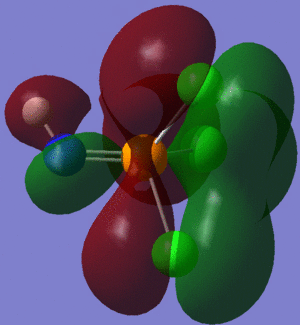
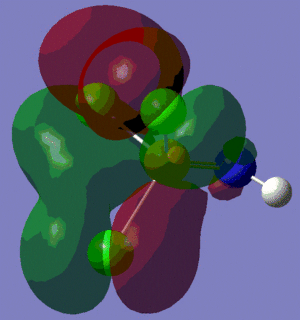
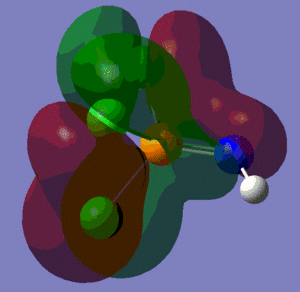
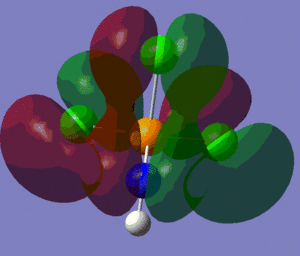
An NBO analysis was also carried out on the optimised structure of the molecule, and the table below shows the structure and energy of the lowest energy MOs up to the LUMO level, ignoring the core orbitals. The whole .chk file can be accessed by clicking on the following link DOI:10042/to-7791 . Since our method is accurate to approximately 10 kJ/mol (i.e. approximately 0.004 a.u.), we shall report the energy of the MOs shown below to the third decimal place.
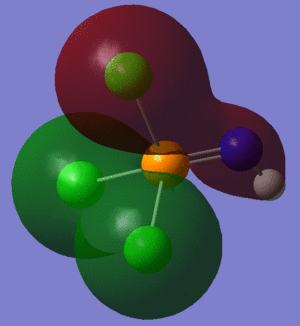
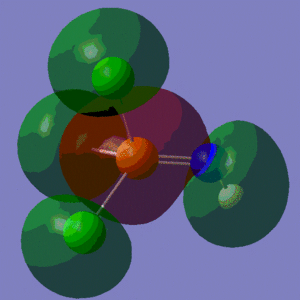
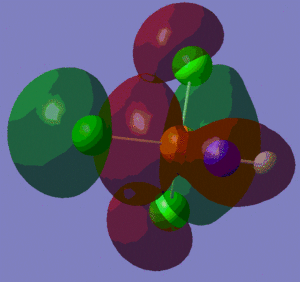
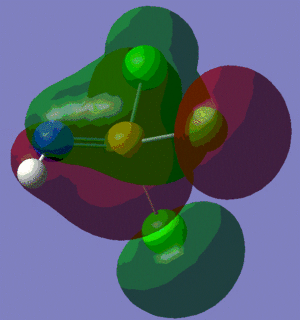
Hence, we can see how important it was for us to account for the d-orbitals of phosphorus when carrying out the optimisation step, since these orbitals are involved in bonding in a great number of molecular orbitals (see MOs 15 to 19 in the table above).
The most striking feature of this MO analysis is probably the fact that LUMO, LUMO+1 and LUMO+2 all have negative energies, and are thus bonding MOs. This means that this molecule can accept electron density from molecules whose HOMO is antibonding. We notice however that the energy gap between the HOMO and the LUMO is of approximately -0.189 a.u., which is much larger than the gap between all the orbitals below the HOMO. For example, the energy gap between the HOMO and the HOMO-1 is of 0.018 a.u. approximately, which is an order of magnitude smaller than the HOMO-LUMO gap.
Optimisation and frequency analysis of molecule 2
Molecule 2 was initially optimised using the general method and the .log file returned by Gaussian showed that the convergence had occurred. Shown below is the structure of the molecule which was submitted to Gaussian for optimisation, next to the structure of the molecule which was returned by the program.
 |
 |
The next step was then to submit the optimised geometry to vibrational analysis. After confirmation that the energy of the optimised molecule and the energy of the structure returned after vibrational analysis was the same (-826.9787796 a.u.), the .log file returned by Gaussian was inspected. One can observe that four out of the six "low frequencies" are negative; however these negative frequencies are small in absolute value (the most negative of these frequencies has a value of -6.5 cm-1) and so we can assume that those negative frequencies are due to numerical difficulties. Hence, we can consider the structure shown above to be the ground-state structure and not a transition state.
Let us now have a look some of the properties of this structure. First of all, both of the P=N bonds have a length of 1.55 Å, which compares rather well with the value of 1.52 and 1.56 Å obtained by crystallographic measurements[5] (note that literature reports that the two P=N bonds have a different length). However, the P-N-P bond angle is of 180°, which isn't anywhere near the 137° reported in literature[5].
As a consequence, it was attempted to re-optimise the structure by setting the P-N-P bond angle to 137°, and the .log file that was returned showed that convergence with those initial parameters had not occurred (the file can be accessed here: DOI:10042/to-7834 ). Because I lacked the time to look for other ways of optimising this molecule, I had to resign myself to use the first optimised structure in further analysis, even though we know the P-N-P bond angle does not reflect the real angle.
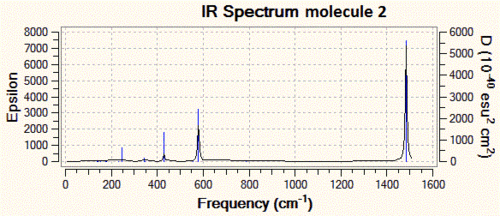
We shall now have a look at the vibrational analysis of the first optimised structure in more detail. We observe that the symmetric P-N bond stretch (shown below, on the left) has a frequency of 786 cm-1 and is IR-inactive (intensity of 0) since it is perfectly symmetric. On the other hand, the asymmetric P-N bond stretch (below, on the right) has a frequency of 1484 cm-1 and an intensity of 2090 a.u., making it a very clear peak in the IR spectrum which would allow us to check whether the reaction shown in the introduction had indeed proceeded.
 |
 |
As mentioned above, the data obtained from vibrational analysis will be used for comparison at the end, when data for all three molecules has been gathered.
Optimisation and frequency analysis of molecule 3
Molecule 3 was initially optimised using the general method but the .log file returned by Gaussian (which can be accessed by clicking on the following link DOI:10042/to-7841 ) tells us that maximum displacement convergence has not occurred, as shown in the snapshot below.

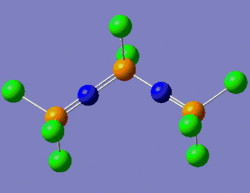
One way to rationalise this is to invoke a shallow potential energy surface, which means that the first derivative of the energy with respect to position is small, i.e. the energy of the system varies very slowly with change in position. Consequently, a greater number of iterations is required for this derivative to reach a value inferior to the threshold value set by the program. This is why at the end of the optimisation process, the .log file says that the convergence has not occurred. Gaussian nonetheless considers this optimisation as complete on the basis of "negligible forces". That is, since our potential energy surface is very shallow, the forces under consideration vary by a sufficiently small amount to assume that it isn't necessary to increase the number of iterations in order to get a "maximum displacement" derivative whose value is lower than the threshold value. Indeed, we can see that the Maximum force and RMS force values are two order of magnitudes smaller than the threshold value. And even if the maximum displacement value isn't below the threshold value, it is still very close to it (0.00325 versus 0.0018, respectively). We shall thus consider this structure as a fully optimised one. The structure which was submitted to Gaussian for optimisation is shown on the left below, while the optimised structure returned by Gaussian is shown on the right below.
 |
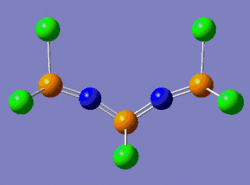 |
Notice that the structure submitted for optimisation has three P=N bonds and one P-N bond, while the structure returned by Gaussian has four P=N double bonds. This is due to the fact that, as we have seen, Gaussian only bases itself on the distance between two atoms to justify the multiplicity of the bond (we shall discuss the structural properties of this molecule once the frequency analysis confirms that we have indeed a ground-state structure).
The .log file returned by Gaussian after frequency analysis shows that the latter has indeed been carried out on the right structure, since the energy of the molecule returned after vibrational analysis is the same as that of the optimised structure (-1253.07423290 a.u.).
We notice from the .log file that four of the six "low frequencies" are actually negative, but since these frequencies are all small in absolute value (the most negative one is of -4.7 cm-1), we can assume that this due to numerical difficulties and hence that we actually have a ground-state structure.
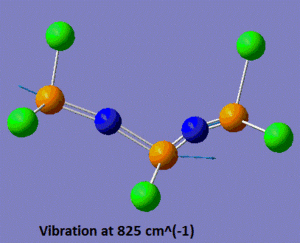
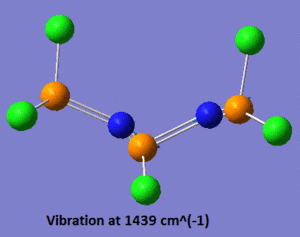
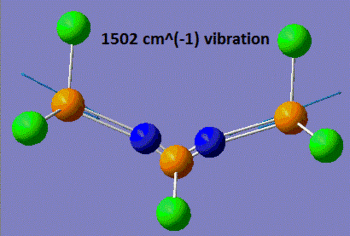
Now that the ground-state structure is confirmed, let us have a look at the geometrical properties of this molecule. We find that the two "inner" P-N bonds both have a length of 1.57 Å, while the "outer" P-N bonds have a length of 1.53 Å. Moreover, we observe that there are two different P-N-P angles, the "inner" P-N-P angle being of 113°, while the "outer" angle is of 165°. Finally, there are three different P-N stretching vibrations in this molecule. The lowest energy P-N stretch (shown on the left, below) has a frequency of 825 cm-1, and is a vibration in which the two nitrogen atoms are essentially immobile, and where the outer phosphorus atoms are moving backwards and forwards, in the plane of the backbone of the molecule. This vibration is essentially IR-inactive, since it has an intensity of 3 a.u. (this means that this peak could probably not be resolved experimentally). On the other hand, the vibration at 1439 cm-1 is an asymmetric stretch (shown in the middle, below), where this time the nitrogen atoms are doing most of the movement and the phosphorus atoms are displaced by a much smaller amount during the course of the vibration. Due to its asymmetric nature, this vibration has a predicted intensity of 3615 a.u., and would thus be very characteristic on the IR spectrum of this compound. Finally, the vibration at 1502 cm-1 is a symmetric stretch (shown on the right, below), and consequently has a much lower intensity than the asymmetric stretch (the next section will discuss in more detail how these vibrations compare to each other).
 |
 |
 |
Comparison of the data obtained for all three molecules
The main predicted features of the three molecules are summarised in the table below.
| Molecule | Single P-N bond length/ Å | Double P=N bond length/ Å | P-N-P angle/ ° | Frequency of P-N bond stretch/ (cm-1) |
|---|---|---|---|---|
| 1 | N/A | 1.52 | N/A | 1254 |
| 2 | N/A | 1.55 | 180 | 786 (IR-inactive) & 1484 |
| 3 | 1.57 | 1.53 | 165 & 113 | 825 (IR-inactive), 1439 & 1502 |
It should be mentioned that the columns entitled "single P-N bond length" and "double P-N bond length" refer to whether Gaussview had assigned a single or a double bond on the optimised structure. We can clearly see that the "double bond" in molecule 2 is actually nearly as long as the "single" bond in molecule 3, and hence one could suggest that molecule 2 has two P-N bonds with a bond order which is somewhere between 1 and 2. However, literature[6] considers acyclic phosphorus nitrogen bonds of 1.58 Å to be "short" and to have "considerable double bond character" (in compounds related to the triphenyl phosphazenyl group, NPPh3). Thus, we could actually postulate that the shortness of the P-N bond in molecule 1 is due to a bond order which is between 2 and 3, while the bond order of all the P-N bonds in molecules 2 and 3 is of at least 2.
Next, let us compare the three IR spectra that we have predicted, as they constitute the data that a synthetic chemist would gather after characterisation of these compounds, were he to carry out these reactions.
 |
 |
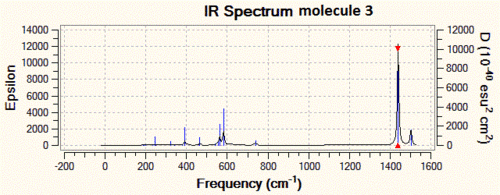 |
As one can see from the IR spectra, it would actually be a fairly easy task to distinguish between molecules 1 and 2 since the P-N bond stretching frequencies are different by more than 200 cm-1 and the N-H stretch at 3600 cm-1 of molecule 1 has no equivalent in molecule 2. However, differentiating between molecules 2 and 3 would prove to be a trickier task if we only based ourselves on the IR spectra, since the difference between the P-N stretching frequencies is of only 40 cm-1. This is however not an impossible task, since modern IR spectrometers are accurate to more than 1 cm-1, but we need to take into account the fact that there is an error associated with our IR predictions, and that it might actually be that molecule 2 and 3 have P-N stretching frequencies which are a lot closer to each other, and that this cannot be resolved at the level of theory we are using.
References
- ↑ 1.0 1.1 J. Glaser, G. Johansson, Act. Chem. Scandinavica, 1982, 36a, pp. 125-135 Cite error: Invalid
<ref>tag; name "Darensbourg" defined multiple times with different content - ↑ 2.0 2.1 A. G. Orpen, L. Brammer, F. H. Allen, O. Kennard, D.G. Watson, R. Taylor J. Chem. Soc. Dalton Trans., 1989, 45, pp. S1-S83
- ↑ 3.0 3.1 F. A. Cotton Inorg. Chem., 1964, 3, pp. 702-711
- ↑ Y. Xue, D. Xie, G. Yan J. Phys. Chem., 2002, 106, pp. 9053-9058
- ↑ 5.0 5.1 D. Bougeard, C. Bremard, R. De Jaeger, Y. Lemmouch Spectrochemica Acta, 1993, 49A, pp. 199-208
- ↑ R. A. Shaw, Pure Appl. Chem., 1975, 44, pp. 317-341

