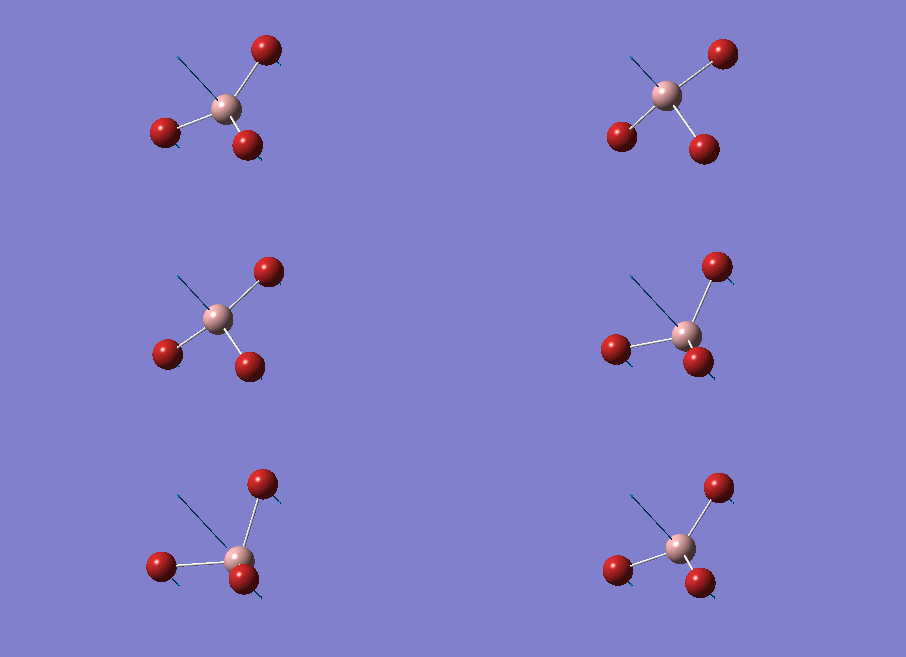
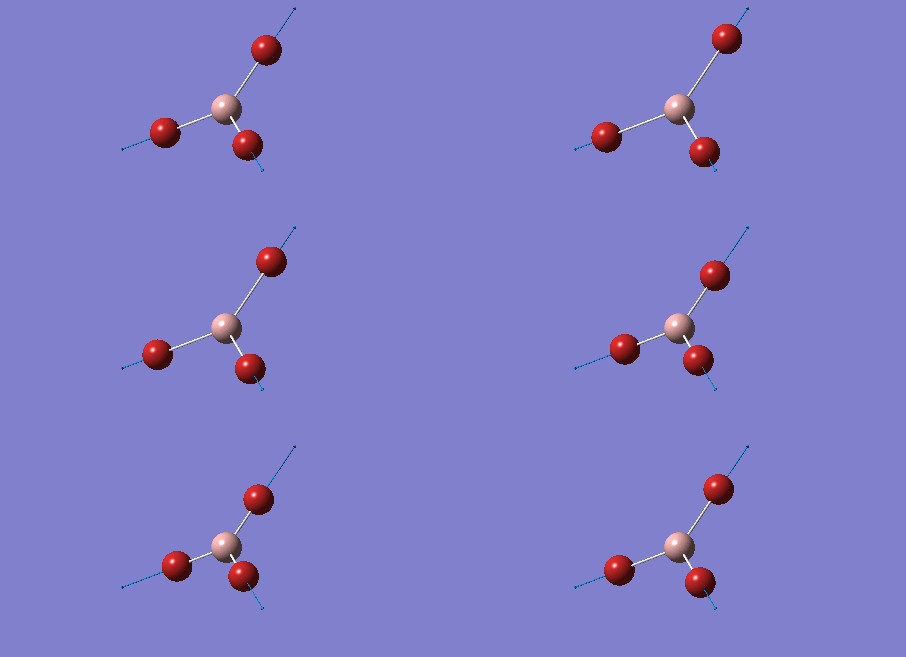
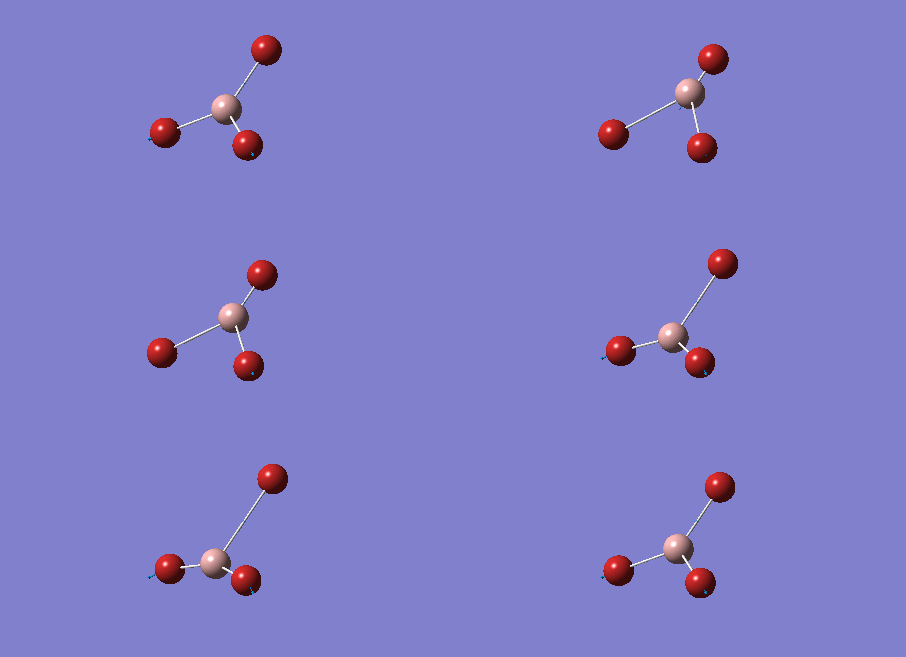
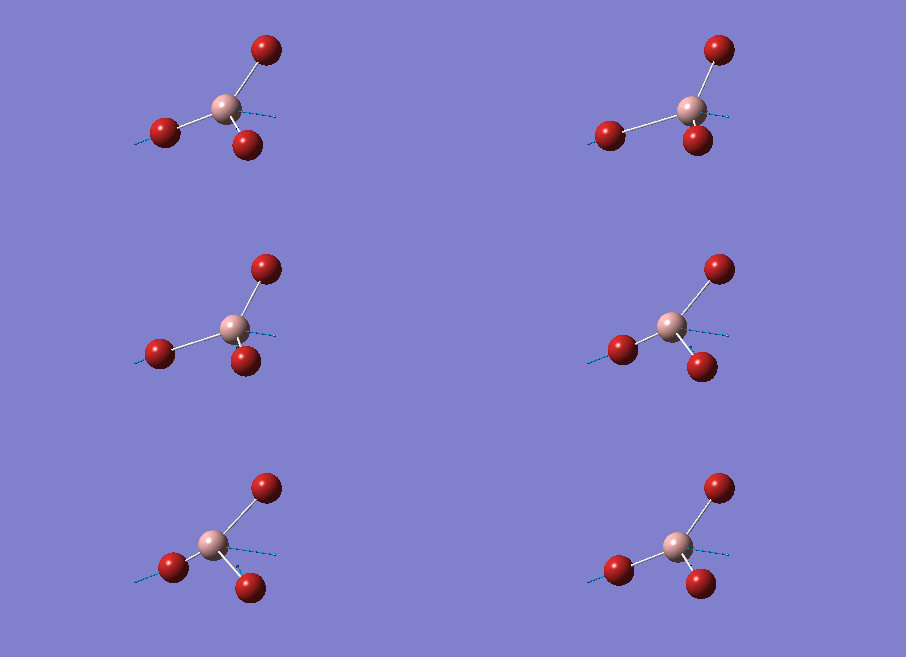
Rep:Mod:bh3bbr3gabr3nh3 ttyr2013
3rd Year Computational Chemistry Laboratory 2013 (Part One)
Name: YONG REN TAN (CID:00703262)
BH3 optimisation
BH3 OPTIMIZATION using 3-21G basis set
Computational analysis of BH3 was investigated using Gaussian 09. It was optimized using the DFT B3LYP/3-21G calculations. The log data of the calculation would be found from the link below:
The data below shows the details and the results of the calculation. The energy obtained was -26.46226338 a.u. The optimisation was complete as the RMS Gradient Norm is less than 0.001 a.u.
| File Type | .log |
| Calculation Type | FOPT |
| Calculation Method | RB3LYP |
| Basis Set | 3-21G |
| Charge | 0 |
| Spin | Singlet |
| E(RB3LYP) | -26.46226338 a.u. |
| RMS Gradient Norm | 0.00020672 a.u. |
| Imaginary Freq | nil |
| Dipole Moment | 0.00 Debye |
| Point Group | D3h |
| Job cpu time | 26.0 seconds |
Also, the job had already converged. It was proven from the data below showing that the full convergence after the job.
 Item               Value     Threshold  Converged?
 Maximum Force            0.000413     0.000450     YES
 RMS     Force            0.000271     0.000300     YES
 Maximum Displacement     0.001610     0.001800     YES
 RMS     Displacement     0.001054     0.001200     YES
 Predicted change in Energy=-1.071764D-06
 Optimization completed.
    -- Stationary point found.
From the calculation, it was found that BH3 has the following data for bond length and bond angle.
Bond length (H-B) : 1.19 Å
Bond angle (H-B-H) : 120.0 deg
The bond length is similar to the literature value [1], as given in CRC HANDBOOK OF CHEMISTRY AND PHYSICS 93RD EDITION 2012-2013, which was 1.1900 Å (determine via IR experimentally).This showed that the computational results matched well with the experimental values.
BH3 OPTIMIZATION using 6-31G(d,p) basis set
Another computational analysis of BH3 was investigated using Gaussian 09. It was optimized using the DFT B3LYP/6-31G(d,p) calculations. The log data of the calculation would be found from the link below:
The data below shows the details and the results of the calculation. The energy obtained was -26.61532252 a.u. The optimisation was complete as the RMS Gradient Norm is less than 0.001 a.u.
| File Type | .log |
| Calculation Type | FOPT |
| Calculation Method | RB3LYP |
| Basis Set | 6-31G(d,p) |
| Charge | 0 |
| Spin | Singlet |
| E(RB3LYP) | -26.61532252 a.u. |
| RMS Gradient Norm | 0.00021672 a.u. |
| Imaginary Freq | nil |
| Dipole Moment | 0.00 Debye |
| Point Group | D3h |
| Job cpu time | 30.0 seconds |
Furthermore, the job had already converged. It was proven from the data below showing that the full convergence after the job.
 Item               Value     Threshold  Converged?
 Maximum Force            0.000433     0.000450     YES
 RMS     Force            0.000284     0.000300     YES
 Maximum Displacement     0.001702     0.001800     YES
 RMS     Displacement     0.001114     0.001200     YES
 Predicted change in Energy=-1.189019D-06
 Optimization completed.
    -- Stationary point found.
From the calculation, it was found that BH3 has the following data for bond length and bond angle.
Bond length (B-H): 1.19 Å
Bond angle (H-B-H): 120.0 deg.
The bond length is similar to the literature value [1], as given in CRC HANDBOOK OF CHEMISTRY AND PHYSICS 93RD EDITION 2012-2013, which was 1.1900 Å (determine via IR experimentally).This showed that the computational results matched well with the experimental values.
Summary
| Basis set | 3-21G | 6-31G(d,p) |
|---|---|---|
| Energy (a.u.) | -26.46226338 | -26.61532252 |
The energy difference is 0.15305914 a.u., which is about 402 kJ mol-1
GaBr3 and BBr3 optimisation
GaBr3
Computational analysis of GaBr3 was investigated using Gaussian 09. It was optimized using the DFT B3LYP/LanL2DZ calculations. It is of a medium level basis set. Other than that, to ensure that the calculation is more accurate, the geometry was restricted to D3h, with the tolerance set to be very tight (0.0001).The log data of the calculation would be found from the link below:
The data below shows the details and the results of the calculation. The energy obtained was -41.70082783 a.u. The optimisation was complete as the RMS Gradient Norm is close to 0 a.u.
| File Type | .log |
| Calculation Type | FOPT |
| Calculation Method | RB3LYP |
| Basis Set | LANL2DZ |
| Charge | 0 |
| Spin | Singlet |
| E(RB3LYP) | -41.70082783 a.u. |
| RMS Gradient Norm | 0.00000016 a.u. |
| Imaginary Freq | nil |
| Dipole Moment | 0.00 Debye |
| Point Group | D3h |
| Job cpu time | 27.8 seconds |
Also, the job had already converged. It was proven from the data below showing that the full convergence after the job.
 Item               Value     Threshold  Converged?
 Maximum Force            0.000000     0.000450     YES
 RMS     Force            0.000000     0.000300     YES
 Maximum Displacement     0.000003     0.001800     YES
 RMS     Displacement     0.000002     0.001200     YES
 Predicted change in Energy=-1.282676D-12
 Optimization completed.
    -- Stationary point found.
From the calculation, it was found that GaBr3 has the following data for bond length and bond angle.
Bond length (Br-Ga) : 2.39 Å
Bond angle (Br-Ga-Br) : 120.0 deg
The bond length is comparable to the literature value [2], as given in CRC HANDBOOK OF CHEMISTRY AND PHYSICS 93RD EDITION 2012-2013, which was 2.249 Å (determine via Gas phase electron diffraction experimentally). This showed that the computational results matched well with the experimental values.
BBr3
Computational analysis of BBr3 was investigated using Gaussian 09. It was optimized using the DFT B3LYP/GEN calculations. The basis sets for each atom was individually specified. In the input file, it was specified that it was the basis set for all atoms and pseudo-potential for Br atom being employed for the job.
The log data of the calculation would be found from the link below:
The data below shows the details and the results of the calculation. The energy obtained was -64.43645296 a.u. The optimisation was complete as the RMS Gradient Norm is less than 0.001 a.u.
| File Type | .log |
| Calculation Type | FOPT |
| Calculation Method | RB3LYP |
| Basis Set | GEN |
| Charge | 0 |
| Spin | Singlet |
| E(RB3LYP) | -64.43645296 a.u. |
| RMS Gradient Norm | 0.00000382 a.u. |
| Imaginary Freq | nil |
| Dipole Moment | 0.0000 Debye |
| Point Group | D3h |
| Job cpu time | 37.1 seconds |
Also, the job had already converged. It was proven from the data below showing that the full convergence after the job.
 Item               Value     Threshold  Converged?
 Maximum Force            0.000008     0.000450     YES
 RMS     Force            0.000005     0.000300     YES
 Maximum Displacement     0.000036     0.001800     YES
 RMS     Displacement     0.000023     0.001200     YES
 Predicted change in Energy=-4.027676D-10
 Optimization completed.
    -- Stationary point found.
From the calculation, it was found that BBr3 has the following data for bond length and bond angle.
Bond length (Br-B) : 2.02 Å
Bond angle (Br-B-Br) : 120.0 deg
The bond length is quite close to the literature value [3], as given in CRC HANDBOOK OF CHEMISTRY AND PHYSICS 93RD EDITION 2012-2013, which was 1.893 Å (determine via Gas phase electron diffraction experimentally). This showed that the computational results matched not very well with the experimental values and better basis sets should be employed for the calculation.
Comparing and contrasting the bond distances of BH3, BBr3, and GaBr3.
Table of bond distances for BH3, BBr3, and GaBr3
| Compound | Bond length ( Å ) | DIfference in electronegativity (Pauling units) | Type of bond |
| BH3 | 1.19 | 0.16 | non-polar covalent |
| BBr3 | 2.02 | 0.92 | polar covalent |
| GaBr3 | 2.39 | 1.15 | polar covalent |
From the table of bond distances, BH3 has the shortest bond distance (B-H) while GaBr3 has the longest bond distance (Ga-Br), with B-Br bond bearing the moderate length. It is a reasonable result, as going down Group 13, the atoms in the same group tend to become larger in size. Thus making Ga-Br bond length longer than B-Br bond length by 0.37 Å, which was accounted by the increase in atomic radius from B to Ga. Thus changing the central element of the same group would change the bond length as the heavier (or larger) element down the group would result in increase in bond length.
B and Ga were similar in the sense where they both were in the Group 13 and will have three valance electrons available for bonding. From the analysis using the difference in Pauling's electronegativity, all the bonds formed by Ga or B with ligands were expected of having covalent in nature. Ga and B would share three electrons with the ligands to relieve their electron deficiency. However, they were still short of two electrons after forming three bonds with the ligands and would be expected form dimers to relieve the electron deficiency. Also, they would be good Lewis acid too and chemically would have almost similar properties. B and Ga, as explained earlier have different atomic radius and naturally would result in increase in bond length for Ga-Br than B-Br. Therefore, in physical properties, as such bond length, there would be a obvious difference between B and Ga.
Changing the ligand changes the nature of the chemical bond and definitely the bond length between the central element and ligand. Changing from H to Br increases the bond length by 0.82651 Å and changes the nature of bond from non-polar covalent to polar covalent. This is because H and Br have different atomic radius and this would result in the B-Br bond be longer than B-H as Br is much more larger than H. Also, Br is much electronegative than H, and has much more difference in electronegativity with B, thus would result in formation of polar covalent bond rather than non-polar covalent bond in B-H. The similarities of the H and Br ligands were both of them share one valence electron with the central element to form the bonds and they complete their octet configuration by getting a share of one electron from the central element.
What is bond?
After each job was completed, Gaussview does not draw in the bonds as expected. This was because of the way bond was defined in Gaussview. When two atoms were apart from certain distance, then it would not be drawn as a bond in Gaussview. Consequently, when Gaussview does not draw the bonds, it does not mean that there is no bond. It was just implying that under the benchmark of Gaussview defined bond length, it was not considered as a bond. However, as ballparks set by Gaussview was not flexible in considering bonds of different elements, thus we could interpret it as a very weak bond.
A chemical bond could be defined as a force that holds two atoms together, either by electrostatic interaction (ionic bond) or sharing of electrons (covalent bond). As two atoms were hold very close, we would usually depict the close contact with a line that connects two atoms together, which is widely known as a chemical bond. In actual molecules, the atoms within the molecule does not form the 'lines' but were close to each other and have electronic interaction with one and exists as a whole.
Further analysis of BH3
BH3 frequency analysis
As the DFT B3LYP/6-31G(d,p) optimisation of BH3 was not sufficient, another optimisation was performed DFT B3LYP/6-31G(d,p) again but with additional keyword of SCF=conver=9 and int=ultrafine with tight convergence criteria. The link below shows the log data of the calculation:
OPT_BH3_DFT_B3LYP_6-31G(d,p)_new
The data below shows the details and results of the calculation. The energy obtained was -26.61532364 a.u. The optimisation was complete as the RMS gradient is less than 0.001 a.u.
| File Type | .log |
| Calculation Type | FOPT |
| Calculation Method | RB3LYP |
| Basis Set | 6-31G(d,p) |
| Charge | 0 |
| Spin | Singlet |
| E(RB3LYP) | -26.61532364 a.u. |
| RMS Gradient Norm | 0.00000162 a.u. |
| Imaginary Freq | nil |
| Dipole Moment | 0.0000 Debye |
| Point Group | D3h |
| Job cpu time | 27.0 seconds |
Also, the job had already converged. It was proven from the data below showing that the full convergence after the job.
 Item               Value     Threshold  Converged?
 Maximum Force            0.000003     0.000015     YES
 RMS     Force            0.000002     0.000010     YES
 Maximum Displacement     0.000013     0.000060     YES
 RMS     Displacement     0.000008     0.000040     YES
 Predicted change in Energy=-6.153662D-11
 Optimization completed.
    -- Stationary point found.
From the calculation, it was found that BH3 has the following data for bond length and bond angle.
Bond length (B-H): 1.19 Å
Bond angle (H-B-H): 120.0 deg.
After the optimisation, the calculation was proceeded with the frequency calculation of BH3. The log file of the data was found form the link below:
The data below shows the details and the results of the calculation. The energy obtained was -26.61532364 a.u., which is similar to the energy obtained from the optimisation above. The frequency calculation was completed as the RMS Gradient Norm is less than 0.001 a.u.
| File Type | .log |
| Calculation Type | FREQ |
| Calculation Method | RB3LYP |
| Basis Set | 6-31G(d,p) |
| Charge | 0 |
| Spin | Singlet |
| E(RB3LYP) | -26.61532364 a.u. |
| RMS Gradient Norm | 0.00000170 a.u. |
| Imaginary Freq | nil |
| Dipole Moment | 0.00 Debye |
| Point Group | D3h |
| Job cpu time | 23.0 seconds |
Also, the job had already converged. It was proven from the data below showing that the full convergence after the job.
 Item               Value     Threshold  Converged?
 Maximum Force            0.000003     0.000450     YES
 RMS     Force            0.000002     0.000300     YES
 Maximum Displacement     0.000013     0.001800     YES
 RMS     Displacement     0.000007     0.001200     YES
 Predicted change in Energy=-6.803489D-11
 Optimization completed.
    -- Stationary point found.
The two lines of frequencies found from the log file was shown below:
 Low frequencies:   -7   -7   0   0   1  7<br>
Low frequencies: 1163 1213 1213
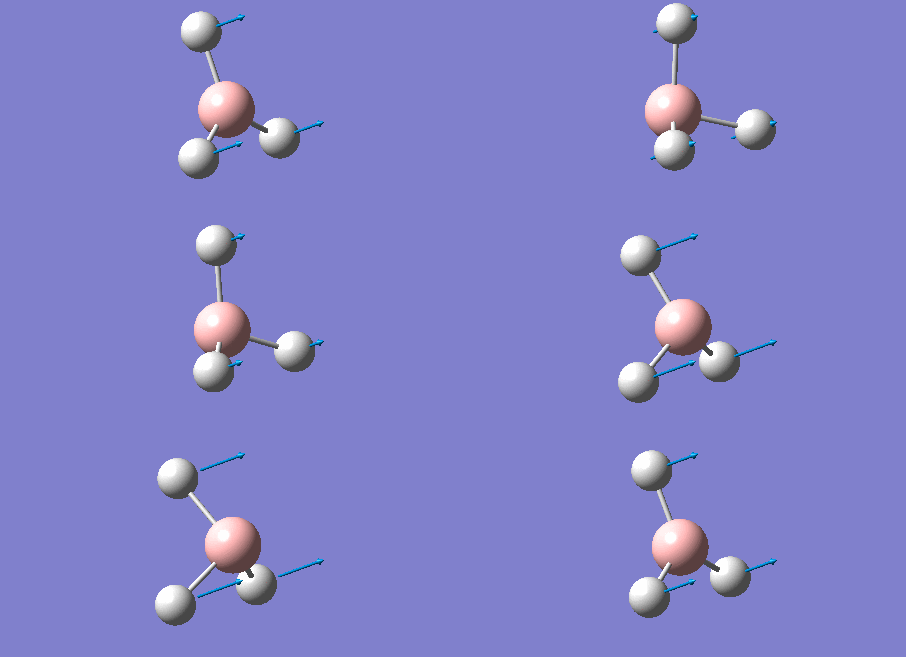
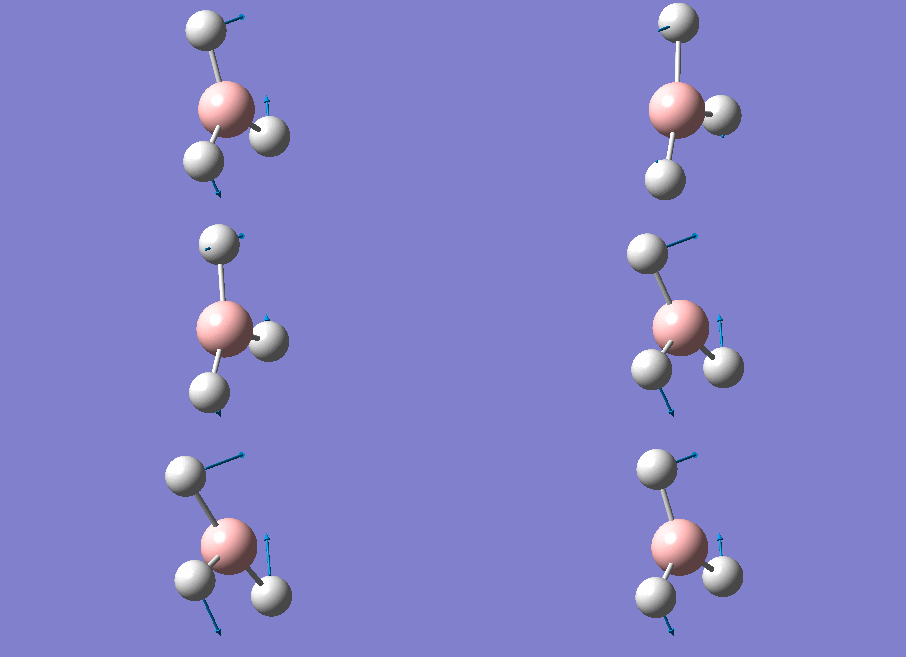
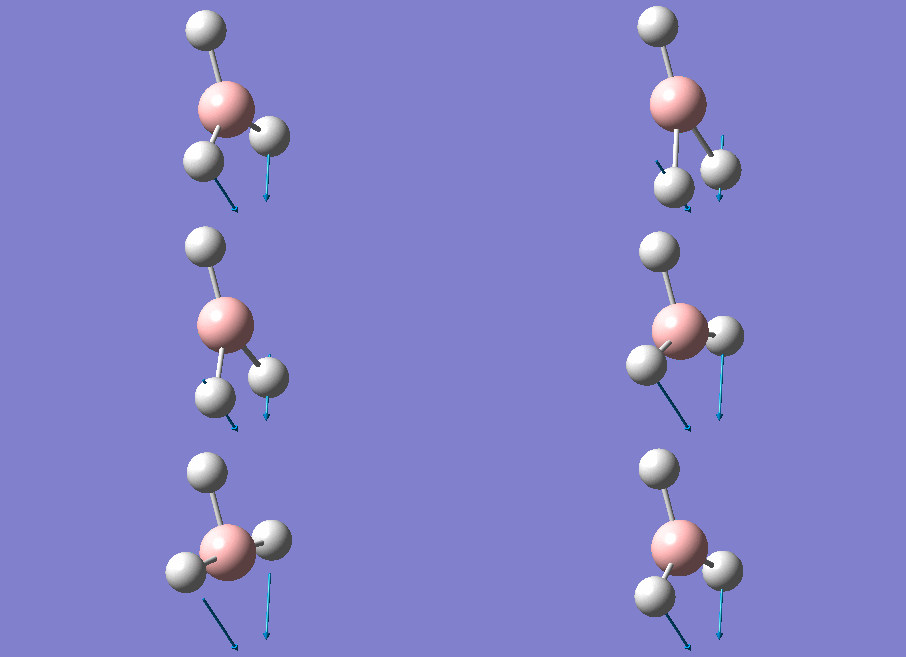
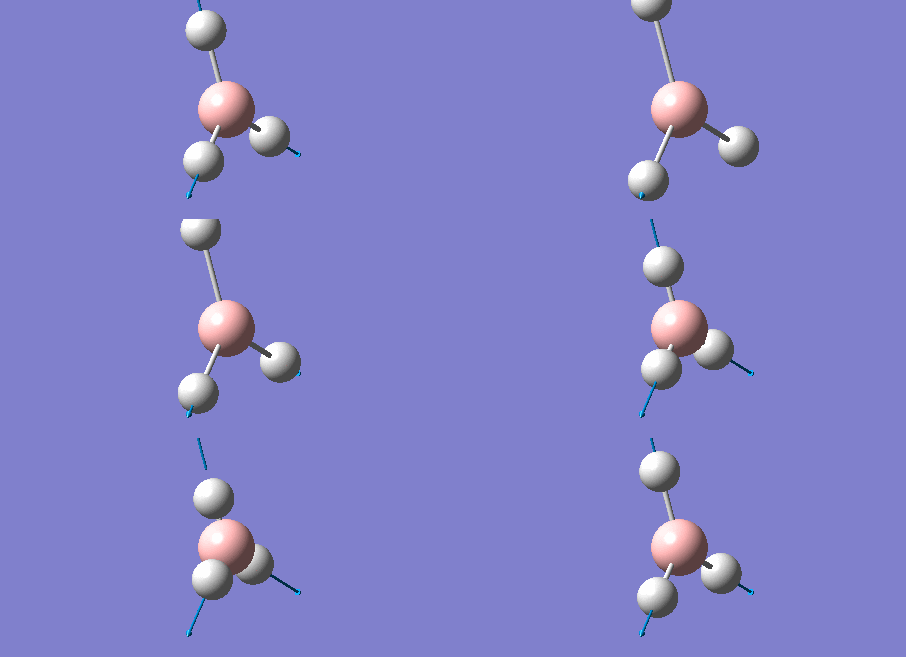
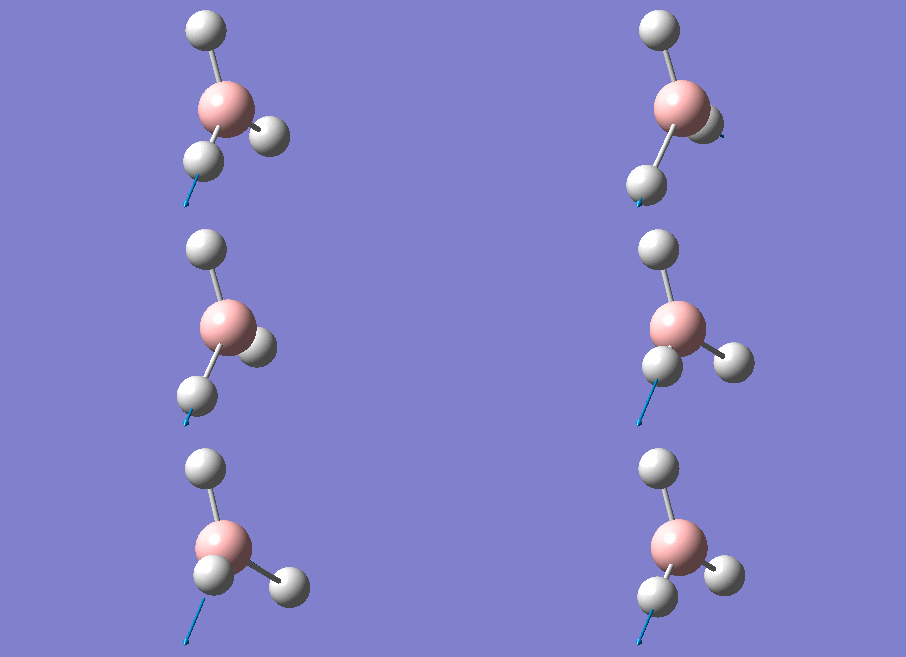
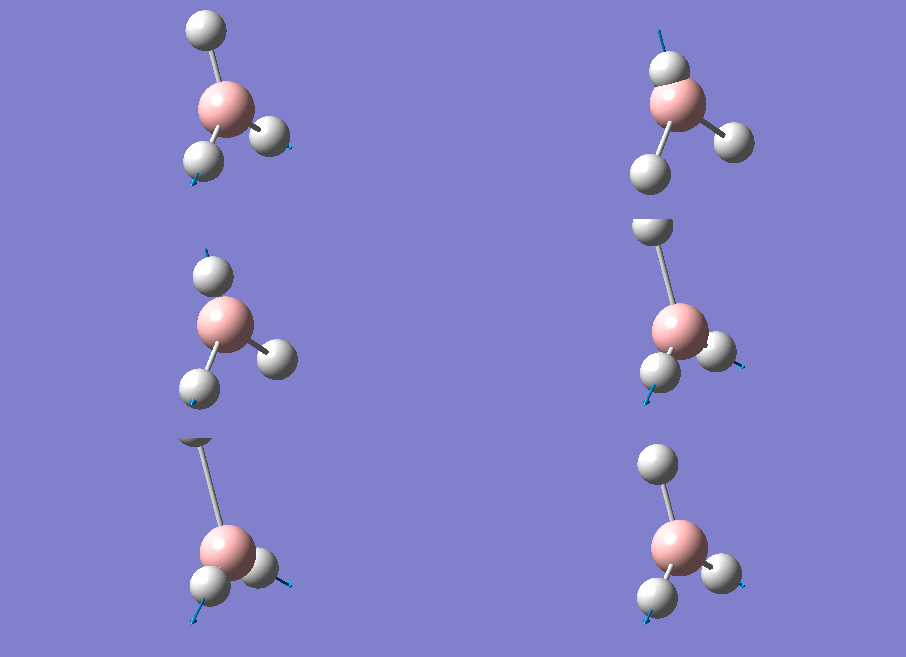
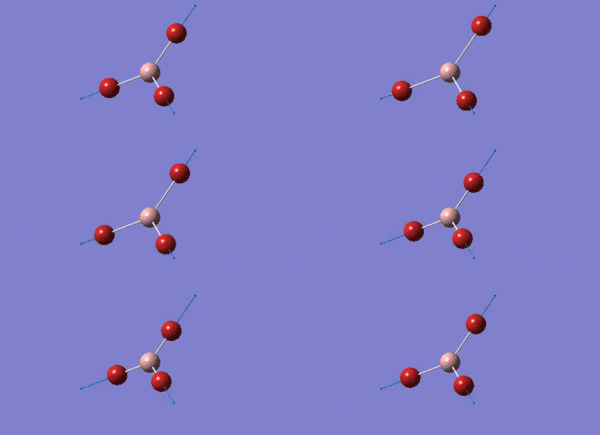
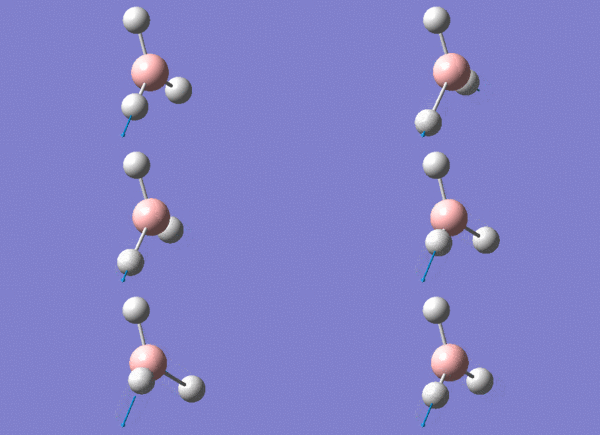
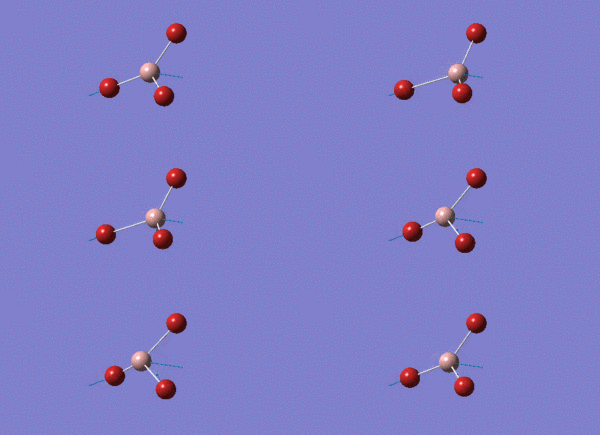
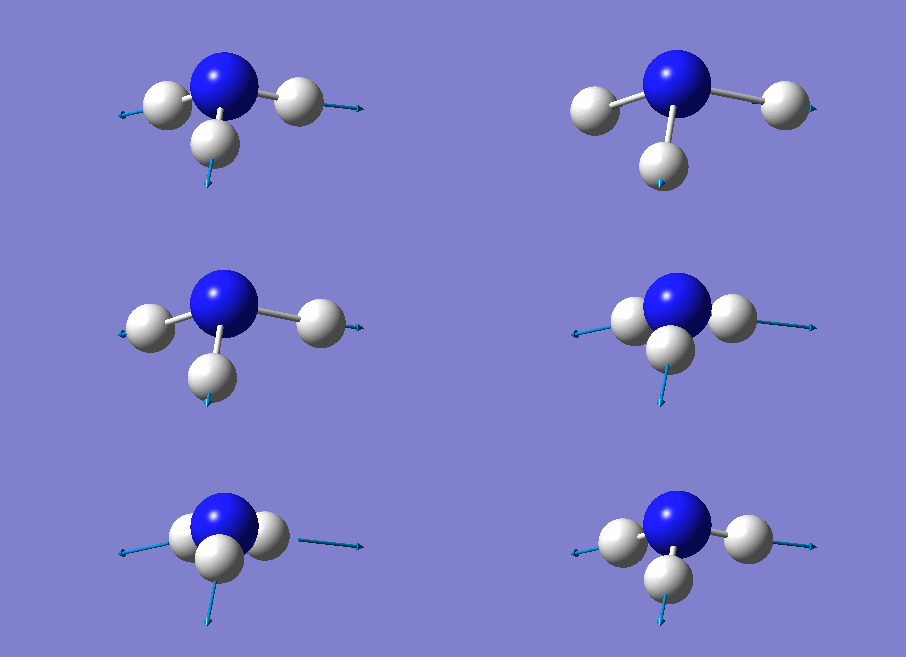
Animation of BH3 vibrations
The computed IR spectrum of BH3 was as shown below:

In theory, every molecule has 3N (N stands for number of atoms) vibrational frequencies. However, due to the motion of the centre of mass of molecule, '-6' term should be added to 3N to take into account of such vibration, resulting in the formula of 3N-6. From the formula, N=4, 3N-6=6. There should be six peaks in the spectrum. Unfortunately, there are less than six peaks in the spectrum. This is because because IR spetrum only records vibrations that results in change in dipole moment. Thus the symmetrical stretch of No.4 (v=2582 cm-1) would not show up in the IR spectrum. This leaves to five peaks to appear in the spectrum. However, as No.(2,3) and No.(5,6) are degenerate, this would leave three peaks to the IR spectrum which was predicted by the computation.
Further analysis of GaBr3
Frequency analysis of GaBr3
As the DFT B3LYP/LANL2DZ optimisation of GaBr3 was not sufficient, another optimisation was performed DFT B3LYP/LANL2DZ again but with additional keyword of SCF=conver=9 and int=ultrafine with tight convergence criteria. The link below shows the log data of the calculation:
OPT_GaBr3_DFT_B3LYP_LANL2DZ_new
The data below shows the details and results of the calculation. The energy obtained was -41.70082770 a.u. The optimisation was complete as the RMS gradient is less than 0.001 a.u.
| File Type | .log |
| Calculation Type | FOPT |
| Calculation Method | RB3LYP |
| Basis Set | LANL2DZ |
| Charge | 0 |
| Spin | Singlet |
| E(RB3LYP) | -41.70082770 a.u. |
| RMS Gradient Norm | 0.00000021 a.u. |
| Imaginary Freq | nil |
| Dipole Moment | 0.00 Debye |
| Point Group | D3h |
| Job cpu time | 13.0 seconds |
Also, the job had already converged. It was proven from the data below showing that the full convergence after the job.
  Item               Value     Threshold  Converged?
 Maximum Force            0.000000     0.000015     YES
 RMS     Force            0.000000     0.000010     YES
 Maximum Displacement     0.000003     0.000060     YES
 RMS     Displacement     0.000002     0.000040     YES
 Predicted change in Energy=-2.078362D-12
 Optimization completed.
    -- Stationary point found.
From the calculation, it was found that GaBr3 has the following data for bond length and bond angle.
Bond length (Ga-Br): 2.35 Å
Bond angle (Br-Ga-Br): 120.0 deg.
The bond length is comparable to the literature value[2], as given in CRC HANDBOOK OF CHEMISTRY AND PHYSICS 93RD EDITION 2012-2013, which was 2.249 Å which was determine via gas phase electron diffraction. The experimental value is quite close to the literature value and more basis sets should be employed to obtain better results.
After the optimisation, the calculation was proceeded with the frequency calculation of GaBr3. The log file of the data was found form the link below:
The data below shows the details and the results of the calculation. The energy obtained was -41.70082770 a.u., which is similar to the energy obtained from the optimisation above. The frequency calculation was completed as the RMS Gradient Norm is less than 0.001 a.u.
| File Type | .log |
| Calculation Type | FREQ |
| Calculation Method | RB3LYP |
| Basis Set | LANL2DZ |
| Charge | 0 |
| Spin | Singlet |
| E(RB3LYP) | -41.70082770 a.u. |
| RMS Gradient Norm | 0.00000021 a.u. |
| Imaginary Freq | nil |
| Dipole Moment | 0.00 Debye |
| Point Group | D3h |
| Job cpu time | 22.0 seconds |
Also, the job had already converged. It was proven from the data below showing that the full convergence after the job.
 Item               Value     Threshold  Converged?
 Maximum Force            0.000000     0.000450     YES
 RMS     Force            0.000000     0.000300     YES
 Maximum Displacement     0.000004     0.001800     YES
 RMS     Displacement     0.000002     0.001200     YES
 Predicted change in Energy=-2.186303D-12
 Optimization completed.
    -- Stationary point found.
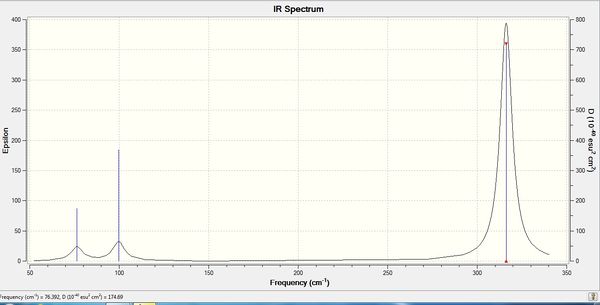
The two lines of frequencies found from the log file was shown below:
 Low frequencies ---   -1   0   0    0    1    1
 Low frequencies ---   76   76   100
The lowest "real" normal mode is the mode with the lowest in frequency (or energy) which is 76 cm-1.
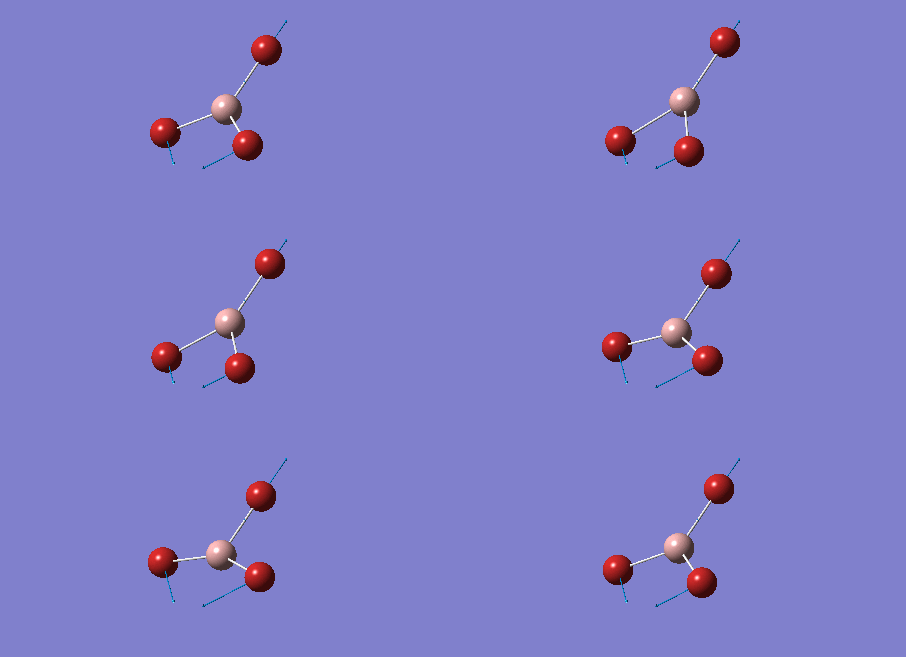
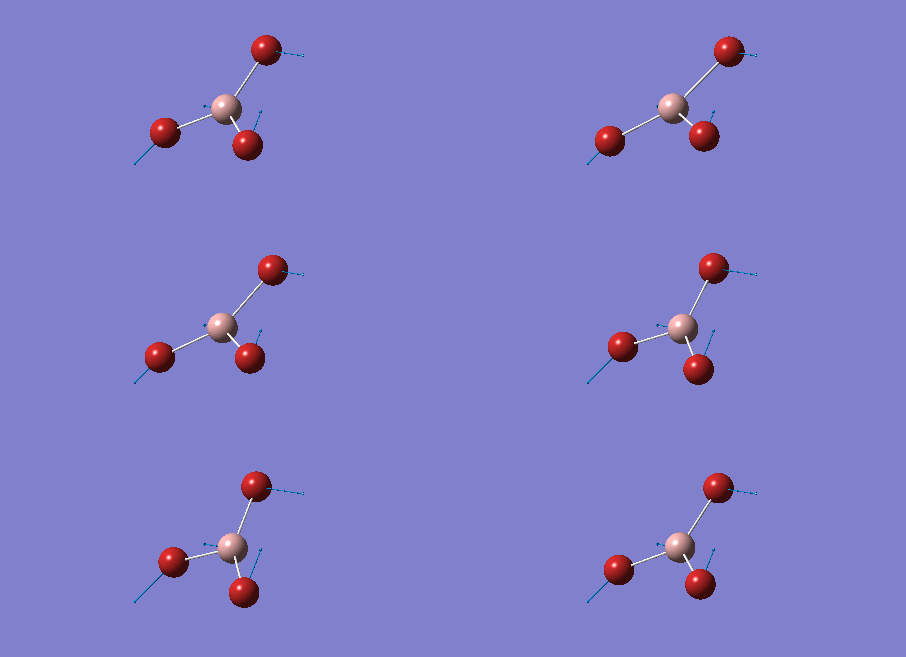
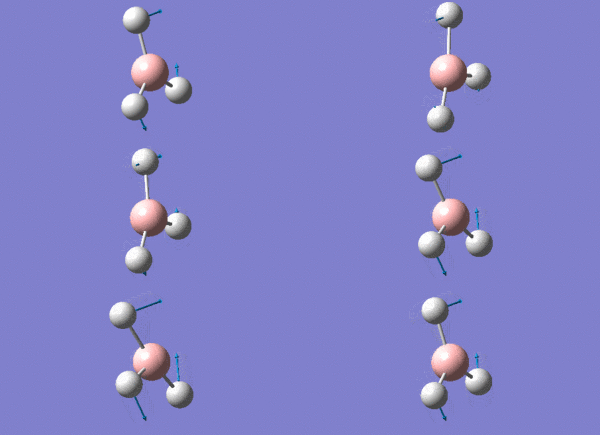
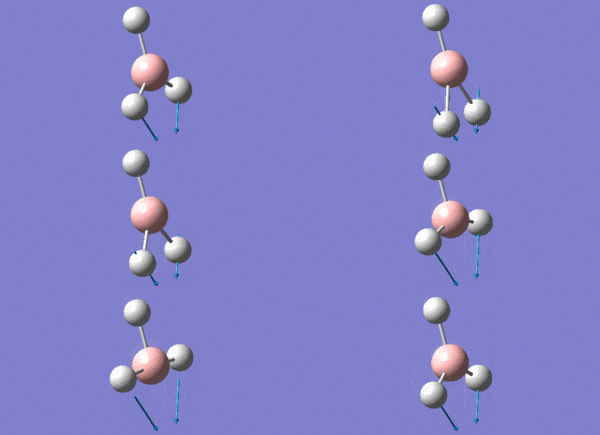
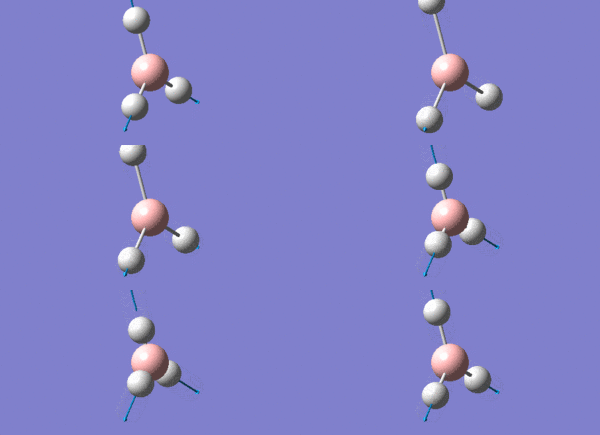
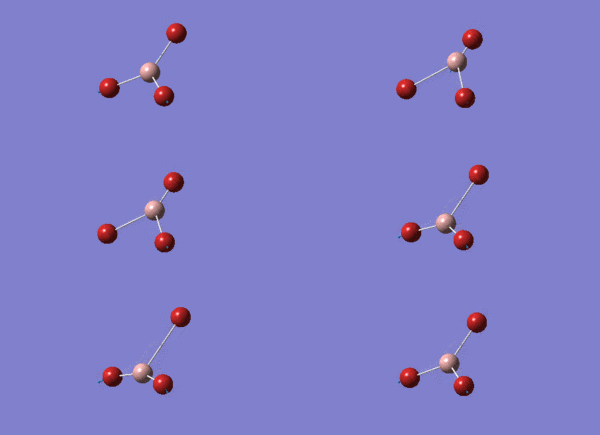
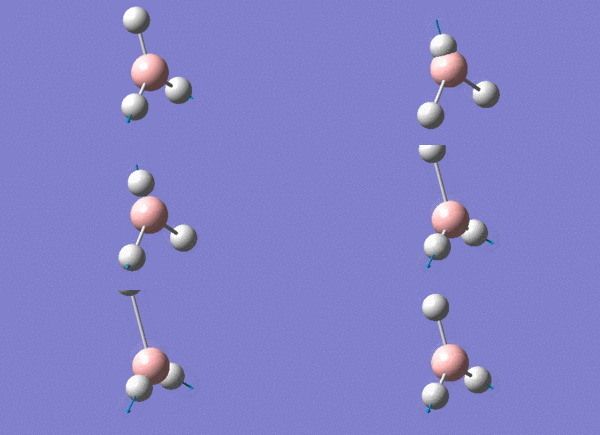
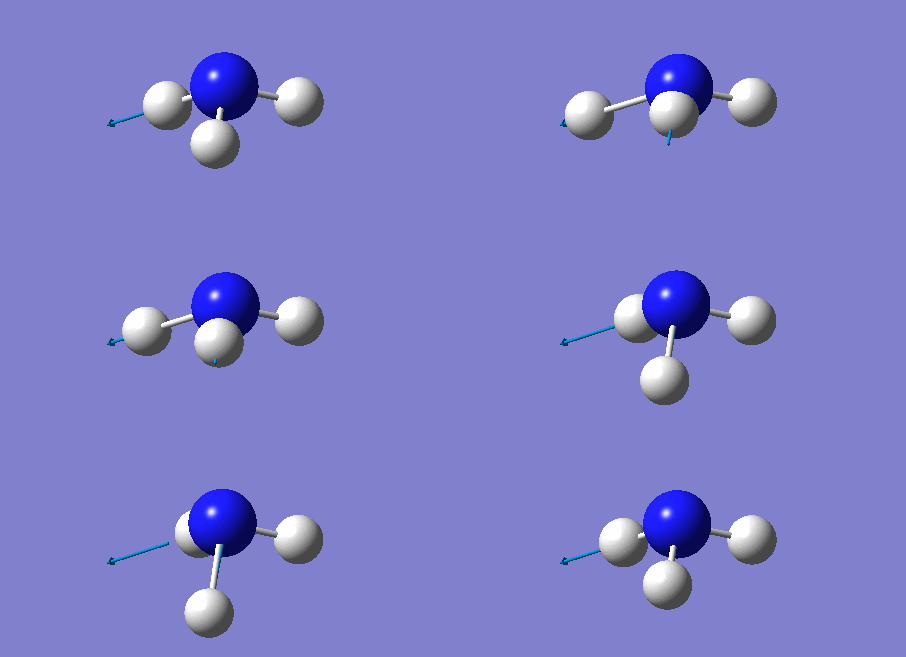
Animation of GaBr3
The computed IR spectrum of BH3 was as shown below:
In theory, every molecule has 3N (N stands for number of atoms) vibrational frequencies. However, due to the motion of the centre of mass of molecule, '-6' term should be added to 3N to take into account of such vibration, resulting in the formula of 3N-6. From the formula, N=4, 3N-6=6. There should be six peaks in the spectrum. Unfortunately, there are less than six peaks in the spectrum. This is because because IR spetrum only records vibrations that results in change in dipole moment. Thus the symmetrical stretch of No.4 (v=197 cm-1) would not show up in the IR spectrum. This leaves to five peaks to appear in the spectrum. However, as No.(1,2) and No.(5,6) are degenerate, this would leave three peaks to the IR spectrum which was predicted by the computation.
Frequency comparison of BH3 and GaBr3
Questions:
1)What does the large difference in the value of the frequencies for BH3 compared to GaBr3 indicate?
The large difference correspond to the difference in reduced mass of the two compounds. This is because the frequency is indirectly proportional to the square root of reduced mass. Thus, as Ga-Br is much heavier than B-H, then v(Ga-Br)<v(B-H). Also it also correspond to the weaker Ga-Br bond than B-H bond as the orbitals employed in formation of Ga-Br bond are much more diffused and thus would be weaker than the more core-like orbitals involved in forming the B-H bonds. As frequencies is directly proportional to the force constant (or bond strength), it is a good reflection of the reliability of the computed result as having Ga-Br is the lower frequency and correspond to weaker bond.
2)Has there been a reordering of modes?
Yes, there has been a reordering of the modes. The mode at 1163 cm-1 has lower frequency than of the degenerate 1213 cm-1 mode in BH3. However, when it comes to GaBr3, the mode become higher in frequency than the degenerate ones. It was due to the GaBr3 started to hv the center Ga atom vibrating as well; while in BH3 the center B does not move in the mode. The movement of Ga would increase the orbital overlap of the d orbitals of the Ga and Br. As frequency is directly proportional to the bond strength, thus there would be reordering of the modes from BH3 to GaBr3.
3)How are these spectra similar?
The two spectra are similar in terms of the number of peaks, which is three. However, the GaBr3 actually has only two obvious peaks with another peak (v=76cm-1)which is very low in intensity. Also, in the results, there were 6 frequencies that showed up with two pairs of frequency that are degenerate and with one peak that does not appear because it was a totally symmetric stretch, no change in dipole moment and thus no peak in IR spectrum. Also, the peak with highest intensity for both spectrum lies at the higher frequencies (right end).
4)For both spectra two modes lie fairly closely together, the A2 and E' modes and then the other two modes also lie fairly close together, the A1' and E' modes, but higher in energy. Why is this?
A1' and E' modes are higher in energy than A2 and E' modes because the stretching motion of the bonds require much more energy than moving the atoms up and down or sideways. This was because when compressing the bond, atoms are moving closer, and this increases the repulsion (potential energy) between the atoms where energy was required to overcome the repulsion. Conversely, when stretching the bond, atoms are moving further, and this increases the attraction (potential energy) between the atoms where energy was required to overcome the attraction and move the atoms away from each other.Also, the (A2, E') modes and (A1', E') modes have similar energies because they involve almost the similar type of motion which resulted in their energy to be same with each other.
5)Why must you use the same method and basis set for both the optimisation and frequency analysis calculations?
In the frequency analysis, the molecular frequency is dependent on the second derivative of energy with respect to the position of the nucleus. Meanwhile, in optimisation, the program would find out the configuration of the molecule with the lowest energy. The frequency analysis if the follow-on calculation of the optimisation. Thus, if were to use different method and basis set, the computer would have used the less or more accurate method in either calculation and would result in inaccuracy in the calculation as the follow-on calculation was not of the same method and basis set. Also, different method and basis set would result in the values obtained are not comparable and not allowed to perform the follow-on calculation. The frequency analysis was to be used as a verification of how well the optimisation was performed and using different method and basis set would not yield a reliable measure of the optimisation job performed earlier as the benchmark was not the same.
6)What is the purpose of carrying out a frequency analysis?
The aim of performing a frequency analysis was to show that we had a minimum in the potential energy surface function where the optimisation could be verified to be accurate and from the analysis, the frequencies should all be positive. If there is one negative frequency, then it correspond to existence of transition state. However, if there are more than one negative frequencies, it would indicate that the optimisation is incomplete or failed and the program is unable to find a critical point.
7)What do the "Low frequencies" represent?
The low frequencies represents the motion of centre of mass of the molecule.
MO diagram of BH3
The link below shows respectively the .log file and .chk file for the energy calculation for BH3 using Gaussian 09.
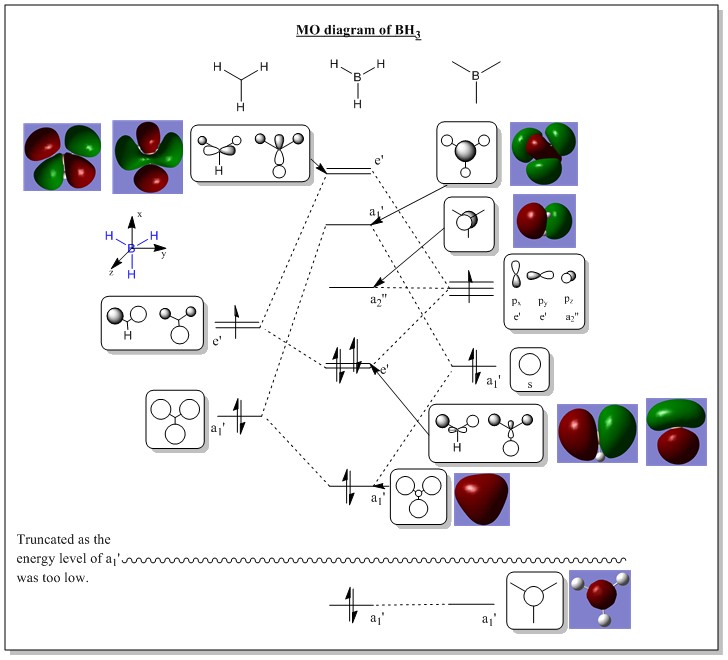
The diagram below shows the comparison between 'real' computed MO and 'LCAO' MO diagram.
| No. | MO diagram | Energy level | No. | MO diagram | Energy level |
| 1 |  |
-6.771 | 5 |  |
-0.066 |
| 2 |  |
-0.513 | 6 |  |
-0.168 |
| 3 |  |
-0.351 | 7 |  |
-0.179 |
| 4 |  |
-0.351 | 8 |  |
-0.179 |
Questions
Question 1: Are there any significant differences between the real and LCAO MOs?
Answer 1: There are no significant differences between the real and LCAO MOs where they were pretty much the same in shape and polarity. There was only a slight difference as the unoccupied real MO orbitals were slightly more diffused than the occupied MOs. On the other hand, the LCAO MOs does not have such diffusion. The form of the unoccupied real MOs (the highest e' degerate orbitals) were slightly odd compared to the LCAO ones.
Question 2: What does this say about the accuracy and usefulness of qualitative MO theory?
Answer 2: The accuracy and usefulness of qualitative MO theory was excellent. It was able to predict and reproduce the same results as the computed ones qualitatively. This was great as it does not involve heavy computational calculations and can be worked out via pen and paper with ease. Also, it was easy to describe and explain to people. However, in terms of quantitative results, it was not very accurate and hard to predict the positions of the exact energy levels as when reaches larger molecules, the orbital interactions would become more complicated.
NBO Analysis of NH3
Optimisation of NH3
Computational analysis of NH3 was investigated using Gaussian 09. It was optimized using the DFT B3LYP/6-31G(d,p)calculations. Other than that, to ensure that the calculation is more accurate, the geometry was restricted to C3v, with the tolerance set to be very tight (0.0001). Additional keyword of SCF=conver=9 and int=ultrafine with tight convergence criteria were used to ensure that the calculation of electron distribution would converge more precisely. The log data of the calculation would be found from the link below:
The data below shows the details and results of the calculation. The energy obtained was -56.55776873 a.u. The optimisation was complete as the RMS gradient is less than 0.001 a.u.
| File Type | .log |
| Calculation Type | FOPT |
| Calculation Method | RB3LYP |
| Basis Set | 6-31G(d,p) |
| Charge | 0 |
| Spin | Singlet |
| E(RB3LYP) | -56.55776873 a.u. |
| RMS Gradient Norm | 0.00000323 a.u. |
| Imaginary Freq | nil |
| Dipole Moment | 1.85 Debye |
| Point Group | C3v |
| Job cpu time | 16.0 seconds |
Also, the job had already converged. It was proven from the data below showing that the full convergence after the job.
Item               Value     Threshold  Converged?
 Maximum Force            0.000006     0.000015     YES
 RMS     Force            0.000004     0.000010     YES
 Maximum Displacement     0.000012     0.000060     YES
 RMS     Displacement     0.000008     0.000040     YES
 Predicted change in Energy=-9.846588D-11
 Optimization completed.
    -- Stationary point found.
From the calculation, it was found that NH3 has the following data for bond length and bond angle.
Bond length (N-H): 1.02 Å
Bond angle (H-N-H): 105.7 deg.
The bond length is comparable to the literature value[3], as given in CRC HANDBOOK OF CHEMISTRY AND PHYSICS 93RD EDITION 2012-2013, which was 1.012 Å (determine via IR experimentally). The bond angle was reported to be 106.7 deg in literature.[3]. The bond length and bond angle is quite close to the literature values, indicating that the basis sets are good enough but could be improved. The dipole moment was reported to be 1.4718 +/- 0.0002 D. [4]. The dipole moment did not match well with the experimental values, thus extra basis sets should be employed to have a better computation.
Frequency analysis of NH3
After the optimisation, the calculation was proceeded with the frequency calculation of NH3. The log file of the data was found from the link below:
The data below shows the details and the results of the calculation. The energy obtained was -56.55776873 a.u., which is similar to the energy obtained from the optimisation above. The frequency calculation was completed as the RMS Gradient Norm is less than 0.001 a.u.
| File Type | .log |
| Calculation Type | FREQ |
| Calculation Method | RB3LYP |
| Basis Set | 6-31G(d,p) |
| Charge | 0 |
| Spin | Singlet |
| E(RB3LYP) | -56.55776873 a.u. |
| RMS Gradient Norm | 0.00000323 a.u. |
| Imaginary Freq | nil |
| Dipole Moment | 1.85 Debye |
| Point Group | C3v |
| Job cpu time | 4.0 seconds |
Also, the job had already converged. It was proven from the data below showing that the full convergence after the job.
Item               Value     Threshold  Converged?
 Maximum Force            0.000006     0.000450     YES
 RMS     Force            0.000003     0.000300     YES
 Maximum Displacement     0.000013     0.001800     YES
 RMS     Displacement     0.000007     0.001200     YES
 Predicted change in Energy=-1.130104D-10
 Optimization completed.
    -- Stationary point found.
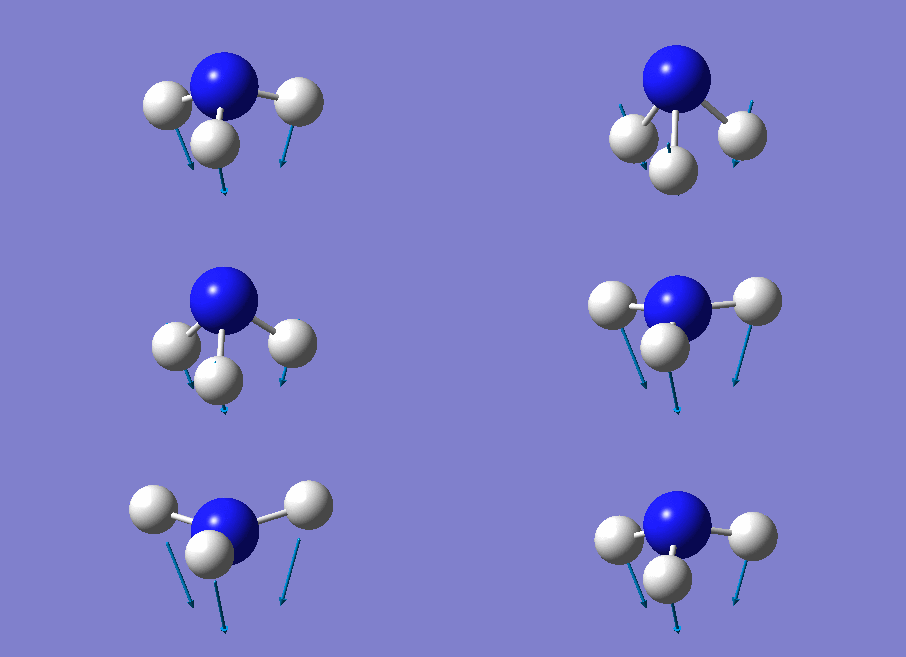
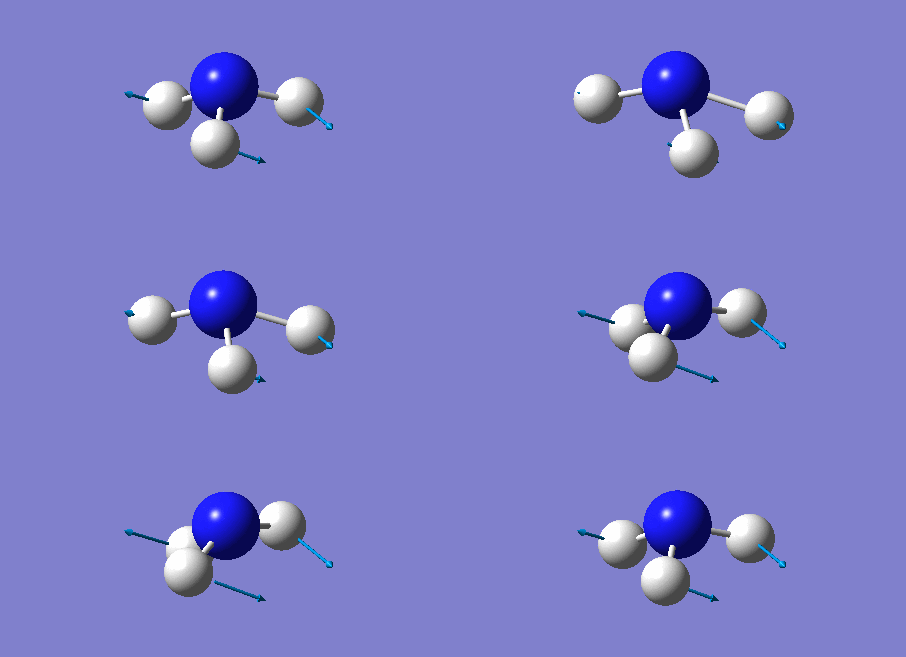
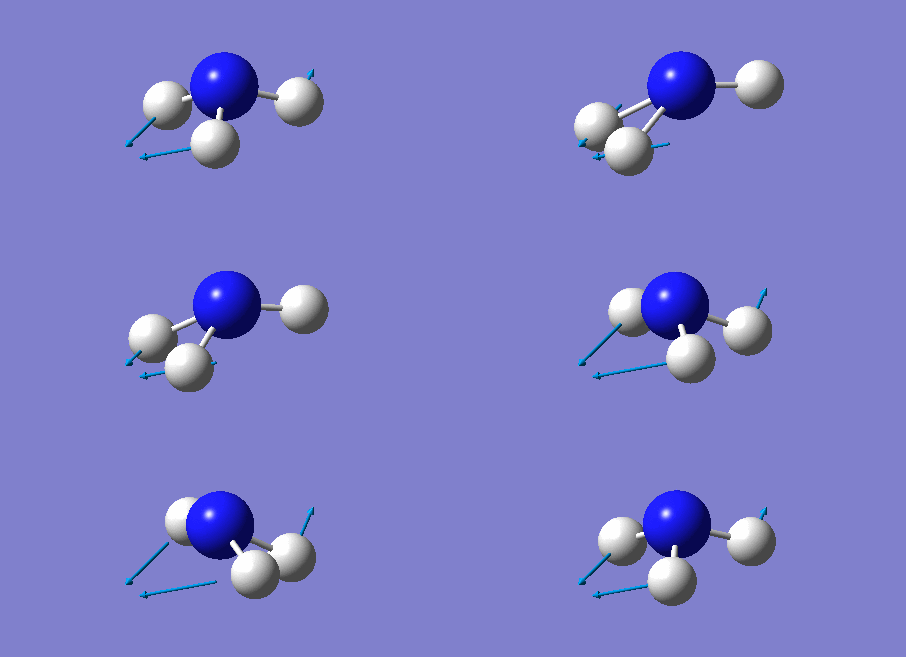
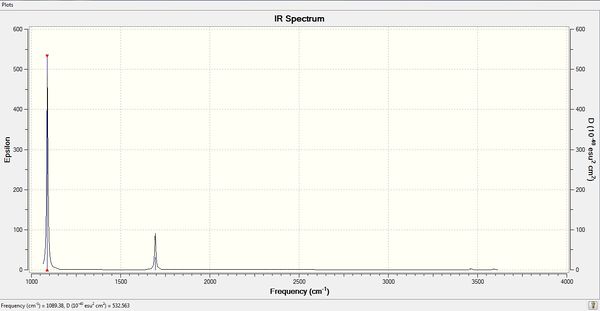
The two lines of frequencies found from the log file was shown below:
 Low frequencies ---   0 0 0 7 8 8 <br>
 Low frequencies --- 1089 1694 1694
The computed IR spectrum of NH3 was as shown below:
In theory, every molecule has 3N (N stands for number of atoms) vibrational frequencies. However, due to the motion of the centre of mass of molecule, '-6' term should be added to 3N to take into account of such vibration, resulting in the formula of 3N-6. From the formula, N=4, 3N-6=6. There should be six peaks in the spectrum. Unfortunately, there are less than six peaks in the spectrum. This is because because IR spetrum only records vibrations that results in change in dipole moment. Thus the symmetrical stretch of No.5 and 6 (v=3590 cm-1) would not show up in the IR spectrum. This leaves to four peaks to appear in the spectrum. However, as No.(2,3)pair is degenerate, this would leave three peaks to the IR spectrum which was predicted by the computation.There was a peak at 3461 cm-1 which has very low intensity and is hardly visible in the spectrum.
NBO details
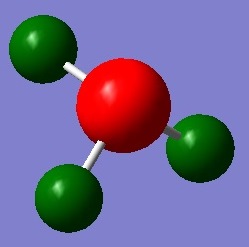

The link below shows the log file for the population computation that was performed to ammonia.
From Figure 1, it shows the image of the charge distribution of NH3. The bright red color indicates highly negative charge is deposited on the N atom while the H atoms have green color which indicate that positive charge is deposited on the atoms. It was reasonable as nitrogen is much more electronegative than hydrogen atoms and thus would pull electron density towards itself more. Also, it as a lone pair which could attribute to its highly negative charge. In Figure 2, it shows the numerical charges deposited on the atoms individually. The nitrogen atoms exceeded the maximum -1.000 charge range most probably due to the lone pair on the nitrogen.
The charge range was -1.000 to +1.000.
NBO charges for Nitrogen was -1.125 while Hydrogen was 0.375.
Association energies of Ammonia-Borane
Optimisation of Ammonia-Borane
Computational analysis of NH3BH3 was investigated using Gaussian 09. It was optimized using the DFT B3LYP/6-31G(d,p)calculations. Additional keyword of SCF=conver=9 and int=ultrafine with tight convergence criteria were used to ensure that the calculation of electron distribution would converge more precisely. The log data of the calculation would be found from the link below:
The data below shows the details and results of the calculation. The energy obtained was -83.22468906 a.u. The optimisation was complete as the RMS gradient is less than 0.001 a.u.
| File Type | .log |
| Calculation Type | FOPT |
| Calculation Method | RB3LYP |
| Basis Set | 6-31G(d,p) |
| Charge | 0 |
| Spin | Singlet |
| E(RB3LYP) | -83.22468906 a.u. |
| RMS Gradient Norm | 0.00000124 a.u. |
| Imaginary Freq | nil |
| Dipole Moment | 5.56 Debye |
| Point Group | C1 |
| Job cpu time | 53.0 seconds |
Also, the job had already converged. It was proven from the data below showing that the full convergence after the job.
Item               Value     Threshold  Converged?
 Maximum Force            0.000002     0.000015     YES
 RMS     Force            0.000001     0.000010     YES
 Maximum Displacement     0.000026     0.000060     YES
 RMS     Displacement     0.000009     0.000040     YES
 Predicted change in Energy=-8.957668D-11
 Optimization completed.
    -- Stationary point found.
From the calculation, it was found that NH3BH3 has the following data for bond length and bond angle.
Bond length (B-H): 1.21 Å
Bond length (B-N): 1.67 Å
Bond length (N-H): 1.02 Å
Bond angle (H-N-H): 107.9 deg.
Bond angle (H-B-H): 113.9 deg.
From literature values[5], the B-N distance is 1.592 Å, which is slightly deviated from the computational value. The B-H and N-H distances are 1.222 and 1.030 Å, respectively which are very close to the literature values. Overall, the computational prediction agreed well with the literature values but could still be improved.
Frequency analysis of Ammonia-Borane
After the optimisation, the calculation was proceeded with the frequency calculation of NH3BH3. The log file of the data was found from the link below:
The data below shows the details and the results of the calculation. The energy obtained was -83.22468901 a.u., which is similar to the energy obtained from the optimisation above. The frequency calculation was completed as the RMS Gradient Norm is less than 0.001 a.u.
| File Type | .log |
| Calculation Type | FREQ |
| Calculation Method | RB3LYP |
| Basis Set | 6-31G(d,p) |
| Charge | 0 |
| Spin | Singlet |
| E(RB3LYP) | -83.22468901 a.u. |
| RMS Gradient Norm | 0.00000117 a.u. |
| Imaginary Freq | nil |
| Dipole Moment | 5.56 Debye |
| Point Group | C1 |
| Job cpu time | 30.0 seconds |
Also, the job had already converged. It was proven from the data below showing that the full convergence after the job.
Item               Value     Threshold  Converged?
 Maximum Force            0.000003     0.000450     YES
 RMS     Force            0.000001     0.000300     YES
 Maximum Displacement     0.000021     0.001800     YES
 RMS     Displacement     0.000011     0.001200     YES
 Predicted change in Energy=-9.992352D-11
 Optimization completed.
    -- Stationary point found.
The two lines of frequencies found from the log file was shown below:
  Low frequencies ---   -6 -6 0 0 0 3
 Low frequencies ---  263 633  638
From the calculation, it was found that NH3BH3 has the following data for bond length and bond angle.
Bond length (B-H): 1.21 Å
Bond length (B-N): 1.67 Å
Bond length (N-H): 1.02 Å
Bond angle (H-N-H): 107.9 deg.
Bond angle (H-B-H): 113.9 deg.
From literature values[5], the B-N distance is 1.592 Å, which is slightly deviated from the computational value. The B-H and N-H distances are 1.222 and 1.030 Å, respectively which are very close to the literature values. Overall, the computational prediction agreed well with the literature values but could still be improved.
Calculation of association energy
E(NH3)= -56.55476873 a.u.
E(BH3)= -26.61532364 a.u.
E(NH3BH3)= -83.22468901 a.u.
ΔE=E(NH3BH3)-[E(NH3)+E(BH3)]= -83.22468901+56.55476873+26.61532364 = -0.05459664 a.u.
Association energy = Dissociation energy = -0.05459664 a.u. = - 143 kJ/mol
From the literature, B-N dissociation energy is 377.9 +/- 8.7 kJ/mol [6]. The computational value did not agree well with the literature value, this could be attributed to the calculation of such energies not taking into account some interactions that is present in the adduct.
References
- ↑ 1.0 1.1 Haynes, W.M., CRC Handbook of Chemistry and Physics 93rd Edition 2012-2013, CRC Press, Taylor & Francis Group, 2012, page 9-21.
- ↑ 2.0 2.1 Haynes, W.M., CRC Handbook of Chemistry and Physics 93rd Edition 2012-2013, CRC Press, Taylor & Francis Group, 2012, page 9-23. Cite error: Invalid
<ref>tag; name "ja220292230293" defined multiple times with different content - ↑ 3.0 3.1 3.2 Haynes, W.M., CRC Handbook of Chemistry and Physics 93rd Edition 2012-2013, CRC Press, Taylor & Francis Group, 2012, page 9-20. Cite error: Invalid
<ref>tag; name "ja220292230295" defined multiple times with different content - ↑ Landolt-Bornstein,Numerical Data and Functional Relationship in Science and Technology, New Series, II/19c, 1992, Spring-Verlag, Heidelberg.
- ↑ 5.0 5.1 Wu, H., Zhou, W., Pinkerton, F.E., Meyer, M.S., Srinivas, G., Yildirim, T., Udovic, T.J., Rush, J.J., J. Mater. Chem., 2010, 20, 6550-6556.
- ↑ Luo, Y.R., Comprehensive Handbook of Chemical Bond Energies, CRC Press, Boca Raton, FL, 2007.

