Rep:Mod:bgasuki
Chia Bai Lin(00567650)
Introduction
In this module, the transition structures in larger molecules such as Cope rearrangement and Diels Alder cycloaddition reactions will be studied through solving the Schrodinger equation numerically and using different calculation methods for transition structures such as TS(Berny) and QST2 methods.
The Cope Rearrangement
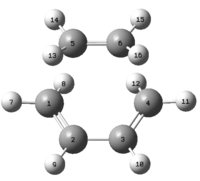
The Cope Rearrangement is a pericyclic [3,3]-sigmatropic rearrangement reaction which involves a breaking and forming of a σ-bond in a concerted fashion as shown in Fig. 1.1.

After years of controversy, recent research[1] has confirmed that the reaction undergoes a concerted mechanism with two possible geometries for its transition state: the chair or the boat conformation. In this module, both the 1,5-hexadiene reactant and product, the chair and boat transition structures, will be studied through means of different optimisation methods.
Optimisation of Reactant and Product
In the structure of 1,5-hexadiene molecule, two C=C double bonds are located at both ends of the chain and are linked by 4 C-C single bonds. These singly bonded carbon atoms are able to rotate freely about the σ-bond, generating many possible conformers for both the reactant and the product. The two main conformers that will be discussed are the anti-conformer and the gauche-conformer. To determine the structure of each conformer, one common way of picturing these two is to generate a staggered conformation in the Newman projection as shown below.
 |
 |

For anti-conformation, the two alkene groups are anti-periplanar to each other, with the dihedral angle between carbon C2-C3-C4-C5 is 180o. For gauche-conformation, the two alkene groups are syn-clinical (or Gauche) to each other with the dihedral angle between carbon C2-C3-C4-C5 is 60o.
A) Optimisation of anti-conformer
The anti-1,5-hexadiene conformer was drawn in Gaussview with the dihedral angle between C2 to C5 is 180o. This structure was then cleaned and optimised with the following input command:
Job type: optimisation
The method: Hartree-Fock
The basis set: 3-21G
| Conformer | Energy (a.u.) | Point Group | Output Link | ||||
|---|---|---|---|---|---|---|---|
| anti-conformer |
|
-231.69253527 | Ci | Anti Conformer | |||
By comparing both the energy, the point group and the structure, this anti-conformer corresponds to the anti 2 structure in Appendix 1 of Module 3.
B) Optimisation of gauche-conformer
The gauche-1,5-hexadiene conformer was drawn in Gaussview with the dihedral angle between C2 to C5 is 60o. This structure was then cleaned and optimised with the following input command:
Job type: optimisation
The method: Hartree-Fock
The basis set: 3-21G
| Conformer | Energy (a.u.) | Point Group | Output Link | ||||
|---|---|---|---|---|---|---|---|
| gauche-conformer |
|
-231.69166701 | C2 | Gauche Conformer | |||
Also by comparison, this conformer corresponds to Gauche 2 conformer as listed in Appendix 1 of Module 3.
C) Hypothesis of Lowest Energy Conformer
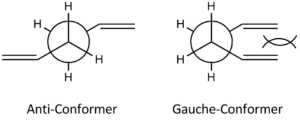
From the Newman projection above, the Gauche conformer is expected to experience greater steric hindrance and hence will be less stabilised. Therefore the anti conformer is expected to be the lower energy conformer. However, there are still different possible structures of anti conformers and in order to predict the lowest energy conformer, the structure is altered manually and optimised with the same input command:
Job type: optimisation
The method: Hartree-Fock
The basis set: 3-21G
The results of different conformers are summarised and tabulated in part D).
D) Identification of Optimised Structure
Different conformers are manually adjusted by altering the 3 main dihedral angles between the carbons, with the numbering of carbon atoms correspond to that as labelled in Fig.1.4. The dihedral angles listed below are the angles that were set before optimisation.
| Conformer | Corresponding structure in Appendix 1 | Dihedral Angle between C1 to C4 | Dihedral Angle between C2 to C5 | Dihedral Angle between C3 to C6 | Energy (a.u.) | Point Group | Output Link | ||||
|---|---|---|---|---|---|---|---|---|---|---|---|
| Anti conformer 1 |
|
anti 2 | 120o | 180o | 120o | -231.69253527 | Ci | Anti Conformer 1 | |||
| Anti conformer 2 |
|
anti 3 | 0o | 180o | 0o | -231.68907050 | C2h | Anti Conformer 2 | |||
| Anti conformer 3 |
|
anti 4 | 60o | 180o | 120o | -231.68937804 | C1 | Anti Conformer 3 | |||
| gauche conformer 1 |
|
gauche 2 | 180o | 60o | 180o | -231.69166701 | C2 | Gauche Conformer 1 | |||
| gauche conformer 2 |
|
gauche 3 | 120o | 60o | 180o | -231.69266110 | C1 | Gauche Conformer 2 | |||
| gauche conformer 3 |
|
gauche 1 | 0o | 60o | 0o | -231.68771613 | C2 | Gauche Conformer 3 | |||
From the information above, it is surprise to discover that the lowest energy conformer is the Gauche 1 conformer (energy of -231.68771613 Hartree a.u.) instead of an anti conformer as predicted. When considering the relative stability of a molecule, stereo-electronic factor is usually considered together with the sterics. Since the Gauche conformer is the most stabilised one, the favourable electronic interaction in this conformation overrides the strain arises from sterics.
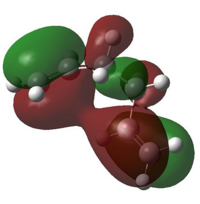
To have a better understanding of the electronic interaction of Gauche 1 conformer, its frontier molecular orbitals were simulated from its checkpoint file and in particular the HOMO and LUMO of Gauche 1 were pictured:
 |
 |
In the HOMO of Gauche 1 molecule, the two alkene bonds are orientated in such a way that the π cloud orbitals of both C=C bonds are in phase with each other, allowing favourable π- π interactions and therefore stabilised the molecule. Similar interactions can also be found in the LUMO, where the antibonding orbitals of both C=C*bonds are aligned in the correct orientation and allowed favourable orbital overlap between the two alkene groups, hence stabilising the molecule. This stabilising interaction cannot be found in anti-conformers as the two alkene groups are pointed away from each other, hindering the possibility of orbital overlap. These favourable orbital interactions in Gauche 1 conformer outweighed the destabilisation arose from sterics clashes and is the lowest energy conformer.
E) Optimisation of anti 2 Conformer
The required anti 2 conformer was optimised previously in the initial optimisation for anti conformer at HF/3-21G level as shown above with point group of Ci symmetry.
F) Comparison between Optimisation at HF/3-21G and DFT-B3LYP/6-31G Level
DFT optimisation method is another optimisation method with higher accuracy and was applied to the anti 2 conformer with the following input:
Job type: optimisation
The method: DFT – B3LYP
The basis set: 6-31G
| Basis Set | Output Logfile | Jmol modelling | Point Group | Energy/ Hartree a.u. | Energy / Kcal mol-1 |
| HF/3-21G | HF/3-21G opt. | C1 | -231.69254 | -608308.75 | |
| DFT-B3YLP/6-31G | DFT-B3LYP /6-31G opt. | C1 | -234.55970 | -615836.48 | |
| Energy Difference | - | - | - | -2.86716 | -7527.73 |
| Basis Set | Dihedral angle (C1-C4)/o | Dihedral angle(C2-C5)/o | Dihedral angle(C3-C6)/o | C=C bond length/Å | C2-C3/ C4-C5 bond length/ Å | C3-C4 bond length/ Å |
| HF/3-21G | 114.63 | 179.96 | 114.63 | 1.3162 | 1.5089 | 1.5530 |
| DFT-B3YLP/6-31G | 118.71 | 180.00 | 118.71 | 1.3383 | 1.5072 | 1.5550 |
From the 3D model, there is no visible difference between the two optimised anti-2 conformer. The physical data for both were compatible and has one noticeable deviation on the diherdral angle between C1-C4 and C3-C6. This value produced for optimising at HF/3-21G level is 114.63o whereas that for optimising at DFT-B3YLP/6-31G level is 118.71o. The C=C bond length of ~1.32 Å and C-C bond length of ~1.51 Å /1.55 Å are in good agreement with the literature [2] and therefore both optimisation method yields pretty accurate result for 1,5-hexadiene molecule.
The main significant difference between the two calculation methods is the total energy generated. The result yielded by DFT-B3LYP/6-31G calculation method is significantly lowered than that yielded by HF/3-21G calculation method. This difference can attribute to DFT-B3LYP calculation uses a higher level of calculation method and hence able to locate a better minimum point to obtain a more stable conformer.
G) Frequency Analysis
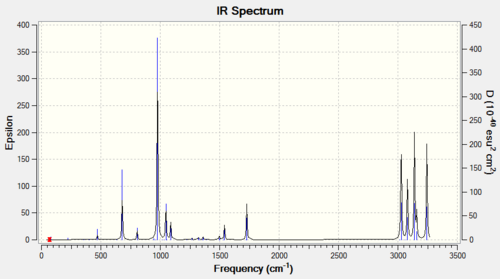
In order to confirm a minimum point is obtained, a frequency calculation is run on the anti 2 conformer and a predicted IR spectrum is produced. The frequency analysis does not contain any imaginary frequency and hence can be confirmed to be a minimum, The following table contains some of the identified vibrational motions in the conformer:
| Frequency | Intensity | Assignment |
|---|---|---|
| 1728.5 | 20 | asymmetric C=C stretch |
| 3027.6 | 59 | symmetric vinyl C-H stretch |
| 3080.4 | 37 | asymmetric vinyl C-H stretch |
| 3139.4 | 60 | alkene C-H stretch |
| 3159.0 | 14 | asymmetric alkene C-H stretch |
| 3243.8 | 56 | symmetric alkene C-H stretch |
Also, some of the energetic data can be achieved from the calculation and the following summary is extracted from part of the output logfileOutput:
... ...
 Zero-point correction=                           0.143444 (Hartree/Particle)
 Thermal correction to Energy=                    0.150745
 Thermal correction to Enthalpy=                  0.151689
 Thermal correction to Gibbs Free Energy=         0.111800
 Sum of electronic and zero-point Energies=           -234.416252
 Sum of electronic and thermal Energies=              -234.408952
 Sum of electronic and thermal Enthalpies=            -234.408008
 Sum of electronic and thermal Free Energies=         -234.447897
... ...
Optimisation of Chair and Boat transition state
A) Optimisation of Allyl Fragment
The allyl fragment, CH2CHCH2, was first optimised with the following input command:
Job type: optimisation
The method: HF
The basis set: 3-21G
Output Logfile: http://hdl.handle.net/10042/to-6178
This allyl fragment has an optimised energy of -115.82303994 Hartree a.u. and point group symmetry of C2v. This allyl fragment was reproduced and duplicated on a new molecular group to produce a guessed Chair transition state molecule, with the C-C distance between the two allyl groups approximately 2.2Å.
B) Optimisation of a guessed Chair structure to a Transition State (Berny)
The guessed Chair transition state structure was the optimised with frequency analysis with the following input command:
Job type: Opt+Freq - Optimised to a TS (Berny) - Force constant - once
The method: HF
The basis set: 3-21G
Additional Keyword: Opt=NoEigen
Output Logfile: http://hdl.handle.net/10042/to-6179
The terminal C-C bond length is 2.0203 Å with its optimised energy of -231.61932242 a.u. An imaginary frequency was observed at -817.86 cm-1 and this confirmed the success of optimisation as this vibration corresponds to the transition state in the Cope rearrangement, which simulated the bond breaking and forming process in the pericyclic reaction. This method will work well only when the guess structure is similar to the actual transition state structure.
C & D) Optimisation of Chair Transition Structure with Frozen Coordinate method
Another approach to find the Chair transition structure is using the Frozen Coordinate Method. This method freezes the terminal C-C distance to 2.20 Å and optimised the molecule with TS (Berny) Optimisation with Hessian Derivative calculation for C-C bond breaking /forming lengths with additional keyword of opt=ModRedundant.
Job type: Opt+Freq
- Optimised to TS (Berny)
The method: HF
The basis set: 3-21G
Additional Keyword: Opt=modredundant,NoEigen
Output Logfile: http://hdl.handle.net/10042/to-6181
| TS (Berny) Opt. | Freeze Coordinate Opt. | |
|---|---|---|
| Energy/Hartree a.u | -231.61932242 | -231.61932214 |
| Energy/kcal mol-1 | -145343 | -145343 |
| Terminal C-C bond Length/Å | 2.02031 | 2.02073 |
| Imaginary frequency/cm-1 | -817.86 | -818.06 |
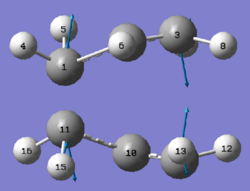
Both transition state optimisation method yields very compatible results for the energy of the TS. Both methods have the same terminal C-C bond distance of 2.02 Å and an imaginary frequency of -818cm -1. Upon animating this vibration, it shows asynchronous bond formation which corresponds to the Cope Rearrangement of pericyclic reaction for 1,5 hexadiene. The snapshots of the vibrational motion picture the transition state structure:
 |
 |
This vibration models the motion of the molecule during the pericyclic reaction where bond breaking and forming were occurring simultaneously.
E) Optimisation of Boat Transition Structure with QST2 method
The anti 2 conformer that was previously optimised in Part 1f was duplicated and created a new molecular group for boat transition structure optimisation. A new optimisation method, TSQ 2 method, was employed and in this calculation, the structure of the reactant and product can be specified and it will automatically interpolate to find the transition state structure. The new molecular group was created as instructed and oriented as shown below:
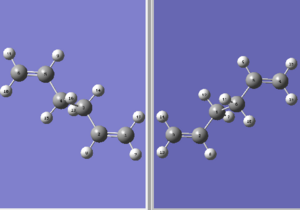
This reactant/product pair was then optimised with the following input command:
Job type: Opt+Freq - Optimised to TS (QST2)
The method: HF
The basis set: 3-21G
Additional Keyword: Opt=NoEigen
Output Logfile: http://hdl.handle.net/10042/to-6182

This reactant/product pair yields an awkward looking transition structure with bonds forming diagonally across the terminal carbons and has an optimised energy of -231.51488999a.u. and terminal C-C bond length of 3.2874Å. There was no vibrational motion identified and an error message was generated upon optimisation and this job has failed to simulate the boat transition structure.
The reactant/product pair was then modified to better simulate the boat transition structure. The dihedral angle between C2-C3-C4-C5 was manually modified to 0o and the two inside carbon angles, C2-C3-C4 and C3-C4-C5,were also modified to 100o. The new reactant/product pair hence looks like this:
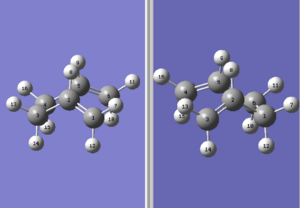
This reactant/product pair was then optimised using the same input command as the 1st pair and this time, the job successfully generated a boat transition structure:
Output logfile: http://hdl.handle.net/10042/to-6183
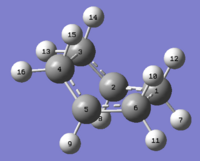
This yielded a boat transition structure with an optimised energy of -231.60280214a.u. and a reasonable terminal C-C bond length of 2.1399Å. An imaginary frequency was also observed at 840.44 cm -1 and this showed that the calculation of boat transition structure was successful.
F) Intrinsic Reaction Coordinate
By using the Intrinsic Reaction Coordinate (IRC) method, it is possible to determine the corresponding conformer in the transition state. This calculation method is carried out by taking a series of points through taking small geometry steps in the direction where the gradient or slope of the energy surface is steepest, and connects this to the corresponding conformer. The HF/3-21G optimised chair conformer was used for further IRC calculation with the force constant calculated once and max number of points to 50.
%chk=IRC chair opt.chk

# irc=(forward,maxpoints=50,calcfc) hf/3-21g geom=connectivity

IRC chair opt
 |
 |
The resulting calculation yields the above two plots with a total energy of -231.61932200a.u, which does not match any of the conformers listed on Appendix 1 of Module 3, and this shows that a minimum geometry has yet to be reached. To obtain a minimised energy, further calculation can be done by calculating the force constant at every IRC step, i.e. set the force constant to always.
A new calculation is run and generated the following plots:
 |
 |
The curve of the RMS gradient norm graph for the second calculation has its gradient approaches zero as it flattens out. Total energy of the structure is -231.69166734a.u., which is lower than that of the first calculation and both of the information supports that this is a more stable conformer and a minimum point is achieved. This chair conformer has a point group of C2 and the resulting molecule adopts a gauche-2 structure (with reference to Appendix 1 in module 3).
| Method (Jmol) | output file | Energy / Hartree a.u. | Conformer |
|---|---|---|---|
| Optimisation | Optimisation Output | -231.61932214 | gauche2 |
| IRC - Force constant = once | FC=once output | -231.61932200 | no match |
| IRC - Force constant=always | FC=always Output | -231.69166734 | gauche2 |
G) Activation Energy of the Transition Structure
In order to determine the activation energy of respective transition structures, both the chair and boat transition structures were re-optimised with a higher level of theory of DFT-B3LYP/6-31G followed by a frequency analysis. A comparison of energies between different calculation methods is tabulated as follow:
| Level of theory used | HF/3-21G | DFT-B3LYP/6-31G* | ||||||
|---|---|---|---|---|---|---|---|---|
| Type of Energy | Log File | Electronic energy /Hartrees a.u. | Sum of electronic and zero point energies at O K /Hartrees a.u. | Sum of electronic and thermal energies at 298.15K /Hartrees a.u. | Log File | Electronic energy /Hartrees a.u. | Sum of electronic and zero point energies at OK /Hartrees a.u. | Sum of electronic and thermal energies at 298.15K /Hartrees a.u. |
| Chair TS | Chair-HF | -231.619322 | -231.466706 | -231.461346 | Chair-DFT | -234.556983 | -234.311494 | -234.305980 |
| Boat TS | Boat-HF | -231.602802 | -231.450924 | -231.445293 | Boat-DFT | -234.543093 | -234.351364 | -234.345066 |
| Reactant (anti2) | Anti-2 | -231.692535 | -231.539539 | -231.532565 | Anti-2 | -234.511703 | -234.416252 | -234.408952 |
There is no visual difference between the resulting structures from both calculation method. However, there is a noticeable difference between the energy calculated and in general, the energy achieved by DFT calculation method is lower than that achieved by Hartree-Fock method by a consistent difference. This difference can be attributed to DFT calculation method which adopts a more sophisticated level of theory and therefore a more stable structure can be achieved.
The activation energy of the reaction can be calculated from the difference between the sum of electronic and zero-point energies of Transition Structure and that of reactant's. The activation energy for respective pathways are calculated as follow:
| HF/3-21G | B3LYP/6-31G* | Expt. | |||
|---|---|---|---|---|---|
| at 0 K | at 298 K | at 0 K | at 298 K | at 0 K | |
| ΔE (Chair) | 45.70 | 45.94 | 34.06 | 34.34 | 33.5 ± 0.5 |
| ΔE (Boat) | 55.60 | 56.31 | 41.96 | 43.06 | 44.7 ± 2.0 |
The results yield by HF calculation and DFT calculation differs by a consistent margin but the general trends are the same. Both calculations suggested that the activation energy needed to form a boat transition structure is higher than that for a chair structure and this implies that under a kinetically controlled reaction, forming a chair transition structure will be favoured over the boat transition structure. Also, with cross reference to the literature,DFT calculation method proved to simulate molecules better as it yields a more accurate result.
The Diels Alder Cycloaddition
Diels Alder cycloaddition is a classic pericyclic reaction which involves the interactions between π orbitals of a diene and a dienophile to form a new cyclic compound. In this section of the module, two Diels Alder Cycloaddition reactions will be discussed: Normal 0 false false false EN-GB ZH-TW X-NONE i) Cycloaddition of cis-butadiene and Ethylene ii) Cycloaddition of Maleic anhydride and Cyclohexadiene
i) Optimisation of cis-butadiene with semi-empirical AM1 method
A simple example of Diels Alder reaction is the cycloaddition between cis-butadiene and ethylene where the cis-butadiene acts as a diene and ethylene as a dienophile. This [4π+2π] (4π electrons contributed by the diene and 2π electrons contributed by the dienophile) cycloaddition results in 2 new σ bonds formed as shown in the reaction scheme:

In order to study the reaction particularly the MO interactions, both cis-butadiene and ethylene molecule were drawn with GaussView and optimised with semi-empirical AM1 method with the following input command:
Job type: Optimisation
The method: Semi-empirical – AM1i
| Cis-butadiene | Ethylene | |
|---|---|---|
| Output file | D space | D space |
| Jmol | ||
| Optimised Energy/a.u. | 0.04879719 | 0.02619028 |
| HOMO | 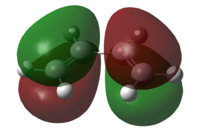 |
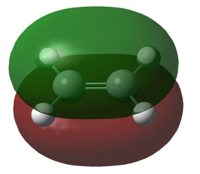 |
| Symmetry of HOMO | Anti-Symmetric | Symmetric |
| Energy of HOMO/a.u. | -0.3481 | -0.38775 |
| LUMO |  |
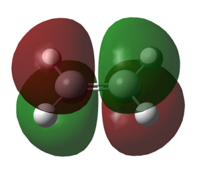 |
| Symmetry of LUMO | Symmetric | Anti-Symmetric |
| Energy of LUMO/a.u. | 0.01707 | 0.05283 |
From the results above, the HOMO of cis-butadiene and the LUMO of ethylene are both anti-symmetric whereas the LUMO of cis-butadiene and the HOMO of ethylene are both symmetric. Due to the conservation of orbital symmetry, only orbitals with same symmetry can interact and this is crucial in pericyclic reaction as it determines the stereo-outcome and the viability of a reaction. In this reaction, the symmetric pair of HOMO of ethylene and LUMO of cis-butadiene is more likely to interact as the energy of HOMO of ethylene is lower and forms overall more stable product, therefore this reaction path is most likely to be kinetically favoured.
ii) Optimisation of the Transition State
The transition structure of this reaction is generated with TS(Berny) calculated at HF/3-21G level. An initial guess structure was predicted with the ethylene molecule attacks parallel to the plane of the cis-butadiene molecule and calculated with the following input command:
Job type: Opt+Freq
- Optimised to TS (Berny)
The method: HF
The basis set: 3-21G
Additional Keyword: Opt=NoEigen
| Transition State | |
|---|---|
| Output Log file | Dspace |
| Jmol | |
| Total Energy/ Hartree a.u. | -230.03689359 |
| bond forming C-C length/Å | 2.21610 |
| Vibration motion of Imaginary frequency | 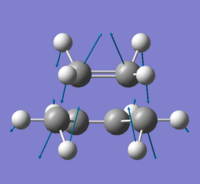
|
| imaginary frequency/cm-1 | -968.19 |
| HOMO of Transition Structure | 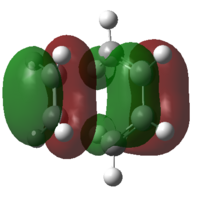
|
| Energy of HOMO/Hartree a.u. | -0.25000 |
| LUMO of Transition Structure | 
|
| Energy of LUMO/Hartree a.u. | 0.25623 |
A transition structure was successfully optimised as confirmed by the presence of an imaginary frequency. The HOMO of TS arise from the anti-symmetric orbital overlap of HOMO of butadiene and the LUMO of ethylene whereas the LUMO of TS is arise from the symmetric overlap of the LUMO of butadiene and the HOMO of ethylene. This supports the previous discussion in part i where the anti-symmetric overlap is more stable and the symmetric overlap of the HOMO-LUMOs. This reaction involves 6п (ie, 4n+2) electrons and in consideration of Huckel theory, this new bonds will be formed suprafacially under thermal condition, where both bonds will form on the same face of the molecule.
According to the literatures, a typical sp3 C-C single bond length is about 1.544Å while that for a sp2 C=C double bond is about 1.338Å[3]. The calculated C=C bond length is 1.357Å, which is greater than that of the literature's but less than C-C single bond. This may perceive as the C=C bond is being elongated during the transition of breaking the double bond and forming the new single bond, where it is yet to become a full C-C bond.
iii) Regio-selectivity of Cycloaddition between hexa-1,3-diene and Maleic Anhydride
The cycloaddition between hexa-1,3-diene and maleic anhydride is another classic example of Diels Alder reaction which is capable of forming two possible products: the Exo and the Endo adduct.

Optimisation of Reactants
To begin with, both reactants were first optimised at HF/3-21G level with the following input command and summarized in Table 3.4:
Job type: optimisation
The method: Hartree-Fock
The basis set: 3-21G
| Hexa-1,3-diene | Maleic Anhydride | |
|---|---|---|
| Output Log file | Dspace | Dspace |
| Jmol | ||
| Total Energy/ Hartree a.u. | -230.54323123 | -375.10351343 |
| HOMO | 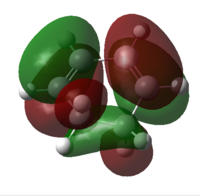 |

|
| Symmetry | Anti-symmetric | Symmetric |
| Energy of HOMO/Hartree a.u. | -0.30293 | -0.44750 |
| LUMO |  |
|
| Symmetry | Symmetric | Anti-symmetric |
| Energy of LUMO/Hartree a.u. | 0.13618 | 0.02547 |
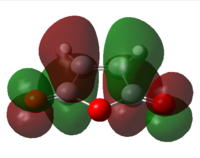
Similar to the previous example as discussed in part i and ii, two bonding pairs are possible between the symmetric HOMO of maleic anhydride and LUMO of hexa-1,3-diene, and the anti-symmetric HOMO of hexa-1,3-diene and LUMO of maleic anhydride.
Optimisation of Transition Structures
Both endo and exo TS were both orientated according to respective orientation (can be seen from Jmol) and were calculated at TS(Berny) level with the following input command:
Job type: Opt+Freq
- Optimised to TS (Berny)
The method: HF
The basis set: 3-21G
Additional Keyword: Opt=NoEigen
| Exo TS | Endo TS | |
|---|---|---|
| Output Log file | Dspace | Dspace |
| Jmol | ||
| Total Energy/ Hartree a.u. | -605.40557710 | -604.71376115 |
| imaginary frequency/cm-1 | -643.73 | -647.47 |
| HOMO |  |
|
| Symmetry | Anti-symmetric | Anti-Symmetric |
| Energy of HOMO/Hartree a.u. | -0.30618 | -0.24445 |
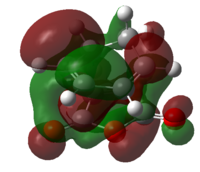
| LUMO | 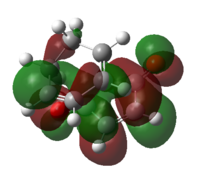 |
|
| Symmetry | Anti-symmetric | Anti-Symmetric |
| Energy of LUMO/Hartree a.u. | 0.03312 | 0.08845 |
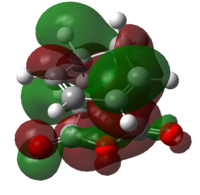
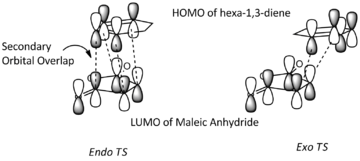
The HOMO and LUMO of both transition structures are all anti-symmetric and this is due to more complex orbital structures and orbital overlap. In general, it is expected that the Endo transition state will be favoured as the HOMO of hexa-1,3-diene will be able to have secondary orbital overlap with the LUMO of maleic anhydride as depicted in Fig.3.3. This secondary orbital overlap is a stabilising interaction[4] that occurs between in-phase orbitals of π* C=O orbital and the incoming conjugated carbon centres. This stabilising interaction will effectively lowers the activation energy needed to form the Endo TS (which is supported by the total energy data in Table 3.5) and therefore the Endo adduct forms the major product.
Conclusion
Gaussian calculations have simulated the transition structures with good accuracy and provides reasonable estimation for kinetically controlled reactions. The vibrational motion of crucial bond breaking and forming transition in TS can also be visualized with the frequency analysis. The accuracy of the simulation can further be improved by using higher level of calculation theories such as DFT-B3LYP/6-31G.
Reference
- ↑ Olaf Wiest, Kersey A. Black, K. N. Houk, J. Am. Chem. Soc., 1994, 116(22), pp 10336-10337.DOI:10.1021/ja0010a078
- ↑ Gyorgy Schulte, Istvan Hargittai, J. Of Molecular Structure, 1995, Vol 346,63-69.DOI:10.1016/0022-2860(94)09007-C
- ↑ M. J. S. Dewar and H. N. Schmeising, Tetrahedron, 1960, 11, DOI:10.1016/0040-4020(60)89012-6
- ↑ R. Hoffmann, R.B. Woodward, J. Am. Chem. Soc., 1965, 87, 4388. DOI:10.1021/ja00947a033

