Rep:Mod:bg1512MgO
Computational investigation of MgO
by Bjorn Gugu
Computations conducted 08/11/2014 - 19/11/2014
Abstract
The thermal expansion coefficient of magnesium oxide, MgO, was calculated via two computational approaches: Lattice vibrations and molecular dynamics. The volume increased, within a reasonable approximation, linearly in both methods. The lattice vibrations method showed consistently higher values than the MD approach. The thermal expansion coefficient, α, was calculated in both cases. For the lattice vibrations method, a fourth degree polynomial was found to show the best fit. The MD approach exhibits a linear dependence of α vs. T. MD provides more accurate results for both volume and lattice constant, whereas the lattice dynamics approach suggests a more accurate α.
Introduction
This experiment investigates the thermal expansion of Magnesium Oxide, MgO. It discusses two computational approaches, one based on lattice vibrations and one on molecular dynamics. The aim is to find an explicit dependence of volume on temperature. The material investigated is magnesium oxide, a mineral with structure formula MgO. Mostly encountered in its cubic unit cell form - commonly known as Periclase -, it is suitable for theoretical investigations due to its structural simplicity. Due its hygroscopic nature, pure MgO is hardly found in nature. In contact with moisture, for example in air, MgO undergoes hydrolysis to magnesium hydroxide, Mg(OH)2. The lattice constant and volume of Mg(OH)2 is different to that of MgO, therefore any experimental measurement of magnesium oxide needs to ensure the purity of the examined material. Moisture is typically reduced by an annealing process, a heating method. Literature values for lattice constants vary according to the degree of purity, whereas the calculation in this report are bound to strictly pure MgO.
Thermal Expansion
(Speculation 3)Solids expand upon heating. This is a consequence of anharmonic potentials governing the vibrational motion of atoms. In any vibration, the time average of the internuclear distance gives the equilibrium bond distance. In an anharmonic potential like the Lennard-Jones potential, compression demands more energy than extension. As a consequence, it is more likely to find elongated bonds than compressed bonds. The time average of such a system exhibits lengthened equilibrium bond lengths compared to those found in a harmonic potential. The potential energy of elongation converges, while the one of compression increases indefinitely, thus this behaviour is more pronounced at higher energies. Therefore, higher vibrational energy levels favour longer equilibrium bond lengths. In a system past the thermodynamic limit, this temporal average is always fulfilled, leading to thermal expansion.
This phenomenon is entirely due to anharmonic potentials. In a harmonic potential, the equilibrium bond length would not change with the vibrational energy level, so thermal expansion would be impossible. As the Lennard-Jones potential is computationally expensive, the Buckingham potential was chosen as an alternative:
, where a, b and c are material-dependent constants and r is the interatomic separation.[1] It should be noted that both the Lennard-Jones potential and the Buckingham potential were developed in the study of rare gases and are fitted here to suit ionic interactions.
It substitutes the short-range repulsion term with an exponential term. While generally accurate, the exponential converges at very low distances. Thus, the potential exhibits a "turning point" at which the attractive contribution overcomes the repulsive ones, resulting in unphysical behaviour at very low interatomic distances. However, if this difficulty is respected, the Buckingham potential is a viable alternative to the expensive Lennard-Jones potential.[2]
To further reduce computational effort, the potentials are approximated by quasi-harmonic potentials. While the initial interatomic distance is calculated as part of the Buckingham potential, any small-scale deviation is approximated by a parabolic potential. This approximation is valid as any potential being treated by a Taylor expansion to 2nd order takes the form of a parabola. As only small deviations from this intial distance are expected, this is acceptable.
The resulting change in volume is then given implicitly by: , where V0 is the initial volume of the substance at 0K. The thermal expansion coefficient, α, shows a functional dependence on T. Thus, the change in volume can be obtained by integration:
Phonons & Lattice Vibrations
For any given non-linear molecule, the number of vibrational modes is 3N-6, where N equals the number of atoms participating. Thus in a crystal of bulk dimensions, an almost infinite amount of vibrational modes can be found and a simple additive computation is rendered futile. However, by applying the periodic boundary conditions given by a periodic lattice, lattice vibrations can be described as quasi-particles, phonons. Phonons are quantified by their wavevector, k, which represents the periodicity of in-phase and out-of-phase contributions across the entire lattice. As a consequence of this, as the lattice dimensions approach the thermodynamic limit, the lattice vibrations converge towards continuous bands. The correlation of phonons to the (three-dimensional) wavevector k is called a dispersion relation. For reasons of legibility, the three-dimensional function is unraveled into a two-dimensional graph. This graph illustrates how the phonon structure of the material changes in k-space by fixing a k-point and showing the (two-dimensional) change introduced by travelling to another significant k-point. Thus, all degrees of freedom are sampled on a two-dimensional graph. The total number of bands found in a dispersion relation is given by the product of the number of degrees of freedom and the number of different entities present in the crystal - in the case of MgO, three spatial dimension are evaluated containing two different types of atoms, giving six bands. Bands can coincide to form degenerate bands. The lowest bands of frequencies (mostly in-phase contributions) are called acoustic bands, all others optic bands. For every degree of freedom, exactly one acoustic band can be found.[3]
The density of states function (DOS) gives the occurrence of a phonon against its frequency. It therefore shows the probability of finding a phonon of a given frequency when a phonon is chosen randomly. The DOS integrates to the number of bands present in the sample. As the DOS is a continuous function, any computational investigation based on a finite amount of sampling points is limited in its accuracy. Every evaluation of the DOS is bound to make a compromise between accuracy and computational effort.
Molecular Dynamics
Molecular Dynamics provide an alternative approach to the calculation of vibrations in a solid. The temporal evolution of a system is calculated by strictly applying Newton's laws. Thus, MD calculations are limited by classical physic; quantum mechanical effects such as tunneling or quantum uncertainty are unaccounted for. For every atom in the system, an initial position and momentum is given. According to deterministic physics, the temporal evolution of the system is hereby uniquely defined. The progression of the system is computed stepwise, by integrating Newton's laws over a small timespan dt. The choice of dt is crucial in the calculation. A too low timeframe will increase the computational demand, while a long timestep will reduce accuracy and introduce aliasing problems. An MD calculation evaluates all properties of a system and can typically not be restricted to just a single feature in question. Therefore, MD calculations produce a large amount of superfluous information and are generally very computationally expensive. In order to extract the desired information from an MD simulation, the system is allowed to equilibrate via a number of equilibrium steps. The following production steps are averaged to generate a meaningful estimate of a property. In the case of the thermal expansion of MgO, the interatomic positions are averaged to obtain an equilibrium bond length, once the system has reached thermal equilibrium.[4]
Methods
General Utility Lattice Program
All calculations reported were performed using the General Utility Lattice Program (GULP) in a DLVisualise environment. If not stated otherwise, all calculations were conducted using Buckingham potentials without shells. In all cases the pressure was fixed at zero GPa in order to eliminate any pressure driven contributions to the crystal volume. The MgO crystal investigated is an isolated system, all energy found in the system is either contained in thermal motion - kinetic and potential energy - or in the zero-point energy. Temperature adjustments therefore directly modify the average kinetic energy contained in the system, as heat cannot dissipate.[5][6][7][8]
Discussion
An initial calculation on MgO
An original structure of a cubic MgO unit cell was generated. The cell contains a total of 2 magnesium and oxygen atoms each. The lattice parameter is set to 4.212E-10 m. A single point calculation was conducted, yielding a lattice energy for the unit cell of -3963 kJ/mol. This model shall be the starting point for all subsequent calculations.
Calculating the Phonon Modes of MgO
A comprehensive study of vibrational modes is required to simulate the relationship between accessible vibrational energy levels and temperature, which allows the study of thermal expansion. Thus, the dispersion curve for a convential unit cell of MgO was calculated (50 sample points). 6 bands can be observed at any point in k-space, corresponding to two different atoms vibrating in three independent spatial directions. At a number of points along the line of k-space, these bands combine however to form degenerate energy levels - at point Γ, for instance, the top band corresponds to one energy level, the middle band combines two energy levels and the bottom band three.
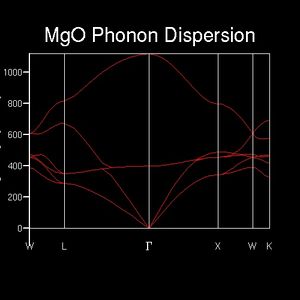
The energy of a phonon directly relates to the amount of in-phase vibrational contributions. This result can be seen in an animation of the phonon. While the lowest energy phonons cause all atoms to move into one uniform direction - not an actual vibration, but rather a translation - the higher energy photons cause opposing movements in neighbouring atoms.
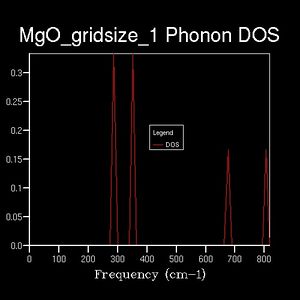
While informative, the information found above may be extracted in a more economic fashion. The DOS is an alternate representation of the dispersion relation which simply counts the number of k-points featuring vibrations of a specific energy. However, as an average quantity it is strongly dependent on a sufficient sampling resolution. An initial DOS was computed over a 1x1x1 grid of k-points. 4 vibrational modes are found at this single k-point, of which the first two - energies of about 290, 350 cm-1 respectively - exhibit twice the occurence of the remaining two peaks - energies of about 690, 710 cm-1 respectively. This indicates that twice the amount of bands are present at energies 290 & 350 cm-1 than at 690 & 710cm-1. (Question 1)The dispersion relation shows that 4 bands in this energy region degenerate into 2 at point L. Furthermore, two single bands can be found at the higher energies specified above. Therefore, the DOS sampling wavevector is L. The k point is identified in the log file as 0.5, 0.5, 0.5, which corresponds to the label L. The total integral is normalised to equal the number of bands present. From this example it can be seen that the DOS simply takes the dispersion relation as its argument and counts the occurrence of each data point.
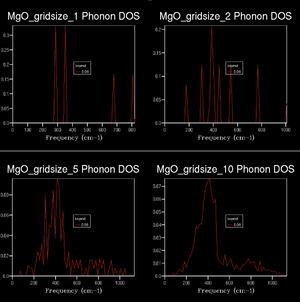
(Question 2)Extending the shrinking factor to 2x2x2 reveals a more detailed DOS. The sum over all peaks is again 6, but the maximum intensity decreased. In other words, the sharp peaks observed were spread out more evenly. This trend continues as the grid dimensions increase, approaching a continuous function. The dispersion relation indicates that - within the resolution limits of the calculation - the energy is continuous and strictly non-zero with respect to the wavevector. A realistic DOS therefore should show non-zero probabilities at each data point within the energy limits. (Question 3 & 4) This behaviour is approximated from a grid size of 8x8x8 onwards. Any grid smaller than this shows a non-continuous DOS, which is unphysical. A higher gridsize shows a more rich, detailed function. Typically, strong maxima and minima are evened out across the range of the function. Higher gridsizes generally reduce the height of single peaks, distributing area across the whole range.
10s was set as a time limit for subsequent calculations, based on the fact that no chained calculations are performed, which would need to be based on a high accuracy base calculation. On the other hand, a high number of serial calculations will be conducted, which benefit from a reasonable computational time. The computational effort for a number of grid sizes (below) was investigated and the optimum grid size for a time constraint of 10s was found. Therefore the optimum grid size was set to 26x26x26.
| Grid size3 | Time / s |
|---|---|
| 10 | 0.26 |
| 20 | 3.0 |
| 30 | 17 |
| 25 | 8.2 |
| 27 | 11 |
| 26 | 9.1 |
(Speculation 1)The computational power required to calculate the DOS with a given grid is dependent on the number of bands in k-space. The number of bands itself is influenced by the degrees of freedom introduced by different atoms and the general complexity of the unit cell. Thus, a crystal of similar complexity as MgO (such as CaO) is treated appropriately by the above optimum grid size. A more complex assembly, such as a zeolite, however would require much more computational effort for the same grid detail than MgO, so the optimum grid size will decrease (in order to compensate for the raised computational effort). Similarly, a simple species such as mono-atomic lithium allows for the calculation of much more accurate grids in the same amount of time, so the optimum grid size rises.
Computing the Free Energy - The harmonic approximation
An exact solution for the free energy requires the calculation of an almost infinite amount of terms. Computationally, this poses a problem as a only a finite number of terms can be calculated. It is therefore necessary to relate the accuracy of a computation to its computational expenses and sample accordingly. The quasi-continuous distribution of k-labels across bands is approximated by sampling a finite number of k-terms. As the number of terms increases, the function converges, but the computational effort rises. The calculation of a Phonon DOS at 300K was conducted, sampling various grid sizes:
| Grid size3 | Free energy / kJ/mol | Free energy / eV | Free energy difference to convergence / eV |
|---|---|---|---|
| 1 | -3949.15 | -40.9303 | -3.81800E-3 |
| 2 | -3948.79 | -40.9266 | -1.26000E-4 |
| 3 | -3948.78 | -40.9264 | +5.10000E-5 |
| 4 | -3948.78 | -40.9265 | +3.30000E-5 |
| 5 | -3948.78 | -40.9265 | +2.00000E-5 |
| 6 | -3948.78 | -40.9265 | +1.20000E-5 |
| 7 | -3948.78 | -40.9265 | +8.00000E-6 |
| 64 | -3948.78 | -40.9265 | 0 |
All the above calculations were completed in less than one second. (Question 5)The values clearly converge against a limit. Evaluating 6 significant figures, convergence is achieved already in the fourth instance corresponding to a grid of 4x4x4. The free energy approaches its final value initially from below, overshoots minimally and then tends towards the limit from above. The function converges very quickly with increasing grid size, but it should be remembered that the number of sampling points increases non-linearly with grid size. The largest computable grid size is taken to be an accurate representation of reality (64x64x64). Therefore, the accuracy of the above calculations will be computed by considering the deviation from this reference value. (Question 6) It is evident that already a grid size of 2x2x2 is sufficient for a calculation accurate to 0.5 meV and a grid size of 3x3x3 is accurate enough for considerations of 0.1 meV.
(Speculation 2)The applicability of the optimum grid size to other materials shows similar features as the optimum grid size in the section above. The accuracy of the calculation suffers from complex band structures. In order to still fullfil the 0.1 meV threshhold, more complex assemblies (such as zeolites) will require larger grid sizes - the opposite is true for simple crystals like lithium. In addition to an argument about the number of bands however, the range of frequencies covered is also an important factor. Given that the frequency of vibration is lower for higher mass objects, the range of energies covered by the dispersion relation is wider for lighter materials. Again, a material similar to MgO, such as CaO, will show a very similar optimum grid size. Ca atoms are slightly heavier than Mg atoms and will therefore show a more narrow energy range, which may lower the amount of sampling points required minimally.
The thermal expansion of MgO
In order to obtain the change of volume with temperature, the volume must be sampled over a range of temperatures. The volume at any given temperature is calculated by an optimisation of the Gibb's free energy. From the calculation above it can be seen that a gridsize of 7x7x7 allows for an accuracy of 10-5 eV, while still providing fast computation times (<1 second). This grid will be taken as a default for the following calculations. Calculations of the DOS were conducted at a range of temperature from 0K to 1000K.
| Temperature / K | Free energy / eV | Lattice constant / Angstrom |
|---|---|---|
| 0.0000 | -40.902 | 2.9866 |
| 100.00 | -40.902 | 2.9866 |
| 200.00 | -40.909 | 2.9876 |
| 300.00 | -40.928 | 2.9894 |
| 400.00 | -40.959 | 2.9917 |
| 500.00 | -40.999 | 2.9942 |
| 600.00 | -41.049 | 2.9969 |
| 700.00 | -41.107 | 2.9997 |
| 800.00 | -41.172 | 3.0026 |
| 900.00 | -41.243 | 3.0057 |
| 1000.00 | -41.3198 | 3.0089 |
These values clearly deviate from empirical literature values (4.211 - 4.212 E-10 m at 298 K, ambient pressures [9]). This corresponds to an error of about 1.2E-10 m.
(Question 7, 8 & 9) Both the free energy and the lattice parameter diverge with temperature. The energy falls in a non-constant fashion, whereas the lattice parameter rises non-constantly. Indeed, the magnitude of both gradients monotonically increases over temperature. The behaviour of free energy is unphysical, as increased temperature adds additional energy to the system. Clearly, the energy of the system should rise with increasing temperature.


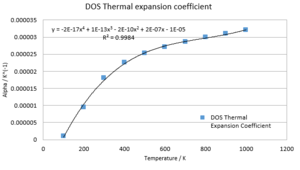
(Question 10)The intial volume V0 is given by the optimised volume at temperature T = 0K, whereas the gradient of the volume with temperature can be approximated by ΔV/ΔT. Thus α may be plotted against temperature and a function fitted. An exceptional fit can be obtained with a fourth order polynomial:
This thermal expansion coefficient allows for the explicit calculation of volume with respect to temperature:
(Question 12)The observed inaccuracies may be caused mainly by three approximations: The potential used to calculate the atomic interactions, the quasi-harmonic approximation and approximations due to computational limitations. The computational limitations were addressed above. In order to certify that a gridsize of 7x7x7 did not introduce a significant error into the calculation, an optimisation with gridsize 25x25x25 was conducted:
| Temperature / K | Free energy / eV | Lattice constant / Angstrom |
|---|---|---|
| 0.0000 | -40.902 | 2.9866 |
These values are - within the limit of 5 significant figures - exactly equal to those calculated with a grid of lower accuracy. Therefore the computational limitation does not introduce a significant error into the calculation.
The Buckingham potential is a simplified alternative to the more elaborate Lennard-Jones potential. Modelling close range interactions via an exponential term, repulsive contributions are frequently underestimated. This would lead to a shrinkage of the the interatomic distance in the lattice parameter, which is observed in the results. Therefore, the choice of potential is the main approximation in this calculation. The quasi-harmonic potential is a well established approximation for any potential. It represents a Taylor expansion of the original potential in which only the terms until second order are retained. Second order approximations introduce little error and are unlikely to introduce relative errors of about 0.25, as seen above.
In order to explain thermal expansion conceptually, one can employ a number of reasons. The simplest argument follows from an analogy of gases. Gases are subject to an external pressure, which sets its volume at a given temperature. Additional thermal energy allows the molecules to exert a higher outward pressure, thereby shifting the equilibrium to a higher volume. However, solids are nigh incompressible, rendering this argument invalid. Furthermore, all calculations were conducted in the absence of pressure, which indicates a mechanism for thermal expansion independent of external pressures.
For a given crystal at 0 K, only the first vibrational energy level is occupied. As thermal energy rises, more energy levels will be populated. Higher vibrational levels cause more widespread oscillations around the equilibrium bond length. Anharmonic potentials, such as the Buckingham potential (and others, e.g. Lennard-Jones or Morse) show that for a vibration of a given vibration, more energy is required to compress the bond than to expand it. Thus, the average bond length lengthens for higher vibrational levels. For a crystal in the thermodynamic limit, this average will always be fulfilled, resulting in an expansion at higher temperatures.
(Speculation 5)This shows that the expansion of a solid is a feature of anharmonic potentials. In a perfectly harmonic potential the average bond length does not change with the vibrational level, as compression is as likely as extension. Therefore, purely harmonic potentials are unsuitable for the calculation of thermal expansion. Quasi-harmonic approximations, while calculating phonons harmonically to save computational time, retain the original position of the lattice constant on an anharmonic potential, allowing the calculation of temperature dependent properties.
(Speculation 4) Further errors are introduced in the limit of high temperatures. Phonons are calculated on the basis of periodic boundary conditions. As atomic vibrations increase, this background potential becomes less applicable. In the fusion limit this approximation fully breaks down, as all positional order is lost. Moreover, all potentials behave similarly at low extensions (i.e. low temperatures) and can be approximated by harmonic potentials. As temperature rises, the inaccuracies introduced by simplified potentials are amplified as anharmonic effects become dominant. Furthermore, the Buckingham potential exhibits a "turning point" at very low interatomic distances, in which all interactions become attractive. If the temperature is high enough, such distances will become accessible, introducing unphysical properties into the system.
Molecular Dynamics
Molecular Dynamics provides an alternative approach to the calculation of lattice vibrations. The temporal evolution of MgO in the range of 0 - 1000K was investigated, allowing 500 equilibration and 500 production steps at a timestep length of 1 fs. (Speculation 5)The dependence of the DOS accuracy on the gridsize directly relates to the size of the unit cell in the MD calculation. As the DOS was found to converge in the meV region for a grid of dimensions 4x4x4, containing 64 sampling points, a minimum cell size of 64 sampling points is needed. This is realised by choosing a supercell containing 64 atoms, or 32 formula equivalents of MgO. All systems equilibrated to within 1K of the target temperature over a range of more than 10 equilibrium steps, which was deemed appropriate. As an MD simulation cannot be conducted at very low temperatures due to a requirement of minimum kinetic energy, the initial system was calculated at 15 K. The initial volume needed to calculate α was taken as the volume at 15K.
| T / K | Energy per formula unit / eV | Lattice constant / Angstrom | Volume per formula unit / Angstrom3 | Alpha / 10-5 K-1 |
|---|---|---|---|---|
| 14.976 | -41.069 | 4.2125 | 18.689 | 0 |
| 99.927 | -41.016 | 4.2141 | 18.735 | 2.8737 |
| 199.97 | -40.972 | 4.2159 | 18.789 | 2.8915 |
| 299.79 | -40.922 | 4.2179 | 18.841 | 2.7807 |
| 399.64 | -40.869 | 4.2206 | 18.894 | 2.8636 |
| 449.49 | -40.813 | 4.2232 | 18.948 | 2.8636 |
| 599.48 | -40.766 | 4.2321 | 19.005 | 3.0937 |
| 699.81 | -40.706 | 4.2386 | 19.065 | 3.1999 |
| 800.24 | -40.656 | 4.2468 | 19.128 | 3.3465 |
| 900.68 | -40.600 | 4.2552 | 19.189 | 3.2630 |
| 1000.59 | -40.5438 | 4.26100 | 19.2386 | 2.64430 |
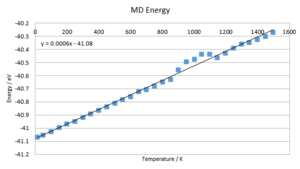
The energy rises almost linearly with temperature. The gradient is very close to 3KbT, which indicates that the additional energy introduced into the system is due to additional thermal energy introduced by higher temperatures. This behaviour is much more appropriate than the falling free energy found in the DOS calculation. The lattice constant too rises with temperature and suggests one of two functional dependences: Either a second degree or higher, even degree polynomial fit or a compound linear fit. Both are likely and based on the magnitude of the error anticipated in this calculation, none of the two can be confirmed.
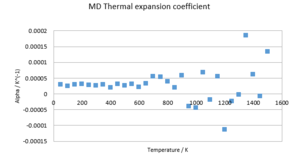
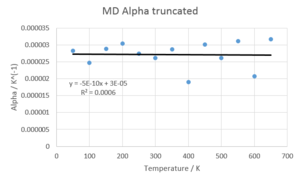
α shows a much more complicated dependence on temperature than in the DOS. However, as the investigated value is very small and sensitive to perturbations, a number of fits can be imagined. Firstly, a linear fit proves reasonable, indicating an almost constant value of 3E-5 K-1. However, also higher-order polynomials are possible. Given the current amount of data, an exact distinction cannot be made.
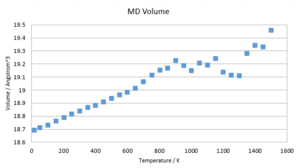
In order to confirm the data found above, a second run of MD was conducted with 5000 equilibration and 5000 production steps over a range of 15-1500K in steps of 50K. The temperature equilibrated to within two decimal places in all cases. The above results were confirmed. Additionally, the thermal expansion coefficient was determined to be linear within 15-700K. However, the deviation found is too substantial to warrant an exact solution for α. The range of data points in the region of 15-700K is in the region of 2-4E-5 K-1, which agrees with literature values.[10] The obvious errors at higher temperatures may be due to a demand for further equilibration & production steps to warrant the right accuracy. Moreover, a bigger sample cell might be needed to account for vibrations that extend beyond the sample points considered. Furthermore, even though MD proves more accurate at high temperatures than DOS, missing boundary conditions become more significant at higher temperatures.
| T / K | Energy per formula unit / eV | Lattice constant / Angstrom | Volume per formula unit / Angstrom3 | Alpha / 10-5 K-1 |
|---|---|---|---|---|
| 14.998 | -41.068 | 4.2124 | 18.689 | 0 |
| 50.001 | -41.050 | 4.2139 | 18.708 | 2.818 |
| 100.003 | -41.024 | 4.2149 | 18.731 | 2.475 |
| 149.998 | -40.9983 | 4.2168 | 18.758 | 2.876 |
| 199.998 | -40.9718 | 4.2203 | 18.786 | 3.044 |
| 250.002 | -40.9449 | 4.2240 | 18.812 | 2.742 |
| 299.993 | -40.9196 | 4.2242 | 18.836 | 2.609 |
| 350.036 | -40.8907 | 4.2272 | 18.863 | 2.874 |
| 400.032 | -40.8675 | 4.2290 | 18.881 | 1.906 |
| 450.027 | -40.8397 | 4.2311 | 18.909 | 3.010 |
| 499.995 | -40.8104 | 4.2316 | 18.933 | 2.610 |
| 550.022 | -40.7849 | 4.2371 | 18.963 | 3.108 |
| 600.026 | -40.7600 | 4.2364 | 18.982 | 2.073 |
| 650.128 | -40.7243 | 4.2455 | 19.012 | 3.171 |
| 700.065 | -40.7069 | 4.2461 | 19.063 | 5.491 |
| 750.011 | -40.6803 | 4.2499 | 19.113 | 5.356 |
| 799.977 | -40.6515 | 4.2328 | 19.150 | 3.915 |
| 850.005 | -40.6290 | 4.2426 | 19.168 | 1.972 |
| 899.988 | -40.5576 | 4.2869 | 19.223 | 5.854 |
| 950.014 | -40.4947 | 4.2241 | 19.185 | -4.044 |
| 999.9662 | -40.47456 | 4.2734 | 19.143 | -4.519 |
| 1050.0983 | -40.43306 | 4.1957 | 19.206 | 6.771 |
| 1100.0900 | -40.43537 | 4.2548 | 19.189 | -1.84 |
| 1149.9074 | -40.4628 | 4.2630 | 19.239 | 5.437 |
| 1199.9618 | -40.4308 | 4.2470 | 19.133 | 11.42 |
| 1249.9984 | -40.39063 | 4.272 | 19.110 | -2.439 |
| 1300.1130 | -40.35994 | 4.2401 | 19.107 | -2.669 |
| 1349.9782 | -40.34694 | 4.2720 | 19.280 | 18.44 |
| 1400.0155 | -40.32522 | 4.2851 | 19.336 | 6.115 |
| 1449.8232 | -40.30488 | 4.2776 | 19.329 | -8.057 |
| 1499.9895 | -40.27294 | 4.2854 | 19.454 | 13.40 |
Comparison of Models
(Question 12)A comparison of the volume change with temperature in the two models shows two graphs of very similar shape. Both appear linear with temperature, however the quasi-harmonic model shows signs of non-linearity. Both models are diverging with temperature. The DOS data is strictly higher than the MD data. (Questions 13 & 14)The thermal expansion factors of the two models show significant differences. While the DOS predicts a converging behaviour of coefficient, MD suggests a linear function. The phonon model suffers from increased inaccuracies at high temperatures due to approximations made to the anharmonicity of the potential, whereas the MD model neglects quantum effects, which show the highest impact at low temperatures. It is therefore sensible to apply the two models in different temperature ranges. Studies close to zero Kelvin benefit from DOS calculations, while those close the melting point should be conducted by MD.
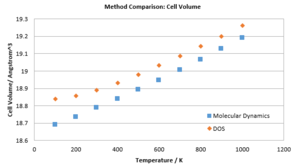
(Speculation 6)The DOS model reaches its limits close to the melting point. As all positional order is lost, no equilibrium bond lengths can be defined. However, the anharmonic potential dictates an infinite increase in equilibrium bond length at energies past the dissociation energy. A rapid in volume would be the result, which is unphysical. MD calculations will prove much more reliable, as the concepts of positional order and in general the association of two specific atoms are not contained within an MD simulation. Instead, the free flow of ions can be approximated. However, additional boundary conditions would need to be introduced in such an experiment, as liquids are not confined to a specific volume, like solids are. Otherwise, ions which have overcome the attraction of all other ions would distance themselves infinitely far from the system, which is unphysical. These boundary conditions could be realised in the form of a "system in a box model", in which the spatial spread of ions is quenched by an infinite "outside" potential.
Comparison with literature
A large amount of experimental data was collected concerning the thermal expansion of MgO.
A collection of 26 data sets under different purification conditions at 298K reveals a lattice constant of 4.211 - 4.212 Angstrom for MgO[9]. While introducing a relative error of about 0.25 in the DOS model, the MD calculation is accurate to three significant figures.
| Literature value / Angstrom | DOS value / Angstrom | MD value / Angstrom |
|---|---|---|
| 4.211 - 4.212 | 2.9894 | 4.2179 |
(Question 11)Experimental data for α is found to be increasing quickly over a temperature range of 0-500K, then seemingly converging.[11] This behaviour is met by the DOS model, but not by the MD calculation. Both models undershoot slightly, even though the literature value was recorded at ambient pressures instead of 0GPa (as in this calculation). Further experimental values suggest α to be essentially linear with temperature over a range of 80-1000K.[10] The values range between 2 - 4E-5 K-1, which is met by the calculations in this report. Finally, experimental material suffers from impurities and defects, which care not accounted for in the present model.
Conclusion
The thermal expansion of MgO was analysed via a lattice vibration and a molecular dynamics model. The MD model shows very accurate lattice constants and volumes, which is met by experiment. However, the thermal expansion coefficient suffers from inaccuracies, which prevent an exact solution of α. The DOS model, while showing high relative errors for lattice constants, shows a fourth order function for the thermal expansion coefficient, which may obscure a more simple underlying functional dependence. The range of the predicted thermal expansion coefficients is met by literature values.
The main approximation in this calculation is the potential used in the DOS calculation. It can clearly be seen that significant differences exist both in the comparison with MD values as with reference values. It is sensible to conduct further calculations using more expensive models to establish whether the error in the calculation is caused by the Buckingham potential and if so, how much of the inaccuracy it accounts for. As such calculations are expensive, a number of random samples could be taken to estimate the error introduced by the potential. If the more expensive potential rectifies a significant amount of error, then all calculations could be repeated with this new model.
In order to rectify the errors in the MD calculation, an increased sample cell will be worth investigating. As a lack of equilibration steps was already investigated and did not reveal any significant improvement, accuracy may be improvable by a larger sample cell.
References
- ↑ R.A. Buckingham, The Classical Equation of State of Gaseous Helium, Neon and Argon, Proceedings of the Royal Society of London. Series A, Mathematical and Physical Sciences 168 pp. 264-283 (1938)
- ↑ F. Jensen, Introduction to Computational Chemistry, 2nd ed., Wiley, 2007
- ↑ G.P. Srivastava: The Physics of Phonons, CRC Press, 1 Jan 1990
- ↑ G.D. Billing, K.V. Mikkelsen: Introduction to Molecular Dynamics and Chemical Kinetics, John Wiley & Sons Inc, 1996
- ↑ J.D. Gale, GULP - a computer program for the symmetry adapted simulation of solids, JCS Faraday Trans., 93, 629 (1997)
- ↑ J.D. Gale, Empirical potential derivation for ionic materials, Phil. Mag. B, 73, 3, (1996)
- ↑ J.D. Gale and A.L. Rohl, The General Utility Lattice Program, Mol. Simul., 29, 291 (2003)
- ↑ B.G. Searle, Computer Physics Communications, 137, p. 25 (2001)
- ↑ 9.0 9.1 Reeber, R. R., Goessel, K., & Wang, K. (1995). Thermal expansion and molar volume of MgO, periclase, from 5 to 2900 K. European Journal of Mineralogy, 7(5), 1039-1047.
- ↑ 10.0 10.1 Smith, D. K., Leider, H. R. (1968). Low-temperature thermal expansion of LiH, MgO and CaO. Journal of Applied Crystallography, 1(4), 246-249.
- ↑ Y. S. Touloukian, R. K. Kirdby, R. E. Taylor, and T. Y. R. Lee, Thermophysical Properties of Matter, Plenum, New York, 1977, Vol. 13
