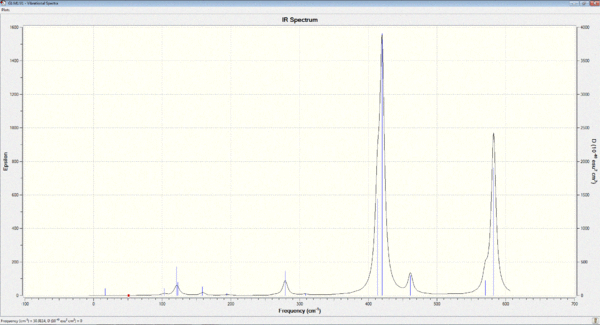
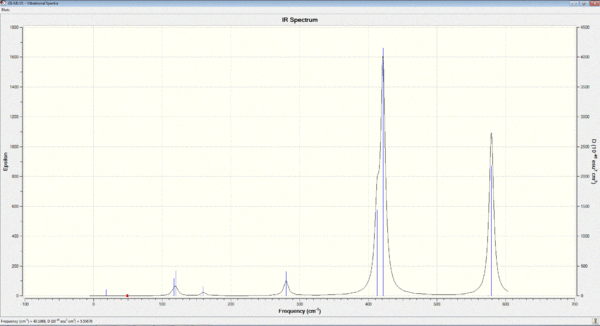
Rep:Mod:bei1994
3rd Year Computational Lab - Inorganic module - Week 1
BH3
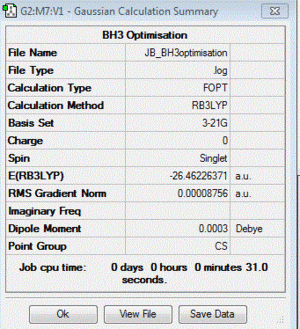
B3LYP/3-21G level
Optimisation log file here
B3LYP/6-31G level
Optimisation log file here
| summary data | convergence | Jmol | |||
|---|---|---|---|---|---|
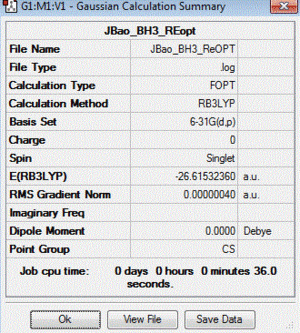
|
Item Value Threshold Converged? Maximum Force 0.000001 0.000015 YES RMS Force 0.000000 0.000010 YES Maximum Displacement 0.000005 0.000060 YES RMS Displacement 0.000003 0.000040 YES |
|
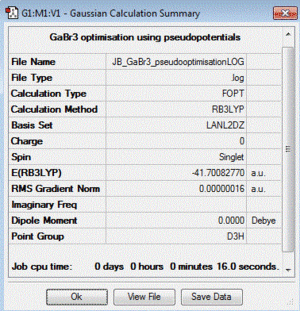
GaBr3:B3LYP/LANL2DZ
optimisation file: DOI:10042/85069
| summary data | convergence | Jmol | |||
|---|---|---|---|---|---|
|
Item Value Threshold Converged? Maximum Force 0.000000 0.000450 YES RMS Force 0.000000 0.000300 YES Maximum Displacement 0.000003 0.001800 YES RMS Displacement 0.000002 0.001200 YES |
|
BBr3:B3LYP/6-31G(d,p)LANL2DZ
optimisation file: DOI:10042/85057
| summary data | convergence | Jmol | |||
|---|---|---|---|---|---|

|
Item Value Threshold Converged? Maximum Force 0.000013 0.000450 YES RMS Force 0.000006 0.000300 YES Maximum Displacement 0.000058 0.001800 YES RMS Displacement 0.000029 0.001200 YES |
|
Geometry Comparison
| BH3 | BBr3 | GaBr3 | |
|---|---|---|---|
| r(E-X) Å | 1.19 | 1.93 | 2.35 |
| θ(X-E-X) degrees(º) | 120.0 | 120.0 | 120.0 |
Interpretation of results:
1) In changing the ligand from H to Br, the E-X bond length increases significantly. This can be attributed to the difference in covalent radii (size) of H and Br atom. This is because the length of a covalent bond is approximately equal to the sum of the covalent radii of the 2 atoms, so larger ligand atoms would give a longer bond. It can also be explained by the fact that the valence orbital of H (1s) is much more penetrating and compact than that of Br (4p), and hence can get closer to the B atom, giving a shorter bond distance. Also, s-p overlap is stronger than p-p overlap, so B-H bond is stronger and therefore shorter than B-Br.
In this case, the 2 ligand atoms are similar as they both have 1 valence electron to be used in bonding. This means the difference in bond length is not due to changes in bond order. This is shown here as the bond angle did not change on changing from H to Br.
2) In changing the central atom from B to Ga, bond length has increased considerably. B and Ga are both in Group 13, so they can be expected to form similar structures in term of number and connectivity to ligand atoms. Indeed, this is shown here as the bond angle and the geometric arrangement of ligand around central atom did not change.
However, Ga is further down the Group than B (Period 4 compared to Period 2) and thus has much larger and more diffused valence orbital, which overlaps less well with that of Br. Also, treating these 2 bonds as primarily covalent, the atomic radius of Ga is larger compared to that of B. Therefore, bond length increases owing to these 2 factors.
Both of these examples follow the trend that bond length increases down a Group and increase going from left to right across a period, corresponding to the trend of atomic radii.
The concept of a bond can be seen as the electrostatic attraction between electrons and the nuclei when 2 atoms are positioned near each other. Here the mutual attraction of electrons to the 2 nuclei forms a strong interaction. And, this sharing a pair of electron between the 2 atoms are often described as a covalent bond. On the hand, electron transfer can occur between the 2 atoms, creating a pair of oppositely charged ions that are bound by the virtual of their attraction. In this case, the bond is described as being ionic. It must be noted that "covalent" and "ionic" are 2 extremities of the spectrum in describing chemical bonds. In reality, the nature of a bonds is a mix of ionic and covalent character. The relative proportion of ionic to covalent character is strongly dependent on the species of interest, and plays a huge part in determining their properties and reactivities.
Other types of bonds also exist outside the typical covalent/ionic description. For example, in diboranes and other electron-deficient Group 13 elements, a bridging hydride or halide bond can be formed (e.g. H-B-H). These are different to the normal 2c-2e single bonds in that the MO is spread across the whole internuclear space of the 3 atom centres. Therefore, they are described as 3c-2e and are very much weaker and longer than the terminal bonds on the same molecule. This is explored in more details later in the "Week 2-Project section".
A bond can be categorized into strong, medium and weak based on its bond-dissociation energy, BDE (i.e. how much energy is needed to break that bond). It should be noted that even though this is provides quantitative measure, bond strength is a relative comparison of bonding in different molecules and there is no absolute range to say what a strong bond should be. For example: A typical strong bond such as Si-O has a BDE of 452kJmol-1. In organic molecules, a C-H is considered to be strong bond and this has a BDE of 411kJmol-1. For a weak bond such as the O-O single bond, the BDE is lower at 142kJmol-1. C-N and B-B single bond are examples of bonds with medium strength, and they have a BDE of 305kJmol-1 and 293kJmol-1 respectively [1].
Gaussview may not show all of the expected bonds as it has been programmed to define a bond to be within certain distances. Thus, if the bond length exceeds this pre-set value, then it could not be shown in GaussView. Thus, for some weak bonds with long bond length and for other types of bonds with longer range interactions, Gaussian may present this as having no bonds at all.
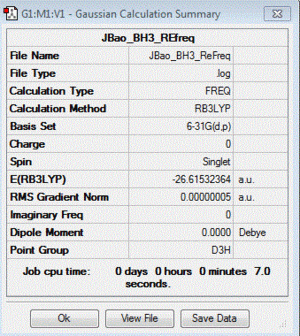
BH3 :B3LYP/6-31G(d,p)
Frequency file: here
| summary data | low modes |
|---|---|
|
Low frequencies --- -9.4163 -9.4012 -0.0808 0.0002 0.5326 2.2809 Low frequencies --- 1162.9899 1213.1493 1213.1495 |
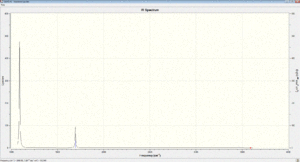
Vibrational spectrum for BH3
| wavenumber cm-1 | Intensity | IR active? | type |
| 1163 | 93 | Yes | bend (wagging) |
| 1213 | 14 | Yes | antisymmetric bend |
| 1213 | 14 | No | symmetric bend |
| 2583 | 0 | No | symmetric stretch |
| 2716 | 126 | Yes | antisymmetric stretch of 2 Br ligands |
| 2716 | 126 | No | antisymmetric stretch |
Six vibrations were find by performing Gaussian frequency analysis on the optimised BH3 molecule. However, not all of them are IR-active because: the selection rule for IR requires a change in dipole moment during molecular vibration. Therefore, for some vibrations, the dipole moments of all the atoms can effectively cancel out each other because they are moving in opposite directions. Thus, there is no net change in the dipole moment of the molecule overall.
In addition, the intensity of some vibrations can be very low, so they cannot be observed experimentally on an IR spectrum. For example, the one at 2583cm-1 has an intensity of effectively zero. Therefore, even though 6 vibrations were found computationally via Gaussian, not all of them will be experimentally observed in an IR spectrum.
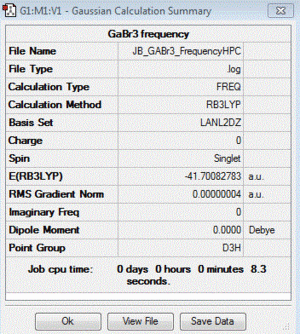
GaBr3:B3LYP/LANL2DZ
Frequency file (Gaussian): here
D-space file (HPC): DOI:10042/88075
| summary data | low modes |
|---|---|
|
Low frequencies --- -0.5155 -0.5149 -0.0024 -0.0010 0.0240 1.2053 Low frequencies --- 76.3744 76.3754 99.6984 |
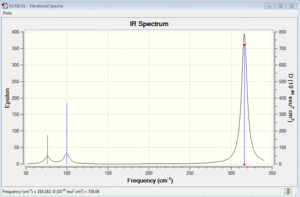
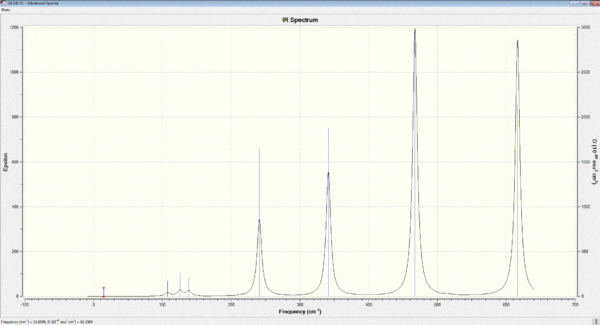
Vibrational spectrum for GaBr3
| wavenumber cm-1 | Intensity | IR active? | type |
| 76 | 3 | No | bend |
| 76 | 3 | Yes | bend |
| 100 | 9 | Yes | bend |
| 197 | 0 | No | symmetric stretch |
| 316 | 57 | Yes | anti-symmetric stretch |
| 316 | 57 | No | stretch |
Frequency Comparison
By comparison, the vibrational frequencies (ν) for BH3 is much higher than that of GaBr3. This can be rationalised by 2 factors:
A) the large difference in the reduced masses (μ) of the 2 molecules. This is because ν is proportional the square root of 1/μ. Thus, being a much heavier molecules, GaBr3 typically have lower ν.
B) In addition to this, as shown previously, the bond length of GaBr3 is almost double that of BH3, which means the Ga-Br bond is significantly weaker than BH3. Since ν is also proportional to square root of k, where k is the force constant that is indicative of the strength of the bond, a weak bond implies a low force constant, and thus low vibrational frequencies.
In addition, there has been a reordering of symmetric bending mode (A2"), the relative frequencies and intensities of this A2" umbrella motion is much larger in BH3 than in GaBr3. (1163cm-1 cf. 100cm-1 ; 93 cf. 9). This can be explained by a change in the nature of this motion: A closer look at the displacement vectors shows that the nature of the vibration has changed from the 3 H atoms being vibrating up and down the D3h plane of symmetry, to the Ga central atom being vibrating out of this plane.
This difference could be due to the fact the masses of 3 H is relatively light compared to the central B atom, making it relatively easy to carry out the umbrella motion. Whereas, for GaBr3, the Br ligands are effectively too heavy to carry out such motion as doing so would most likely result in the translational motion of the molecule all together.
Since Ga is much heavier compared to 3 Hydrogen atoms, it takes a greater amount of energy to vibrate the 3 Ga-Br bonds by moving the central Ga atom, thus, the wavenumber for this vibration is much lower in GaBr3.
It must be noted that the same method and basis set must be used for both optimisation and frequency calculations. This is because the resulting energies and structures of molecule (i.e. parameters such as bond length and bond angle) is strongly determined by the method used to obtain it and the quality of basis sets of each atom. This will in turn affect the frequency analysis because the vibrational motion of a molecule is strongly dependent upon its structure and energy, and therefore was only performed on fully optimised molecules.
Two main uses of frequency analysis in this context are:
A) it can be used to confirm that a molecule has been fully optimised - i.e. is a genuine minimum in potential energy surface as more stable structures can often create a local minimum that is not the most stable configuration overall. So, additional means (e.g. frequency calculation) of verifying minima should be used. During frequency analysis calculation, the second derivatives of PES are taken. Thus, if the resulting frequencies are all positive, then this verifies the presence of a minimum, indicative of the most stable structure.
B) it can be used to compute all of the possible vibrational modes (even those that are not experimentally observable). This provides a mean for comparing theoretical calculations with experimental IR and/or Raman spectra results.
The "Low frequencies" represent the six excluded degree of freedom of the molecule in vibrational motion, in accordance with the 3N-6 rule. This is because they are either translations due to motion of centre of mass of the molecule (which, there are 3 degrees of freedom for moving along each displacement vectors x,y,z) and rotational motions, where there are 3 degrees of freedom for molecular rotation about x, y, or z axis.
They should therefore be very small (within ±15cm-1) to distinguish vibrational modes from translational/rotational motions. These "low frequency" lines are used to throughout this course to check the quality of the method used for frequency calculations, as a better method would give values that are closer to zero because it should effectively disregard all other modes when computing specifically for the vibrational motions of the molecule.
BH3 MO analysis : B3LYP/6-31G(d,p) level
D-space file: DOI:10042/88096
Analysis:
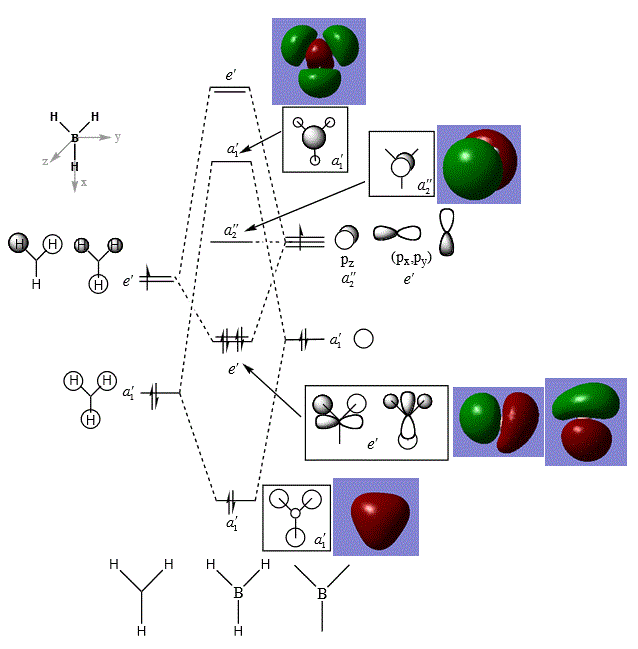
The above figure shows the comparison of computed "real" MOs with that of LCAO [2].
It can be seen that there is no significant differences between "real" MO and LCAO constructed MOs for a simple molecule of BH3 : the overall phase symmetry and shapes of MOs looked very similar. However, it should be noted that since MO essentially concerns with orbitals that are associated with the whole molecule, the LCAO method provides a slightly disjointed picture that focuses on contributions from particular atomic orbitals which are localised, whereas in fact, the "real" MO is a combined picture of atomic orbitals, and once combined, they form a delocalised electron density around parts of the molecule beyond particular atoms, OR, most often, MOs are diffused across the whole molecule. An example for this is the first a'1 MO where contributions from the three H1s orbital is delocalised across the molecule; whereas, in reality, the 3 H 1s AOs are combined to form 1 MO that is delocalised surrounding the whole molecule.
Nonetheless, LCAO is a very useful method for representing and calculating MOs qualitatively as it does not need the advance of computational chemistry. And, in the case of a simple, small molecules, this method is reasonably accurate in providing a picture about the bonding situations in the molecule (as shown in this case).
It should be noted that since unoccupied MOs are generally more diffused than occupied MOs, their shapes can be quite obscure and thus difficult to interpret. Therefore, in this module, the discussions will tend to look at the occupied and the lowest energy unoccupied MOs only.
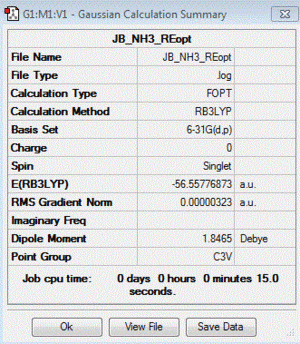
NH3: B3LYP/6-31G(d,p) level
Optimisation log file: here
| summary data | convergence | Jmol | |||
|---|---|---|---|---|---|
|
Item Value Threshold Converged? Maximum Force 0.000006 0.000015 YES RMS Force 0.000004 0.000010 YES Maximum Displacement 0.000012 0.000060 YES RMS Displacement 0.000008 0.000040 YES |
|
Frequency file: here
| summary data | low modes |
|---|---|
|
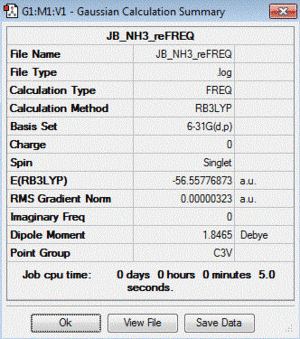
Low frequencies --- -0.0130 -0.0028 -0.0017 7.0722 8.1014 8.1017 Low frequencies --- 1089.3849 1693.9369 1693.9369 |
Vibrational spectrum for NH3
| wavenumber cm-1 | Intensity | IR active? | type |
| 1089 | 145 | Yes | bend |
| 1694 | 14 | Yes | bend |
| 1694 | 14 | No | bend |
| 3461 | 1 | No | stretch |
| 3590 | 0 | No | stretch |
| 3590 | 0 | No | stretch |
MO analysis file in D-space: DOI:10042/90101
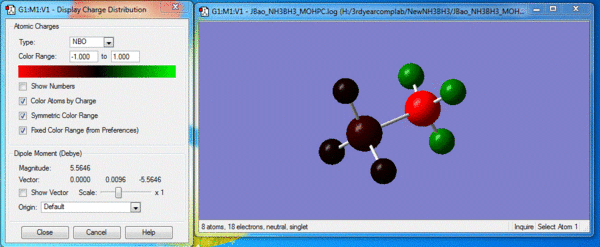
NBO analysis
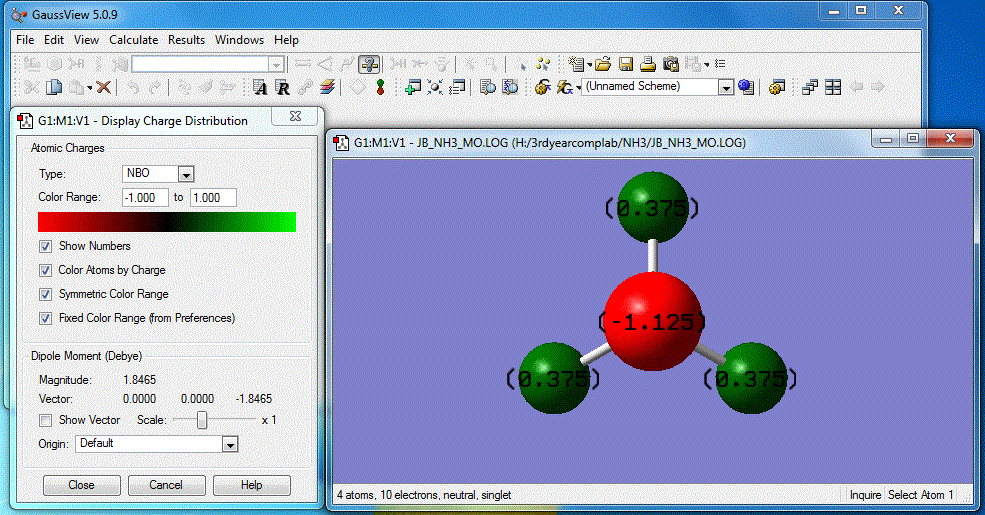
Image of charge distribution: Charge range is from -1.000 to 1.000
As shown above, the specific NBO charges for nitrogen and hydrogen atoms are -1.125 and 0.375 respectively. This can be explained by the fact N (χ=3.04) is highly electronegative compared to H (χ=2.20). This means N has a stronger pull to attract bonding electrons towards itself. Thus, with a larger electron distribution, its charge appears highly negative compared to H.
NH3 - BH3: B3LYP/6-31G(d,p) level
Optimisation log file here
| summary data | convergence | Jmol | |||
|---|---|---|---|---|---|
|
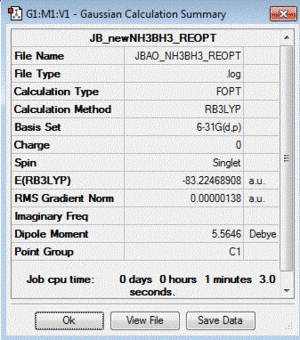
Item Value Threshold Converged? Maximum Force 0.000002 0.000015 YES RMS Force 0.000001 0.000010 YES Maximum Displacement 0.000034 0.000060 YES RMS Displacement 0.000010 0.000040 YES |
|
Frequency file: here
| summary data | low modes |
|---|---|
|
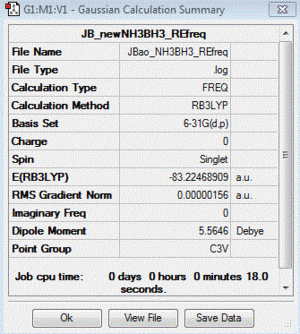
Low frequencies --- -5.8280 -0.2976 -0.0432 -0.0007 1.2533 1.3223 Low frequencies --- 263.2839 632.9559 638.4601 |
Vibrational spectrum for H3N-BH3
| wavenumber cm-1 | Intensity | IR active? | type |
| 263 | 0 | No | bend |
| 633 | 14 | Yes | stretch |
| 638 | 4 | Yes, small peak | bend |
| 638 | 4 | No | bend |
| 1069 | 41 | Yes | bend |
| 1069 | 41 | No | bend |
| 1196 | 109 | Yes | bend |
| 1204 | 3 | Yes, very small peak | bend |
| 1204 | 3 | No | bend |
| 1329 | 114 | Yes | bend |
| 1676 | 28 | Yes | bend |
| 1676 | 28 | No | bend |
| 2472 | 67 | Yes | stretch |
| 2532 | 231 | Yes | stretch |
| 2352 | 231 | No | stretch |
| 3464 | 3 | Yes,very slight | stretch |
| 3581 | 28 | Yes | stretch |
| 3581 | 28 | No | stretch |
MO analysis file in D-space: DOI:10042/90453
Analysis of bond energy
In order to determine the energy of the H3B-NH3 bond, the energy of the two dissociated fragments, BH3 and NH3 must be subtracted from the energy of the molecule. In order to compare the energies, the same calculation methods and basis set must be applied to each of the molecules.
To achieve satisfactory optimisation and frequency analysis, additional keywords were applied (integral=grid=ultrafine scf=conver=9) to the calculations for H3B-NH3.
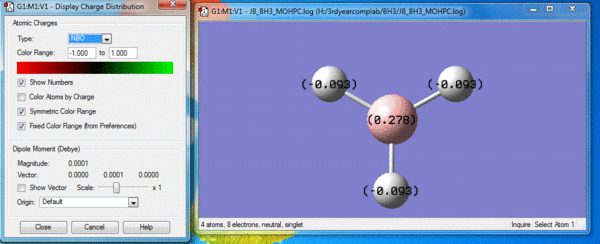
Therefore, the files and results for NH3 and BH3 on this wiki page represents an adapted calculation of optimisation and frequency analysis in an identical way to ammonia borane with these additional key words.
| molecule | energy of molecule from calculation (AU) |
|---|---|
| E(NH3) | -56.55776873 AU |
| E(BH3) | -26.61532360 AU |
| E(H3N-BH3) | -83.22468908 AU |
| ΔE= -0.0515968 AU (to 7 dp) | ΔE= 135.47 kJmol-1 (to 2 dp) |
The dissociation energy is then calculated using the formula: ΔE=E(H3-BH3)-[E(NH3)+E(BH3)].
Based on this, the B-N bond within H3N-BH3 can be considered a weak bond. For example, the C-C single bond in the isoelectronic ethane has a bond dissociation energy of 346kJmol-1 [1], and this is much less than that. When the two fragments come together, they become associated by the electrostatic attraction between N atom of the NH3 from and B of BH3. This was possible as N has a highly negative NBO charge, whereas B has a slightly positive NBO charge of 0.278. Thus, a pair of electron can be donated by N into the empty sp3 orbital of B, which can relieve some of the electron deficiency of BH3. This dative bond formed between the 2 fragments has a BDE of 135.47 kJmol-1 from the calculations shown above.
From this calculation, it can be said that this dative covalent bond formed between NH3 and BH3 is weaker than that of typical single bonds. This can be attributed to the fact that the difference in opposite NBO charges are not very pronounced as B is only very weakly positive. Therefore, as shown by the NBO charge distribution for ammonia borane, the slight positivity of BH3 fragment was insufficient at neutralizing the negative charge of the NH3 fragment, so N still remains negative with a NBO charge of -0.962 whilst the whole BH3 fragment is pretty much neutral. Hence, there's very little ionic character in the resulting molecule, which means very weak electrostatic attraction between B and N in the dative bond, giving rise to a low BDE. It can also be said that because of this differences in charges of the 2 fragments within ammonia borane, covalent bonding in the B-N bond is also weak as bonding electrons are being pulled towards electronegative N and are therefore not equally sharing between B and N. (i.e. NBO negative charge distribution remains uneven at the NH3 fragment).
However, it must be noted that the calculations carried out here can have an error of about ± 10 kJmol-1. So, taking this into account, the strength of B-N bond is actually comparable to commonly accepted weak single bonds such as I-I (151kJmol-1) and O-O (142kJmol-1).
3rd Year Computational Lab - Inorganic module - Mini Project: Lewis Acids and Bases
Introduction
It is commonly found that borane and other Group 13 elements in a planar triatomic arrangement with halides, EX3, have a strong tendency to form dimers (E2X6) driven by the relief of electron deficiency. In doing so, an interesting bonding situation occurs where the 2 monomers are linked via bridging X-E-X bonds. This mini project aims to investigate one example of such molecule - Al2Cl4Br2 by computing the energy and frequency for each of the 4 isomers to find the lowest energy conformer, and then carry out an MO analysis of that isomer.
Optimisation: B3LYP/Al, Cl: 6-31G(d,p)/Br: LanL2DZ
The Al2Br2Cl4 molecule contains both heavy atom (Br) and light atoms (Al and Cl). Thus, it was neccessary to use a mix of pseudo-potentials and full basis set in the calculations for each of the isomers and the monomer. In this case, a full basis set 6-31G(d,p) is used on Al and Cl, whilst a pseudo-potential LANL2DZ was used on Br. This was achieved by editing input files accordingly. An example is shown below:
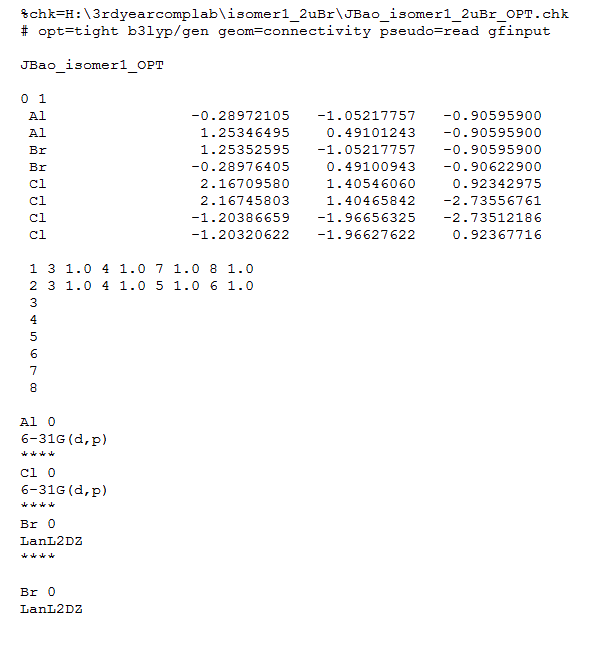
Here, the method used was B3LYP, the basis set in Gaussian was set to "GEN", which must be used to activate the option for specifying basis set of each atom. Additional keywords ( pseudo=read gfinput ) was used allow specification of the pseudo-potential used for each of the (heavy) atoms, whilst making it easier to amend mistakes by switching on a printing option.
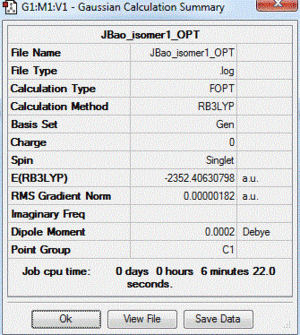
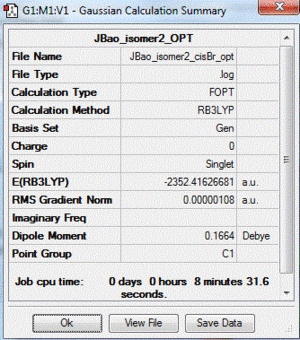
Using this method, the results for the optimisation of 4 possible isomers and the AlCl2Br monomer are shown below:
| Table of summary data | convergence lines | Image of the isomer structure (Jmol) | D-space link to files | |||
|---|---|---|---|---|---|---|
|
Item Value Threshold Converged? Maximum Force 0.000003 0.000015 YES RMS Force 0.000001 0.000010 YES Maximum Displacement 0.000038 0.000060 YES RMS Displacement 0.000014 0.000040 YES |
|
| Table of summary data | convergence lines | Image of the isomer structure (Jmol) | D-space link to files | |||
|---|---|---|---|---|---|---|
|
Item Value Threshold Converged? Maximum Force 0.000002 0.000015 YES RMS Force 0.000001 0.000010 YES Maximum Displacement 0.000023 0.000060 YES RMS Displacement 0.000009 0.000040 YES |
|
| Table of summary data | convergence lines | Image of the isomer structure (Jmol) | D-space link to files | |||
|---|---|---|---|---|---|---|
|
Item Value Threshold Converged? Maximum Force 0.000003 0.000015 YES RMS Force 0.000001 0.000010 YES Maximum Displacement 0.000003 0.000060 YES RMS Displacement 0.000001 0.000040 YES |
|
| Table of summary data | convergence lines | Image of the isomer structure (Jmol) | D-space link to files | |||
|---|---|---|---|---|---|---|

|
Item Value Threshold Converged? Maximum Force 0.000006 0.000015 YES RMS Force 0.000004 0.000010 YES Maximum Displacement 0.000012 0.000060 YES RMS Displacement 0.000008 0.000040 YES |
|
| Table of summary data | convergence lines | Image of the isomer structure (Jmol) | D-space link to files | |||
|---|---|---|---|---|---|---|
|
Item Value Threshold Converged? Maximum Force 0.000000 0.000015 YES RMS Force 0.000000 0.000010 YES Maximum Displacement 0.000000 0.000060 YES RMS Displacement 0.000000 0.000040 YES |
|
Analysis of relative energies
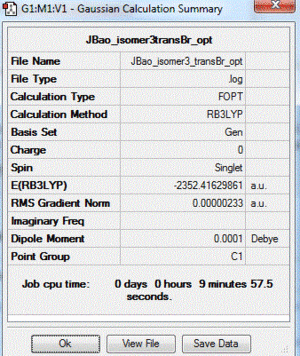
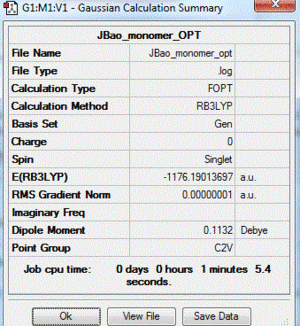
From the optimisation calculations, the energies of the 4 possible isomers were determined. However, as shown in the last column below, it is difficult to interpret the energy output from Gaussian as it is because the relative energy of 4 isomers are similar when considered in units of hatrees (AU). Therefore, to enable meaningful comparison, the lowest energy isomer was found to be isomer 3, because it has the most negative energy and thus represents the most stable configuration of the dimer. The energy difference between other isomers and isomer 3 were calculated in AU and then converted to kJmol-1 and rounded to 2 dp. This was to ensure that the errors were reflected through manipulations of data, which follows the error propagation rules for addition.
| Isomer | position of Br atoms | energy relative to lower energy isomer (isomer 3), kJmol-1 | energy (AU) as initially obtained in Gaussian |
|---|---|---|---|
| 1 | both Br in bridging bond | +26.23 | -2352.40630798 |
| 2 | both Br in terminal bonds and on the same side of the molecule (cis-) | +0.08 | -2352.41626681 |
| 3 | both Br in terminal bonds and on the opposite sides of the molecule (trans-) | lowest energy isomer | -2352.41629861 |
| 4 | 1 Br in terminal bond and 1 Br in bridging bond | + 13.65 | -2352.41109948 |
| monomer | Br and 2 Cl in trigonal planar geometry around Al | N/A | -1176.19013697 |
From these data, the following point can be made about the stability of isomer with respect to the position of the Br atoms:
A) Isomer 1 is the one with highest energy i.e. most unstable. Isomer 4 is the 2nd least stable isomer. Comparing energy difference of 1 and 4 to the lowest energy isomer and with each other, it can be said that the energy penalty from inclusion of one Br atom in the bridging bond is approximately 13 kJmol-1 as energy went up in roughly equal interval of this number from isomer 3 to 4 to 1. Thus, it can be said that the stability of isomer decreases with increasing bridging bromides.
This can be explained by:
Electronic effect: Br is further down Group 17, and has more diffused valence orbitals for bonding. Thus, overlap of Al pz orbital with lone pair containing p orbitals of Br is weaker, so bridging bonds formed between 2 monomers is weaker. This means the whole dimer molecule is less stable (as it's held together less stronger) and therefore higher in energy.
Steric effect: Br has a larger Van der Waals radii (1.85 Å)[3] being further down the Group. Using the enquiry button, the bond angle between 2 bridging atoms (Cl or Br) and Al is around 90º in each case, indicative of a highly strained system where steric effects can be especially significant to the overall stability. The distance between 2 bridging Br atoms in isomer 1 is found to be 3.57 Å, which is less than the sum of VdW radii of 2 Br atoms (185pm + 185pm = 3.7 Å). This means there is van der Waals repulsion resulting from steric clashing of the bridging Br atoms. This destabilise the molecule, giving it a higher energy.
It is interesting to see that in order to relieve some of this steric strain, the bridging bonds have been forced further apart in isomer 1, as shown by a slight increase in angle between 2 bridging bonds going from isomer 4 (90.1º) to isomer 1 (91.7º).
B) It appears that isomer 2 is marginally less stable than isomer 3. In theory, this may be attributed to possible steric clash between 2 Br atoms since dihedral angle looking along axis of the Al-Al atoms is close to zero (obtained using enquiry button and clicking on 4 atoms), indicating that 2 terminal ligands are in an eclipsed conformation. Thus, it can be said that in isomer 3, the 2 Br atoms are further apart from each other than in isomer 2, preventing any clash between them. However, in practice, the distance between 2 cis- terminal Br (found to be 5.53 Å using enquiry button) is well above that of van der waal repulsion. And, the relative energy difference of 0.08kJmol-1 lies well into the error limit of the programme. So, there is actually no distinguishable difference in stability between isomer 2 and 3.
Overall, the stability of these dimeric structure is largely dependent on the stability of its bridging bonds. Smaller halides (Cl) tends to form more stable bridging bonds than larger halides (Br) of the same Group.
The dissociation energy for lowest energy isomer can be determined by computing the energy of the AlBrCl2 monomer and using this formula: ΔE = E (isomer 3) − 2 x E(monomer)
Dissociation energy for Al2Cl4Br2 with 2 terminal trans-Br = -94.58 kJmol-1 (to 2dp)
From this, it is also possible to find the bond strength of the Al-Cl-Al bridging bond since dimerisation of 2 monomers into isomer 3 involves formation of 2 bridging bonds, thus bond dissociation energy of Al-Cl-Al is ΔE/2. This is based on the assumption that the energy of all other bonds will remain the same before and after the association, which is not strictly true as there will inevitably be some slight bond distortions during dimerisation as shown by a small change in the angle of Br-Al-Cl (see Geometry comparison section). Nonetheless, this should give a rough indication of the energy of a typical 3c-2e Al-Cl bond.
E(Al-Cl-Al) = -47.29 kJmol-1
Here, the formation of bridging bond is exothermic - thermodynamically favourable. And since no bond is broken during the dimerisation (i.e. no energy input), the release of energy from forming the bridging bonds makes the overall association of the monomer energetically favourable - a decrease in the potential energy from reactant (2 monomers) to product (isomer 3). This is supported by the dissociation energy being a negative value as this indicates that the dimer is lower in energy compared to the sum of the energy of the 2 monomer. Thus, the product is more stable than the isolated dimers as it lies in a lower minimum on the potential energy surface.
It is interesting to see that the dissociation energy here is noticeably smaller than that of a dative bond, which was computed to be around -135kJmol-1 in Week 1. This means the bridging Cl bond is very much weaker than a dative bond as it has a BDE that is less than half of the B-N dative bond. This re-iterates the point that the energy of a bond is a continuum and there are other types of (weak) bond that are non-trivial.
The lowered bond strength of the bridging Al-Cl bond can be explained by the fact that these are Three-centre, Two-electron bonds, where bonding MO of Cl-Al-Cl contains 2 electrons, and is spread across the internuclear space of 3 nuclei [4]. So, on average, there is a lower electron density between each participating atom of the bridging bond as the same number of electrons is shared between more site. And, since Coulombic attraction is proportional to square of the charge, q, lower e- charge around a nuclei implies there is less potential energy to hold the atoms in the bridging bond together via electrostatic forces.
This finding can help us to infer and rationalise certain properties of the molecule: for example, since the dimersiation process is energetically favourable with a negative dissociation energy, a dimeric structure should be expected in gaseous phase where there is no other species present to interact with monomers to stabilise it and at low temperatures where thermodynamic stability becomes dominating.
However, since the bridging bonds are weaker than dative bonds, polar solvents with good donor ability can be expected to coordinate to monomers to form dative covalent bond more favourably than self-dimerise to form bridging bonds. Hence, AlBr2Cl4 can be expected to be hygroscopic, attracting moisture in the air readily since H2O possess oxygen lone pair to be held tightly by the molecule via dative bonds, forming effectively a Lewis acid-Lewis base adduct. For this reason, the dimeric structure should exist in non-polar solvents where there's minimal ability for solvents to coordinate.
Indeed, these are analogous to some of the properties observed for similar compounds, namely AlCl3, where the dimeric structure Al2Cl6 is found in the gaseous phase and in solutions with non-polar solvent, and is also a hygroscopic substance. [5]
Additional: Geometry comparison
| molecule | θ (terminal Br-Al-Cl) degrees (º) | r (terminal Br-Al) Å | r (terminal Al-Cl) Å | r (μ Al-Cl) Å | θ ( bridging Cl to Al to terminal Cl) degrees (º) |
|---|---|---|---|---|---|
| AlBrCl2 | 120.0 | 2.27 | 2.09 | N/A | same as terminal |
| Al2Cl4Br2 | 121.5 | 2.27 | 2.09 | 2.30 | 109.9 |
Bond length and angles were found using the enquiry button, from the fully optimised structures of monomer and dimer. The key things to note were:
A) there is some distortion of the molecule during dimerisation as indicated by a small increase in bond angle between the terminal halides. This suggests that the terminal bonds may be pushed slightly further apart in order to accommodate the addition of another Cl atom coming from formation of bridging bond (i.e. Al centre is linked to 4 atoms in the dimer instead of 3 in the monomer.)
B) the length of terminal bonds are the same as those found in the monomer. This means that the terminal Al-X bonds are the usual 2c-2e single bonds with a bond order of 1 (X=Cl, Br). However, bond length for the bridging Al-Cl bond is about 0.1 Å longer than the terminal Al-Cl bond. This can be explained by the fact that this is a 3c-2e bond, where the bond order is considered to be 0.5 (on average, 1 electron is shared between 2 atoms of Al-Cl-Al bridge), which is lower than that for terminal bonds (bond order =1). This lowered bond order indicates of a weaker, long bond, in agreement with the dissociation energy values shown above.
C) It is intriguing to note that the bond angle of Al to bridging Cl and terminal Cl (109.9) is very close to the angle obtained from sp3 hybridisation treatment, indicating that bridging bonds are more sp3 like. Whereas terminal bond angle remains in a sp2 situation. This highlights the fundamental difference of bridging and terminal bonds in terms of its AO component and was verified by performing additional NBO analysis on isomer 3 (see Addition-NBO analysis section).
Frequency: B3LYP/Al, Cl: 6-31G(d,p)/Br: LanL2DZ
In frequency calculations, it is neccessary to impose point group symmetry on the molecule because computing frequency requires a fully optimised structure, which includes the molecule having all of its correct symmetry. This is due to the fact that the net dipole moment of the molecule depends strongly on its symmetry, which directly affects the appearance of its IR spectra (more details are discussed below).
Symmetry had to imposed manually by applying very tight constraint (0.00001) on the point group of the molecule prior to the calculations. This is because an limitation of Gaussian is that, in order to recognise the correct symmetry of the molecule, it requires very accurate numbers that could not be obtained from basic optimisation calculations (such as the ones above). This comes about as the programme produces numbers with high precision (to 8 dp), so any slight differences in Cartesian coordinates of a molecule can break its symmetry.
After imposing point group symmetry on the isomers, frequency calculation were carried out using the same method B3LYP , basis set 6-31G(d,p) for Al, Cl and pseudo-potential LanL2DZ for Br. This confirmed that minima found from optimisation calculation were genuine as the energies were almost identical with low frequencies lines within ±15cm-1 and no negative frequencies.
| Table of summary data | low frequency lines | IR spectra | D-space link to files |
|---|---|---|---|

|
Low frequencies --- -5.1326 -4.9640 -3.1646 -0.0061 -0.0060 -0.0058 Low frequencies --- 14.8506 63.2858 86.0867 |
| Table of summary data | low frequency lines | IR spectra | D-space link to files |
|---|---|---|---|

|
Low frequencies --- -4.2332 -2.3804 -0.0031 -0.0028 -0.0015 1.3198 Low frequencies --- 17.1701 50.9114 78.5466 |
| Table of summary data | low frequency lines | IR spectra | D-space link to files |
|---|---|---|---|

|
Low frequencies --- -5.1340 -0.0001 0.0003 0.0017 1.3988 2.0442 Low frequencies --- 18.1445 49.1068 73.0096 |
| Table of summary data | low frequency lines | IR spectra | D-space link to files |
|---|---|---|---|

|
Low frequencies --- -2.4789 -0.0030 -0.0018 0.0012 0.6565 3.1379 Low frequencies --- 17.1172 55.9274 80.0585 |
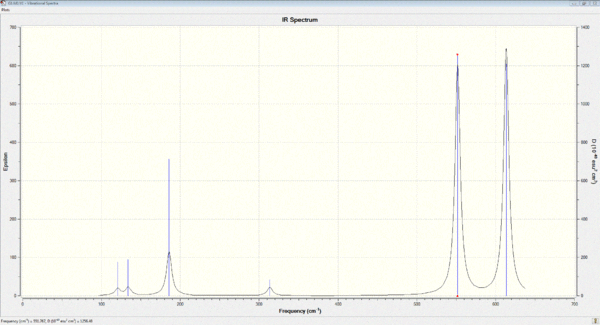
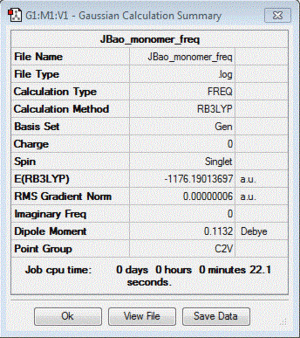
A frequency analysis for the AlCl2Br monomer was also carried out for the purpose of confirming the presence of a minimum, and this is shown here:
| Table of summary data | low frequency lines | IR spectra | D-space link to files |
|---|---|---|---|
|
Low frequencies --- -2.4283 -0.0057 -0.0055 -0.0045 2.8330 2.9094 Low frequencies --- 120.5195 133.8367 185.7804 |
Please note that: despite the ordering on the page, the frequency calculations were carried out right after optimisation to confirm that a genuine minimum was found on the potential energy surface, before publishing and posting the optimisation files on this wiki.
Analysis of IR spectra
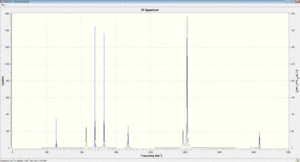
The requirement for an IR band to be active is that there must be a change in dipole moment of the molecule during vibration. Therefore, highly symmetric molecules tend to have less IR bands because changes in dipole moments along the plane or axis of symmetry can be effectively cancelled to give a net dipole moment of zero.
This is reflected here as:
A) the most asymmetric isomer - isomer 4 has the largest number of IR active bands. This is because one Br is in bridging position whilst another in terminal position. Thus, there is no axis of symmetry (Cn), no σh, no σv (i.e. no plane of symmetry found in either direction of rotational axis), and no centre of inversion (i). Therefore, changes in position of atom(s) is less likely to be matched by changes in other parts of the molecules and is more likely to result in change of dipole moment overall. Also, the IR bands are less likely to be grouped together into 1 peaks (as observed for isomer 2 and 3) due to greater variations in the type of bonds (i.e. has both terminal and bridging bond) and their position in the molecule (i.e. μA-Cl, μAl-Br and terminals bonds are at different part of the molecule). This means a greater difference between dipoles at different parts of the molecule as position of different atoms are more varied, so change in dipole moment (if applicable) is often more significant, and well separated from each other.

B) Isomer 2 and 3 has roughly the same number of IR bands. This is because, even though they have different point group, they possess similar symmetry components: both have a C2 axis of symmetry across the 2 bridging Cl atom. In this case, it is not so important that isomer 3 has 1 less σv along the bridging Cl than isomer 2, because overall dipole moment of the molecule is considered. i.e. cutting along the 2 bridging Cl vertically gives 1 Br atom and 1 Cl atom on each side of the molecule (although in isomer 2 they are facing each other and in isomer 3, a Br is facing a Cl from the other side). So, there is no overall change dipole moment of molecule(s) for anti-symmetric stretch + bend along C2 axis. Hence, this mode is inactive for isomer 3 even though it does not possess this particular plane of symmetry.
Here, it can be noted that because of this equal number of Br and Cl atom at the terminal positions either side of Al, when terminal halides vibrate (bend + stretch) along the central axis, both in and out of the plane of the bridging Cl atoms. There is no change in dipole moment as Br and Cl atoms on one side cancels that on the other. So, the number of IR bands is greatly reduced and the "real" symmetry of isomer 2 and 3 is actually higher than that represented by their point groups. Thus, isomer 2 and 3 has the fewest number of IR bands. (as illustrated on the right)
C) The number of IR bands for isomer 1 is intermediate amongst all the isomers because it is structurally very symmetric with the same atom on both terminal and bridging positions, which means a lower number of IR bands than isomer 4, where there is no structural symmetry. However, it has higher number of IR bands than isomers 2 and 3 despite having a point group with higher symmetry - D2h. This can be explained by seeing the molecule as having 2 regions of different dipoles - one for Br at the bridging bonds and another for terminal Cl at either side. Therefore, for symmetric bend in and out of plane of the 2 bridging bonds, there is a change in dipole moment as Br atoms in the central bridging region has a different dipole to Cl at terminal region. (as illustrated on the right)
Analysis of Al-Br stretching vibrations
From the computed IR spectra, it can be seen that the frequency and nature of Al-Br stretching vibrations changes depending on the position of Br atom (terminal cf. bridging). To make the comparison valid, similar vibrational modes must be compared, therefore, only the 4 stretches along the 4 Al-Cl bonds of the bridge bonding framework (effectively a square with Al and Cl at diagonal vertices) are considered in each case (case 1: 2 Br in bridging position, case 2: 2 Br in terminal position).
| position of Br in the molecule | type of stretch | wavenumber cm-1 | description of the nature of vibration |
|---|---|---|---|
| 2 bridging Br | Antisymmetric stretch | 241, 467 | Al atoms move in the same direction; very small vector at Br atoms indicates small extent of movement for higher energy vibration at 241cm-1; terminal Cl moves by roughly same extent as Al to counteract motion, but in opposite directions to each other. Br do not move for lower energy vibration at 467cm-1 |
| 2 bridging Br | Symmetric stretch | 247, 494 | same as above, but the Al atoms moves in opposite directions, coming towards each other |
| 2 terminal Br | Antisymmetric stretch | 308, 459 | 2 Cl atom in bridging position moves in the same direction for vibration at 308cm-1. For lower energy vibration (459cm-1), 2 Al atom moves instead of Cl. In both cases, vibration of bridging framework results in noticeable stretches of terminal Al-Br bonds at a small magnitude. |
| 2 terminal Br | Symmetric stretch | 280, 421 | same as above except Cl, and Al atoms now moves in opposite directions coming towards each other instead. |
| 1 bridging Br | Antisymmetric stretch | 186, 211 | 2 Al atoms move in opposite directions in and out of plane of bridging frame work. In 186cm-1, both Br and Cl in bridging position moves, though Cl moves to a larger extent. For 211cm-1, this was accompanied by movement of Br only. |
| 1 bridging Br | Symmetric stretch | 384 | 2 Al atoms move in the same direction. This is accompanied by movement of bridging Cl with large magnitude. No vector on Br. |
These can be interpreted as follows:
A) Br atoms are much heavier than Cl atoms. And, when held in a framework of 2 bridging bonds to Al, it is very difficult to move and vibrations requires high energy. Therefore, it is consistently observed that for lower energy vibrations (with higher wavenumber), the bridging Br atoms do not move, and stretches of the bridging framework originates from movement of Al atoms. So, it can be concluded that in the case of Br in bridging position, the nature of the Al-Br stretches is due to movement of the Al atoms, which makes a much larger contribution to the change in dipole moment than Br.
B) In the case of Br in terminal positions, the nature of the Al-Br stretches were caused by the movement of bridging atoms because both Al, and Cl are lighter than Br, making the movement of the bridging region much easier. Since the bridging framework is effectively holding the 2 monomers together into a molecule, its movement will distort the molecule as a whole. So, terminal bonds must move to counteract that to prevent translational motion of the molecule overall. Therefore, unlike the above case, the terminal Br atoms now moves slightly, but this contribution is very much minor compared to terminal Cl. It must be noted that in the higher energy cases (280, 308 cm-1), the nature of the movement has completely changed from movement of Al to the movement of bridging Cl atoms. This was only possible because there is no bridging Br atom (but bridging Cl instead), so the bridging framework becomes lighter, more flexible and easier to move, as indicated by lower wavenumber values compared to the 2 Br bridging case (241, 247cm-1 cf. 280, 308cm-1).
Looking at the wavenumber values for the terminal Br case, (280 cf. 421 and 308 cf. 459), it can be said that for vibrations involving the bridge region, the movement of bridging Cl is still more difficult than movement of Al attributing to the fact that Cl is heavier and is held in a more strained conformation by two 3c-2e bonds to Al.
However, vibrations due to movement of Al for the terminal Br case is lower than when 2 Br was in bridging position ( 421,459cm-1 cf. 467, 494cm-1). This is because changes in terminal positions now requires higher energy as 2 Cl atoms have been replaced with heavier Br atoms.
C) When 1 Br atom is introduced into the bridging position, the nature of the bridging region vibration changes back to the movement of Al, however, because bridging Cl is lighter, it accompanies the movement of Al atom in a situation similar to the 2 terminal Br case. And, since 3 atoms of the bridging region are now moving, it has inevitably cause movement of bridging Br as well. Thus, stretches in this case are of much higher energy than all other cases as all 4 atoms in the bridge region are now moving. It is interesting to see that in the lower energy antisymmetric stretch (211 cm-1), the nature of Al-Br stretch is actually due to movement of 2 Al atoms plus the movement of 1 bridging Br atom. This was surprising because it was anticipated that Br atom would be too heavy to move in its bridging position. The may be explained by the fact there is 1 terminal Br atom as well. And this terminal Br can limit the extent to which the terminal atoms can counteract the movement in bridging region, and thus, movement of Br in the direction of Al-Br bridging bond was required to balance the vectors on Al that is vibrating out of the plane of bridging region.
But, it must be said that this vibration is still very much unfavoured with a lower intensity of 20, whereas in the case where the movement of 2 Al is accompanied by 1 bridging Cl (384cm-1), the intensity is 5 times higher at 153. Also, the wavenumber for this stretch (211cm-1) is also lower than cases where 2 Al + bridging Cl were moving (384cm-1), this is because in introducing 1 bridging Br atom, the bridges has gotten heavier and thus require higher energy to be moved. Alternatively, this can be understood as because the bridging Br barely moves, the other 3 atoms has to vibrate with higher magnitude in order to distort it, giving rise to a higher energy vibration.
Please note that since IR bands for isomer 2 and 3 are effectively the same, the use of either one of them is valid for this comparison.
MO analysis: B3LYP/Al, Cl: 6-31G(d,p)/Br: LanL2DZ
D-space file: DOI:10042/99376
An MO analysis was carried on the lowest energy isomer - one with 2 terminal Br atoms on different side (trans-) of the molecule. This was done by carrying out an Energy calculation with additional keywords "pop=full" and including Full NBO in the set-up. The "GEN" option and "pseudo=read gfinput" line remained to ensure consistency with optimisation and frequency analysis, where a full 6-31G(d,p) basis set was used for Al and Cl, and a LANL2DZ pseudo-potential was applied to Br. All the occupied MOs were then visualised. However, only the non-core MOs were looked upon further because these are the MOs from valence atomic orbitals that are delocalised across the molecule. Whereas core MOs are from inner core atomic orbitals that are localised around the atom it originated from. These are not considered as they lie very deep into the nuclei (energy of core MOs are very large and negative).
A large number of occupied, non-core MOs were found, so only five of them were analysed here by annotation. These are shown below in an order from highly bonding to highly antibonding:
38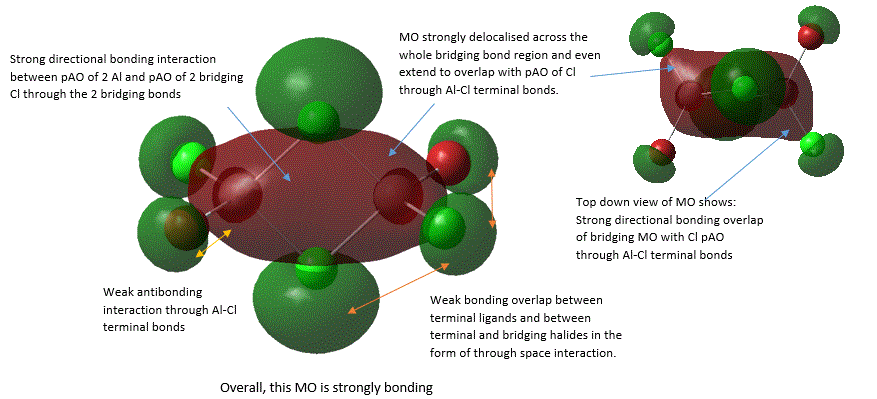 |
37 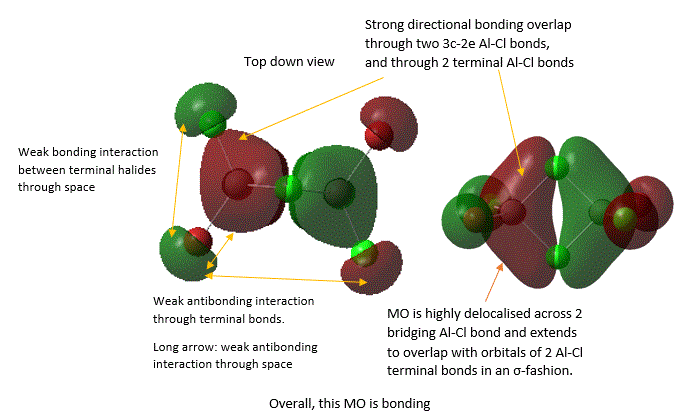 |
40 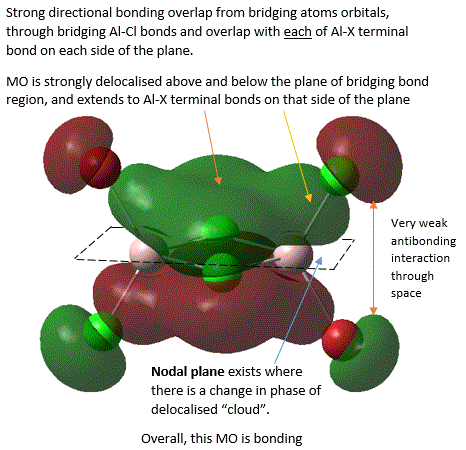 |
45 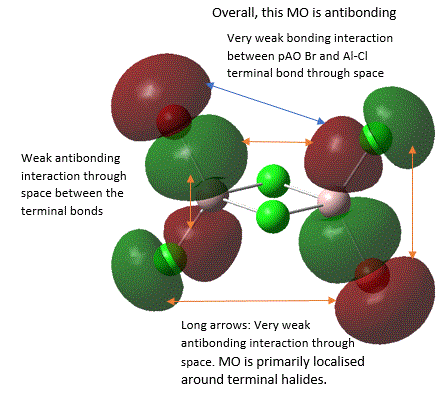 |
39 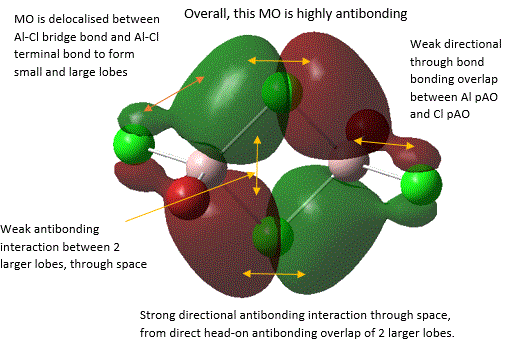 |
Please note: It should be said that there are nodes existing at the point of phase change in each MO, however, it was noticed that they are often localised on an atom, which are not of interest and therefore nodes existing on atoms are not marked on these MOs. |
It should be noted that the analysis of bonding and antibonding character of MO is entirely qualitative, which did make ordering the 5 MOs by relative bonding character more difficult. In fact, it was initially suspected that MO 37 and MO 40 should be similar in bonding character because both involve similar level of overlap and delocalisation but just in different directions. However, upon closer inspection, it was noted that in MO 37, strong bonding overlap in the bridging region comes from overlapping of 2 bridging Al-Cl bond orbitals in a sigma fashion and is delocalised along the 2 the Al-Cl bridging bonds. Whereas, in MO 40, there is a π-fashion overlap between pAO Al and pAO bridging Cl, forming an extensively delocalised "cloud" of electron density analogous to that of a pi "cloud" in π-bonding orbital of alkene C=C double bond. Here, MO is only diffused above or below the plane and not along bonds, and π-overlap is weaker than σ overlap. Thus, MO 37 was considered to be more bonding.
From MO 40, it is interesting to see that when bridging hydrogen (in the case of diborane B2H6) is replaced by halides, this raises the possibilty of pi-bonding from use of halides pAO. Thus, it is found that this pAO interaction between bridging atoms and Al is largely similar to "clouds" of pi-electrons in C=C π-bonds (as shown in MO 40). This rationalizes the fact that there is an increased level of p orbital character in bridging bonds in comparison to terminal bond, which is in agreement with results from NBO analysis (below).
In MO 40, a nodal plane exists in the plane of bridging bonds where the probability of finding electrons here is zero. This is very interesting as it shows that electrons cannot be localised in the bridging bonds between the bonding atoms like the situation with 2c-2e single bonds due to presence of this nodal plane, but rather, they need to be delocalised above and below the bonding atoms. This shows that the nature of 3c-2e bonds is much more diffused as electron density is spread across a larger region beyond position of atoms.
In MO 38, atomic orbital on 2 bridging Cl atoms is more diffused than AO on the terminal halides. This further emphasize the difference of 3c-2e bonding where electron density is delocalised more widely.
In MO 37, the definition of a 3c-2e bond can be directly visualised by considering the σ component of Cl-Al-Cl bridging bonds, where one can see that the electrons are indeed spread across the internuclear space between 3 atom centres, as suggested by its name.
Additional: NBO charge analysis
From the MO analysis log file, it was possible to find the relative NBO charge of atoms in isomer 3 as well the hybridisation of the atomic orbitals in forming bonds of the molecule since this analysis separates the electron density of the whole molecule into parts similar to that of atomic orbitals. This gave another mean to compare the difference between bridging and terminal bonds in these systems from looking at the relevant lines in the output:
(Occupancy)   Bond orbital/ Coefficients/ Hybrids
---------------------------------------------------------------------------------
3. (1.96823) BD ( 1)Cl   2 -Al   7
               ( 87.94%)   0.9378*Cl   2 s( 22.76%)p 3.39( 77.10%)d 0.01(  0.14%)
                                           0.0000  0.0002 -0.4770 -0.0078  0.0000
                                           0.6569  0.0005  0.0000 -0.2600 -0.0002
                                           0.0000 -0.5215  0.0048  0.0070  0.0288
                                          -0.0115 -0.0075 -0.0175
               ( 12.06%)   0.3472*Al   7 s( 20.14%)p 3.81( 76.64%)d 0.16(  3.22%)
                                           0.0000  0.0010 -0.4486 -0.0129  0.0002
                                          -0.4960 -0.0153 -0.0001  0.2066  0.0046
                                           0.0002  0.6894  0.0461  0.0619  0.1381
                                          -0.0590 -0.0618 -0.0447
6. (1.97671) BD ( 1)Cl   4 -Al   7
               ( 82.68%)   0.9093*Cl   4 s( 28.99%)p 2.44( 70.82%)d 0.01(  0.19%)
                                           0.0000  0.0000 -0.5384  0.0003  0.0000
                                          -0.1029  0.0000  0.0000  0.8349 -0.0254
                                           0.0000  0.0000  0.0000  0.0095  0.0000
                                           0.0000  0.0363  0.0212
               ( 17.32%)   0.4162*Al   7 s( 29.95%)p 2.25( 67.41%)d 0.09(  2.63%)
                                           0.0000  0.0001 -0.5472  0.0127  0.0000
                                           0.1359  0.0057  0.0000 -0.8081 -0.0506
                                           0.0000  0.0000  0.0000  0.0235  0.0000
                                           0.0000  0.1444  0.0702
Here, no. 3: Cl (atom 2) - Al (atom 7) represents a bridging Al-Cl bond, and no. 6: Cl (atom 4) to Al (atom 7) is for a terminal Al-Cl bond. By comparing them, the following observations can be made:
A) The bridging bond has more p character as the p orbital contribution from both Cl and Al atom has increased by around 7 and 9% respectively. This corresponds to a similar reduction in s orbital contribution from both atoms in the case of terminal bonds. Therefore, looking at relative % of s and p in each case, it is fair to say that the terminal bonds resembles an overlap between sp2 hybridised orbital of Al and sp2 orbital of Cl ( s( 29.95%)+ p( 67.41%) for Al and s(28.99%)+ p(70.82%) for Cl), whereas bridging bonds are more similar to situation of a sp3 hybridised orbital of Al bonding with a sp3 orbital of Cl. ( s(29.95%)+ p(67.41%) for Al and s(28.99%) + p(70.82%) for Cl). This explanation matches with what has been observed in the bond angles of terminal Cl-Al-terminal Cl bond (120°) and terminal Cl-Al-bridging Cl bond (109.9°) in the Additional-Geometry comparison section.
This is further evidence that terminal bonds are stronger than bridging bonds because they possess a greater level of s character, which is more penetrating. Thus these bonds originates closer to the nuclei and bonding electrons experiences a greater mutual electrostatic attraction to the Al, Cl nuclei.
B) Formation of bridging bond involves a greater contribution from Cl atom, where the contribution from Al has decreased by about 5% upon dimerisation. This may be interpreted as evidence that some electron density is donated from the halide into the electron deficient Al atom (empty pz AO) in forming the bridging bonds. This is mostly likely to be from the halide lone pair, and helps to illustrate why dimerisation (bridging bond formation) is said to relieve the electron deficiency of Group 13 elements.
MO analysis also enable a direct comparison of the energy of the bonds in this molecule, which could not be calculated previously from just performing optimisation analysis. This is done by looking at the NBO summary in the log file:
Natural Bond Orbitals (Summary):
                                                           Principal Delocalizations
          NBO                        Occupancy    Energy   (geminal,vicinal,remote)
====================================================================================
Molecular unit  1  (Al2Cl4Br2)
    1. BD (   1)Cl   1 -Al   7          1.96824    -0.67354  119(g),120(v),124(g),122(g)
                                                   118(g),123(v),100(g),114(v)
                                                   121(v)
    2. BD (   1)Cl   1 -Al   8          1.96823    -0.67351  120(g),119(v),123(g),121(g)
                                                   117(g),124(v),109(g),105(v)
                                                   122(v)
    3. BD (   1)Cl   2 -Al   7          1.96823    -0.67352  117(g),118(v),124(g),122(g)
                                                   120(g),123(v),100(g),114(v)
                                                   121(v)
    4. BD (   1)Cl   2 -Al   8          1.96824    -0.67354  118(g),117(v),123(g),121(g)
                                                   119(g),124(v),109(g),105(v)
                                                   122(v)
    5. BD (   1)Cl   3 -Al   8          1.97671    -0.72695  118(g),120(g),123(g),110(g)
    6. BD (   1)Cl   4 -Al   7          1.97671    -0.72695  119(g),117(g),124(g),101(g)
    7. BD (   1)Br   5 -Al   8          1.96928    -0.55258  118(g),120(g),121(g)
    8. BD (   1)Br   6 -Al   7          1.96928    -0.55258  117(g),119(g),122(g)
    9. CR (   1)Cl   1                  2.00000  -100.72243
   10. CR (   2)Cl   1                  1.99979   -10.05789
Here, 1 - 4 represents the 4 bridging Al-Cl bonds, whereas 5-8 are data for the terminal bonds. Beyond number 9, all the NBOs are from the core orbital as denoted by "CR". And, it was obvious to see that the energy of these core orbitals are much more negative than non-core since they lie much deeper into the nuclei.
The following points can be made from the above information:

A) the bridging Cl bonds are lower in energy than than the terminal bonds by 140.28 kJmol-1 ( 0.72695 - 0.67352 = 0.05343 AU ). This quantitatively confirmed the point that bridging bond is weaker than terminal. Meanwhile, looking at the principle delocalisation column, the charge distribution for bridging bond is delocalised more extensively via both germinal and vicinal. Whereas, terminal bonds are less delocalised as the electron density is only distributed in a germinal fashion. This helps to support the idea that the bridging bond differs from the usual 2c-2e single bonds as bonding electron in a 3c-2e bond is spread across more sites (3 centres as opposed to 2).
B) The terminal Br-Al bond is weaker (lower in energy) than Al-Cl bond (0.55258 cf 0.72695 AU), which follows the trend of decreasing bond length going down a Group (as explored in Week 1).
C) It is surprising to see that from this data, the terminal Br-Al bond is actually weaker than the bridging Al-Cl bond (0.55258 cf 0.67352 AU). This may be due to the fact that both Al and Cl are in the same period, so their orbitals are much more similar in size in comparison to Br, which is further down the Group. Therefore, the overlap between Al-Cl orbitals is stronger. This is further enhanced by the nature of the bond geometry, where there are 2 regions of overlapping as for the Al-Cl bridging bond as Cl is placed between two Al atoms. This orbital effect may have overcome the fact that the bond is 3c-2e, making it a stronger overlap than the overlap in terminal Al-Br, which is weaker as Br orbitals are more diffused.
Finally, it can be visualised that overall, the NBO charge for Al remains largely positive at 1.316, owing the electropositivity of Al. Whilst, the NBO charge for both Br and Cl remained negative at -0.397 and -0.488 owing to electronegativity of halides. However, it was interesting to see that the NBO charge for bridging Cl is -0.431, a reduction in negativity from the terminal Cl (which is -0.488). This supports the above proposal in that some electron donation from halide to Al is involved in bond formation similar to what has been taught in first and 2nd year. But, this effect is actually not as significant as it has been emphasized over the chemistry courses because the difference in NBO charge is quite small at 0.057 (an image is attached below).
Suggestion for further study
1. Investigation of the trend of dimerisation going down Group 13 by applying the same calculations of frequency, optimisation and MO analysis to diboranes with halide ligands, e.g. B2Cl6.
2. Explore the effect of varying atomic sizes of halide ligands going down Group 17. For example, Al2Br4I2. Meanwhile, aside from the usual calculations, NBO analysis should be performed to see if the Al-I terminal bond has lower energy than Al-Br bridging bond to see if the same trend observed in Al2Br2Cl4 is consistent in other dimeric Al systems.
3. This work could be extended to study organoaluminium systems where bridging ligands are methyl groups (CH3). This would give insight as to why Al-X-Al halide bridging is favoured over Al-C-Al alkyl bridging - a point that was often taken as a fact from the 2nd year Main Group Chemistry course. This is because the nature of interaction between Carbon sp3 orbital and Al sp2 must be very much different, which can be investigated further with bond coefficients/hybrids data from NBO analysis. In addition, MO analysis can allow direct visualisation of the orbital interactions, providing insight as to why a larger difference in bond angle of terminal and bridging bond was obtained in these organoaluminium systems.
References
- ↑ 1.0 1.1 This reference is used to provide all the values for bond dissociation energy in this experiment: T. L. Cottrell,The Strengths of Chemical Bonds,2d ed., Butterworth, London, 1958; B. deB. Darwent, National Standard Reference Data Series, National Bureau of Standards, no. 31, Washington, 1970; S. W. Benson,J. Chem. Educ. 42:502 (1965); and J. A. Kerr, Chem. Rev.66:465 (1966)
- ↑ Please note: the LCAO diagram was taken from Dr Tricia Hunt, originating from Lecture 4- 2nd year Inorganic IIA - Molecular Orbital course.
- ↑ S. S. Batsanov, Van der Waals radii of elements, Inorganic Materials, Vol. 37, No. 9, 2001, pp. 871–885. Translated from Neorganicheskie Materialy, Vol. 37, No. 9, 2001, pp. 1031–1046
- ↑ R.L DeKock, W.B Bosma, "The three-center, two-electron chemical bond." Journal of Chemical Education 65, no. 3 (1988): 194.
- ↑ N. N. Greenwood, A. Earnshaw, Chemistry of the Elements, Pergamon Press, Oxford, United Kingdom, 1984.

