Rep:Mod:awc106 module3
Module 3: The Transition State
The Cope Rearrangement Tutorial
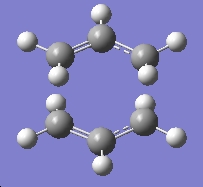
In this part of the report we will study the Cope rearrangement of 1,5-hexadiene, in order to show how to study the problem of chemical reactivity. The main objectives are to identify the energy minim and the transition state structures on the 1,5-hexadiene potential energy surface, and to identify the preferred mechanism for the transformation.
The cope rearrangement, a [3,3] sigmatropic shift rearrangement, is now known to occur in a concerted method via a transition state with the form of either a boat or chair conformation, it is also well known that the boat transition structure is higher in energy than the chair conformation. It has also been shown that using the B3LYP/6-31G method and basis set when performing the optimisations gives results which agree well with those valies determined experimentally.

Optimising Reactants and Products
Gaussview was used to draw a molecule of 1,5-hexadiene with an anti linkage for the central four carbon atoms. The structure was cleaned by invoking the clean function under the edit tab. The molecule was then optimised. A Gaussian calculation menu was opened, and an optimisation was selceted from the job type tab. The method was already set to Hartree Fock, and the basis set to 3-21G. The %mem was changes to 250MB, and the job was submitted. Finally the checkpoint file was opened, and the results summary was available. The final structure did not have symmetry, so the molecule was symmetrized. The reuslts were as follows:
Table 1: Initial Optimisation of Anti 1,5-hexadiene | |||
| Conformer | Structure | Point Group | Energy/Hartrees
HF/3-21G |
| Anti 1 | 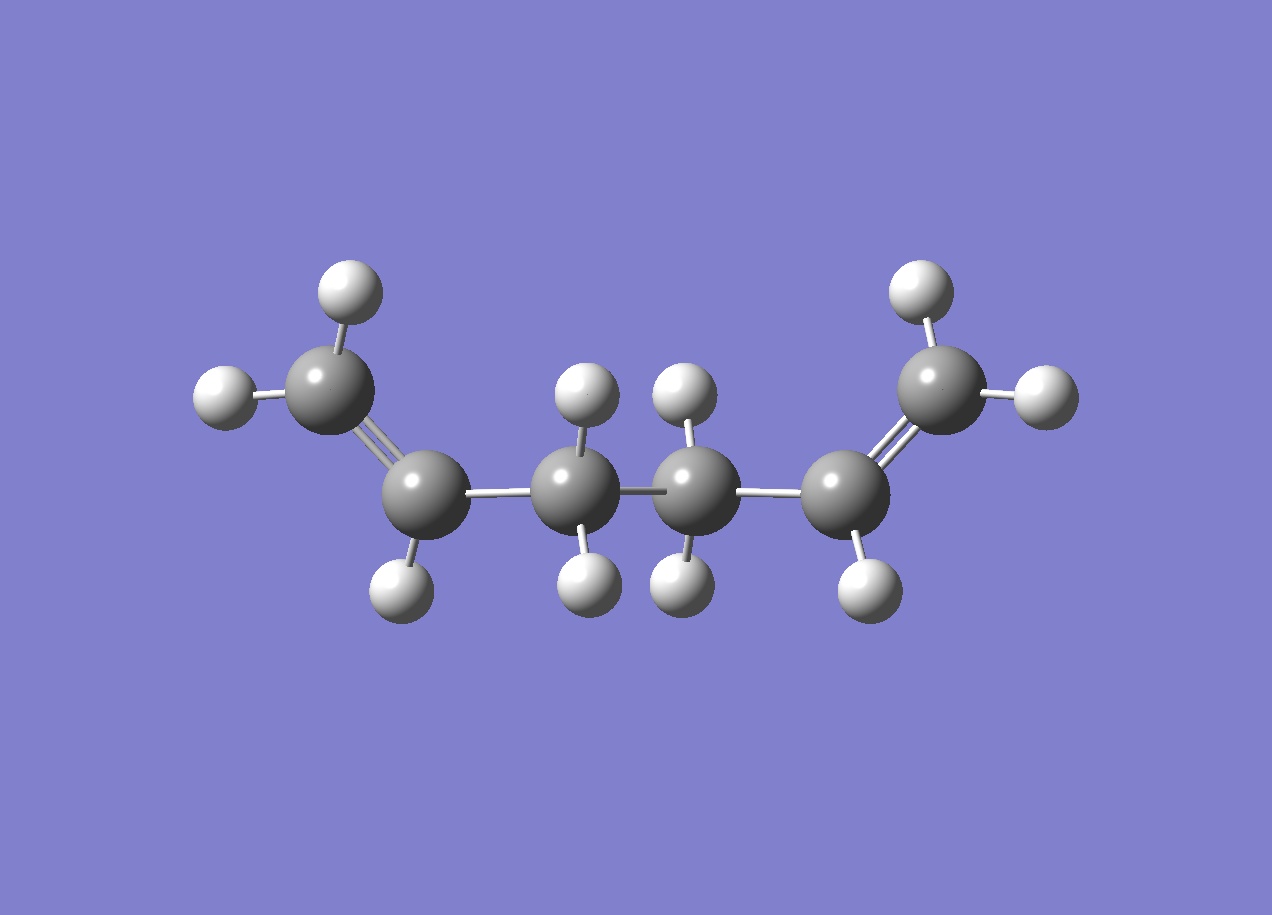
|
C2 | -231.69260 |
As I was unable to publish my file on D-Space, I have linked it below:
https://www.ch.ic.ac.uk/wiki/images/1/11/ANTI_OPT.LOG
The same steps were followed again, this time with a molecule of 1,5-hexadiene with a gauche linkage for the four central carbon atoms, with the following results:
Table 2: Initial Optimisation of Gauche 1,5-hexadiene | |||
| Conformer | Structure | Point Group | Energy/Hartrees
HF/3-21G |
| Gauche 1 | 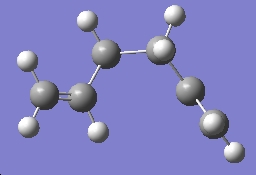
|
C1 | -231.69266 |
https://www.ch.ic.ac.uk/wiki/images/9/92/GAUCHE_1_OPT.LOG
It is normal that the lowest energy conformation of a molecule is used as a reference for the calculated enthalpies and activation energies. Based on the results obtained above, I draw several gauche conformations of 1,5-hexadiene, in order to find the lowest energy conformation. The lowest conformation that I was able to determine can be seen below:
Table 3: Optimisation of Low Energy Conformation of 1,5-hexadiene | |||
| Conformer | Structure | Point Group | Energy/Hartrees
HF/3-21G |
| Gauche Low Energy | 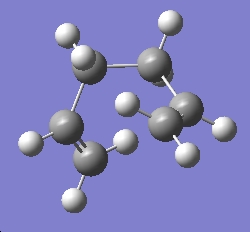
|
C2 | -231.66735 |
https://www.ch.ic.ac.uk/wiki/images/b/b3/GAUCHE_LOWENERGY_OPT.LOG
The optimised structures abover were compared with those provided in Appendix 1. It is clear that there are definite matches between my optimised structures, and those given, the first optimised conformation, labelled as Anti 1 is the same as anti1 in the appendix, with an exact energy match. The same can be said for my Gauche 1 matching up with gauche3 and finally my lowest energy conformation matches up with gauche1 in the appendix.
The Ci anti 2 conformation given in the appendix was drawn and optimised using the same method and basis set as above, HF/3-21G.
Table 4: Initial Optimisation of Anti 2 1,5-hexadiene | |||
| Conformer | Structure | Point Group | Energy/Hartrees
HF/3-21G |
| Anti 2 | 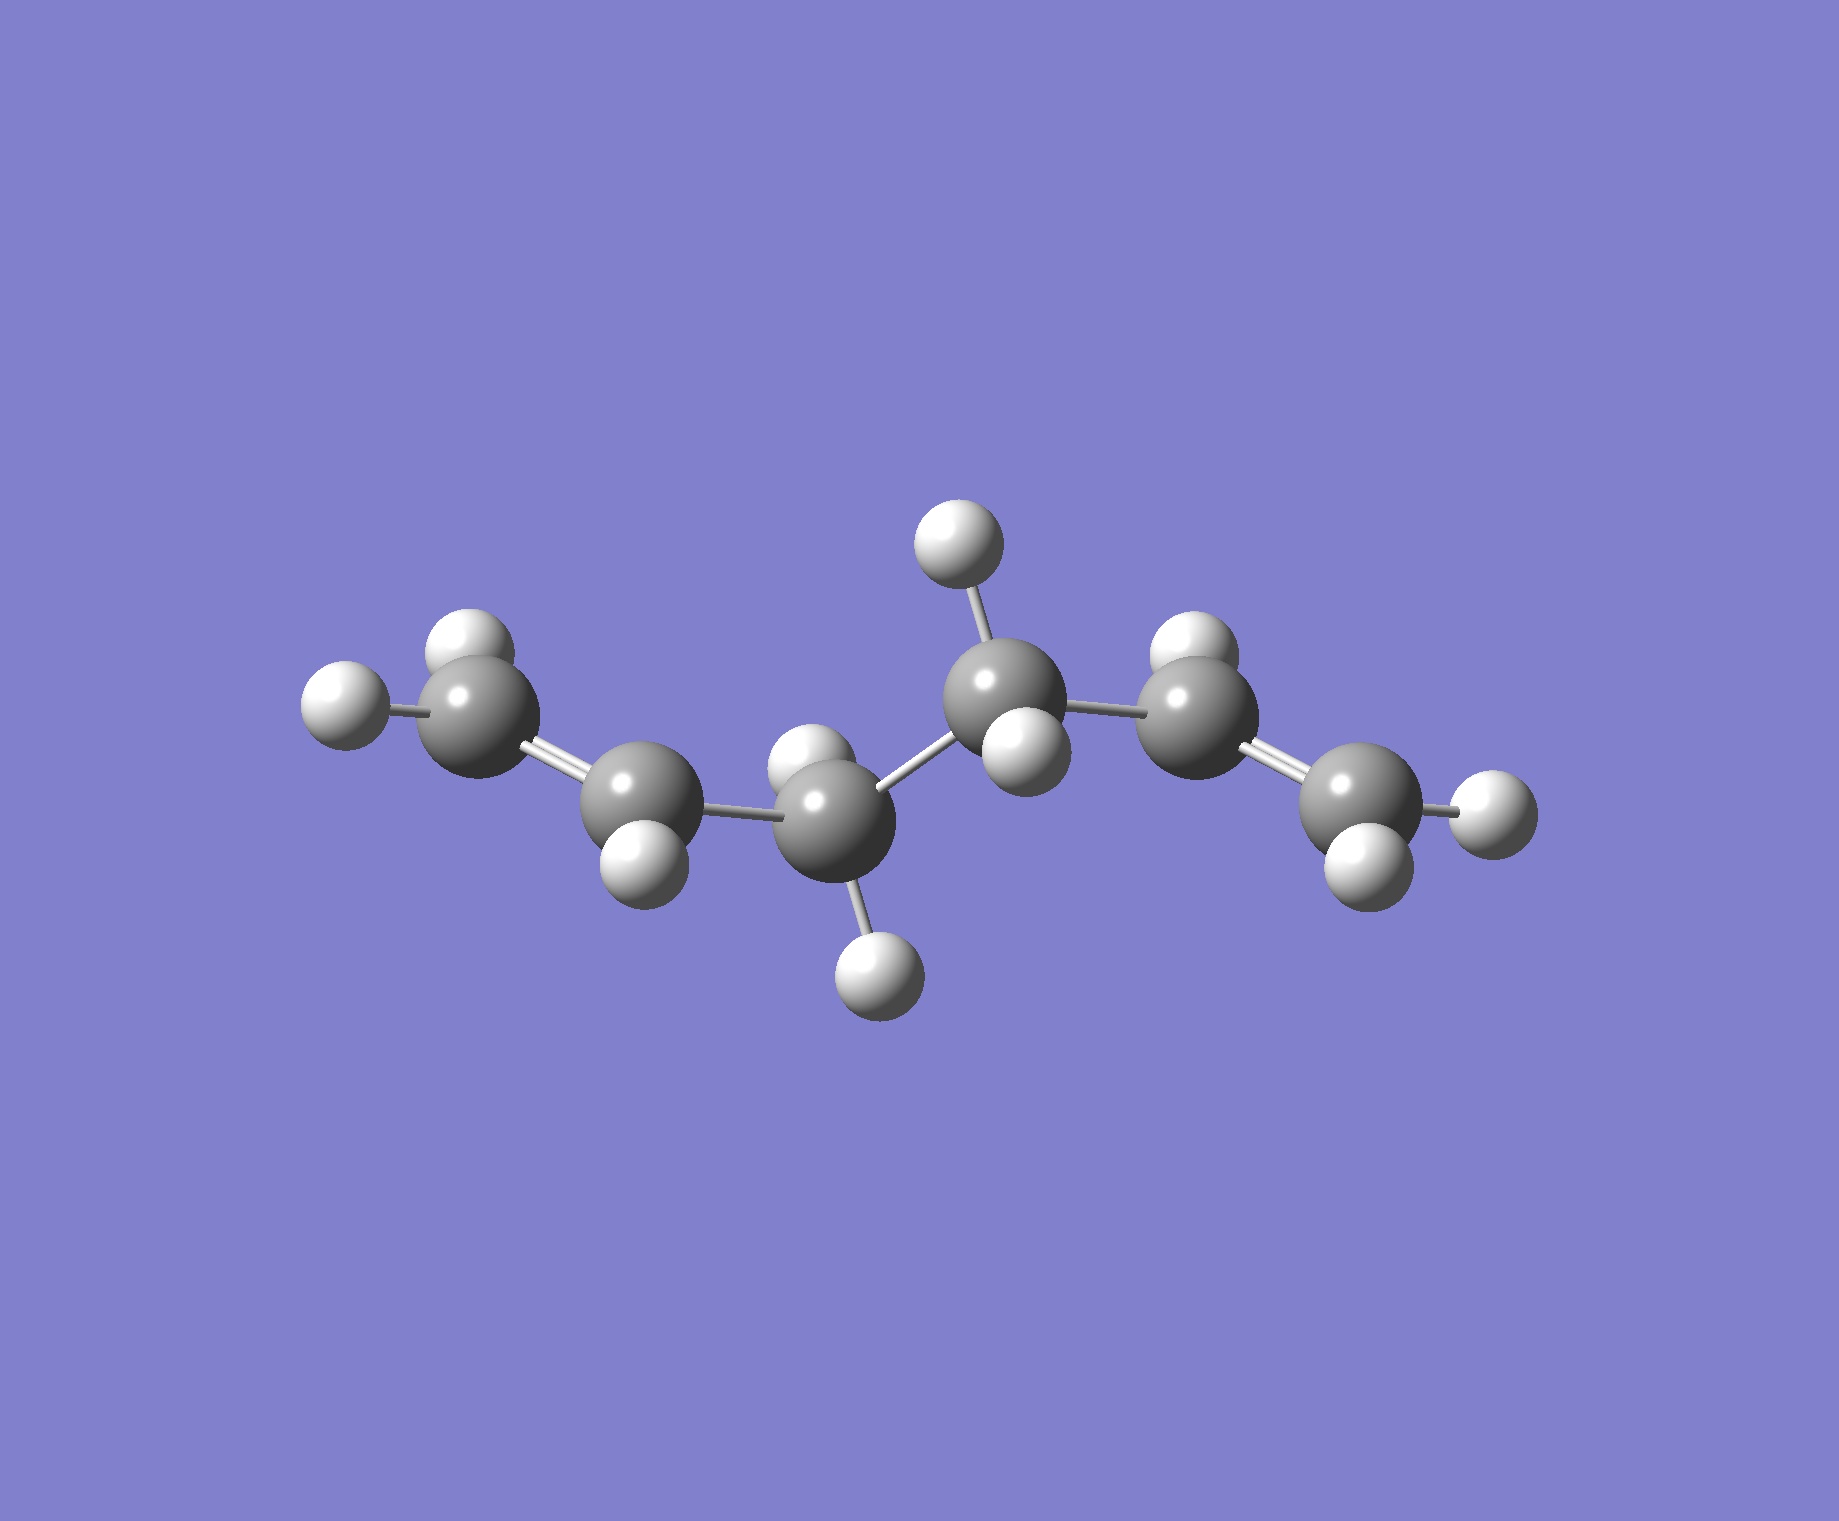
|
Ci | -231.69254 |
https://www.ch.ic.ac.uk/wiki/images/c/cd/ANTI_2_OPT.LOG
The energy given in the appendix is -231.69254. The molecule optimised has the same energy, we can be sure then that they are the same.
The enxt step is to use a more advanced basis set. The optimised structure was opened, and another calculation set up, this time using the DFT/B3LYP method, and the 6-31G basis set. The results are given below:
Table 5: Second Optimisation of Anti 2 1,5-hexadiene | |||
| Conformer | Structure | Point Group | Energy/Hartrees
HF/3-21G |
| Anti 2 | 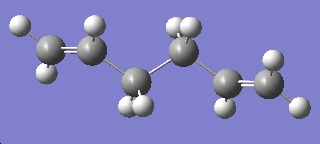
|
Ci | -234.35971 |
https://www.ch.ic.ac.uk/wiki/images/f/f3/ANTI_2_OPT_B3LYP_631G.LOG
We can compare see that the B3LYP/6-31G optimised structure is lower in energy than the intially optimised structure, we can also see that the point group and symmetry of the molecule has remained the same.
In order to be able to compare these results with experimentally determined quantities, it is necessary to include some more terms. We can achieve this by running a frequency calculation. Starting from the B3LYP/6-31G optimised structure, the job type was changed to frequency. Once the job was complete the .log file was opened, and the vibrations were available under the results tab. It is possible to visualise the vibrations, and also to visulaise the IR spectrum. The frequencies were inspected, and all were positive. This tells us that we have indeed found an energy minima, if one of the frequencies had been positive, we would have found a transition stae. However in this case we are interested in the termodynamic data that is also available. We can view the output file, and in the file is a section titled Thermochemistry. The following information was provided:
Table 6: Thermochemical Data of Anti 2 1,5-hexadiene | |||
| Quantity | Energy | ||
| Sum of Electronic and
Zero-Point Energies |
-234.416217 | ||
| Sum of Electronic and
Thermal Energies |
-234.408932 | ||
| Sum of Electronic and
Thermal Enthalpies |
-234.407988 | ||
| Sum of Electronic and
Thermal Free Energies |
-234.447814 | ||
https://www.ch.ic.ac.uk/wiki/images/1/1f/ANTI_2_OPT_B3LYP_631G_FREQ.LOG
Optimising the Chair Transition Structure
In this section we will be performing transiton structure optimisations by firstly computing the force constants, secondly using the redundant coordinate editor and thirdly using QST2. We will also visualise the reaction coordinate, run the IRC and caclulate the activation energies for the two transition structures (boat and chair) for the Cope rearrangement.
Firstly and allyl fragment was drawn in Gauusview and optimised using HF/3-21G.
Table 7: Initial Optimisation of Allyl Fragment | |||
| Conformer | Structure | Point Group | Energy/Hartrees
HF/3-21G |
| Allyl 1 | 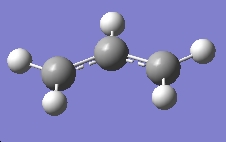
|
C2v | -115.82304 |
https://www.ch.ic.ac.uk/wiki/images/1/1e/ALLYL_FRAGMENT.LOG
Next a new MolGroup was opened, and two copies of the optimised allyl fragment were copied into it, and the two fragments positioned so as to resemble the example given in appendix 2. A calculation was set up, using a job type of Opt+Freq. The optimisation was set to a TS (Berny) and the force constant option set to once. In the additional keywords section "Opt=NoEigen" was written, this is to ensure that the calculation does not crash if more than one imaginary frequency is detected.
Table 8: Initial Optimisation of Transition State | ||||
| Conformer | Structure | Point Group | Energy/Hartrees
HF/3-21G |
Imaginary Frequency |
| Chair Transition State | 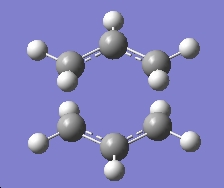
|
C2h | -231.61932 | -817.98 |
https://www.ch.ic.ac.uk/wiki/images/4/4c/CHAIR_TS_GUESS.LOG
There was only one imaginary frequency given, and the animation of the vibration corresponded to the Cope rearrangement.
The next step is to optimise the transition structure again, this time using the frozen coordinate method. A new MolGroup was created, and the optimised transition state structure was pasted into it. The redundant coordinate editor was opened, and the two sets of terminal carbon atoms were set frozen to 2.2angstroms. Then an optimisation using HF/3-21G was run.
Table 9: Frozen Coordinate Optimisation of Transition State | ||||
| Conformer | Structure | Point Group | Energy/Hartrees
HF/3-21G |
Bond Breaking/Forming Lengths/Ǎ |
| Chair Transition State | 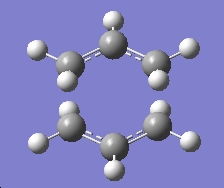
|
C2h | -231.61519 | Both 2.20 |
https://www.ch.ic.ac.uk/wiki/images/b/b9/CHAIR_TS_FROZEN.LOG
The optimised structure looks the same as the initial guess, with a very similar energy, and same point group, however in this case the bond forming/breaking distances are set to 2.2Ǎ.
Next the optimised molecule was again copied into a new MolGroup, and this time the two sets of bond forming/breaking carbons were set to derivatives, and transition state calculation was set up as before, however the force constant option was set to never.
https://www.ch.ic.ac.uk/wiki/images/5/5f/CHAIR_TS_DERIVATIVE.LOG
Comparing the last two optimisations, again we have very similar energies for both, however the point group has changes from C2h to C2, and one of the bond forming/breaking lengths has lengthened to 2.32Ǎ. We also note that the imaginary frequency as changed from that given in the orignial transition state optimisation.
Optimising the Boat Transition Structure
So far we have optimised the chair transition state. Now we must optimise the boat transition state. This will be done by using the QST2 method. This method involves defining the reactants and the products, and the calculation will determine the transition state between them. In order to achieve this, we must differentiate between the reactant and the product, because they are both 1,5-hexadiene, so we must manually change the atom numbering, so as to be able to identify two distinct molecules.
The checkpoint file for the anti 2 conformation perfomed earlier was opened. Two copies of the optimised structure were pasted into a new MolGroup. They were orientated as illustrated in the wiki page. The atom labels were turned on, and then under the edit tab, the atom list was opened for the "product" molecule. The atom labels were changed so that they resembled:
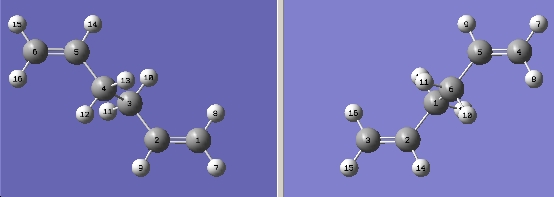
A transition state claclulation was run, using the option TS (QST2). The calculation failed. This is because the calculation did not consider the possibility of there being any roation about the central carbons in order to form the boat transition state. In order to get the calculation to run, the dihedral angles between the central four carbons were changed from 180° to 0°, and the angles between the inside three carbons were changed from approximately 112° to 100°, the result of which was:
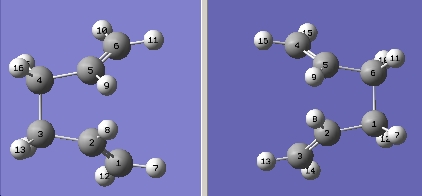
The transition state calculation using the TS (QST2) option was run again, with the following results:
Table 11: Initial Optimisation of Transition State | ||||
| Conformer | Structure | Point Group | Energy/Hartrees
HF/3-21G |
Imaginary Frequency |
| Boat Transition State | 
|
C2v | -231.60280 | -839.92 |
https://www.ch.ic.ac.uk/wiki/images/4/48/BOAT_TS_OPT.LOG
From the results obtained here, we can see that whilst the QST2 method is fully automated and will find the transition strucutere, it also has some serious drawbacks, in that if the reactants and products are not close enough to the actual transition structure then the calculation will fail.
When we take time to inspect the optimised chair and boat transition structures, it becomes clear that it is very difficult to see which specific conformers of 1,5-hexadiene they will form. There is a method availale in Gaussian which allows us to follow the minimum energy path of a transition structure. This is the IRC (intrinsic reaction coordinate) method, which makes small changes to the geometry along the potential energy surface where the gradient is steepest.
Activation Energies
Finally we need to calculate the activation energies for the Cope rearrangement via the chair and the boat transition states. To do this we need to reoptimise the two transition states using the B3LYP/6-31G method and basis set, and then carry out a frequency calculation. The results of the optimisations using the higer basis set were as follows:
Table 13: B3LYP/6-31G Optimisation of Transition States | |||
| Conformer | Structure | Point Group | Energy/Hartrees
HF/3-21G |
| Chair TS | 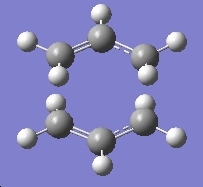
|
C2h | -234.50547 |
| Boat TS | 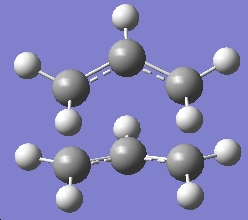
|
C2v | -234.49291 |
https://www.ch.ic.ac.uk/wiki/images/3/3d/BOAT_TS_REOPT.LOG
https://www.ch.ic.ac.uk/wiki/images/7/7a/CHAIR_TS_REOPT_FREQ.LOG
Next a frequency calculation was run, and the following data was available:
Table 14: Activation Energies of Transition States | |||
| Conformer | Energy
Hartrees |
Activation Energy
kcalmol-1 |
Expt |
| Chair TS | -234.50547 | 33.17 | 33.5 ± 0.5 |
| Boat TS | -234.49291 | 41.32 | 44.7 ± 2.0 |
https://www.ch.ic.ac.uk/wiki/images/2/22/BOAT_TS_REOPT_FREQ2.LOG
https://www.ch.ic.ac.uk/wiki/images/7/7a/CHAIR_TS_REOPT_FREQ.LOG
If we compare the results from the HF/3-21G and B3LYP/6-31G optimisations, we see that the geometries of the two sets of transition structures are almost identical, but we find that there is a significant difference in the energies of the twos ets of transition states. We can take something important from this observation, that is better to calculate the potential energy surface of a transition state using a low basis set and method, and then to reoptimise at a higher level.
The Diels Alder Cycloaddition
Part (i)
A molecule of cis-butadiene was drawn in Gaussview, and optimised using the AM1 semi-empirical molecular orbital method. After completion, the molecular orbitals were available:
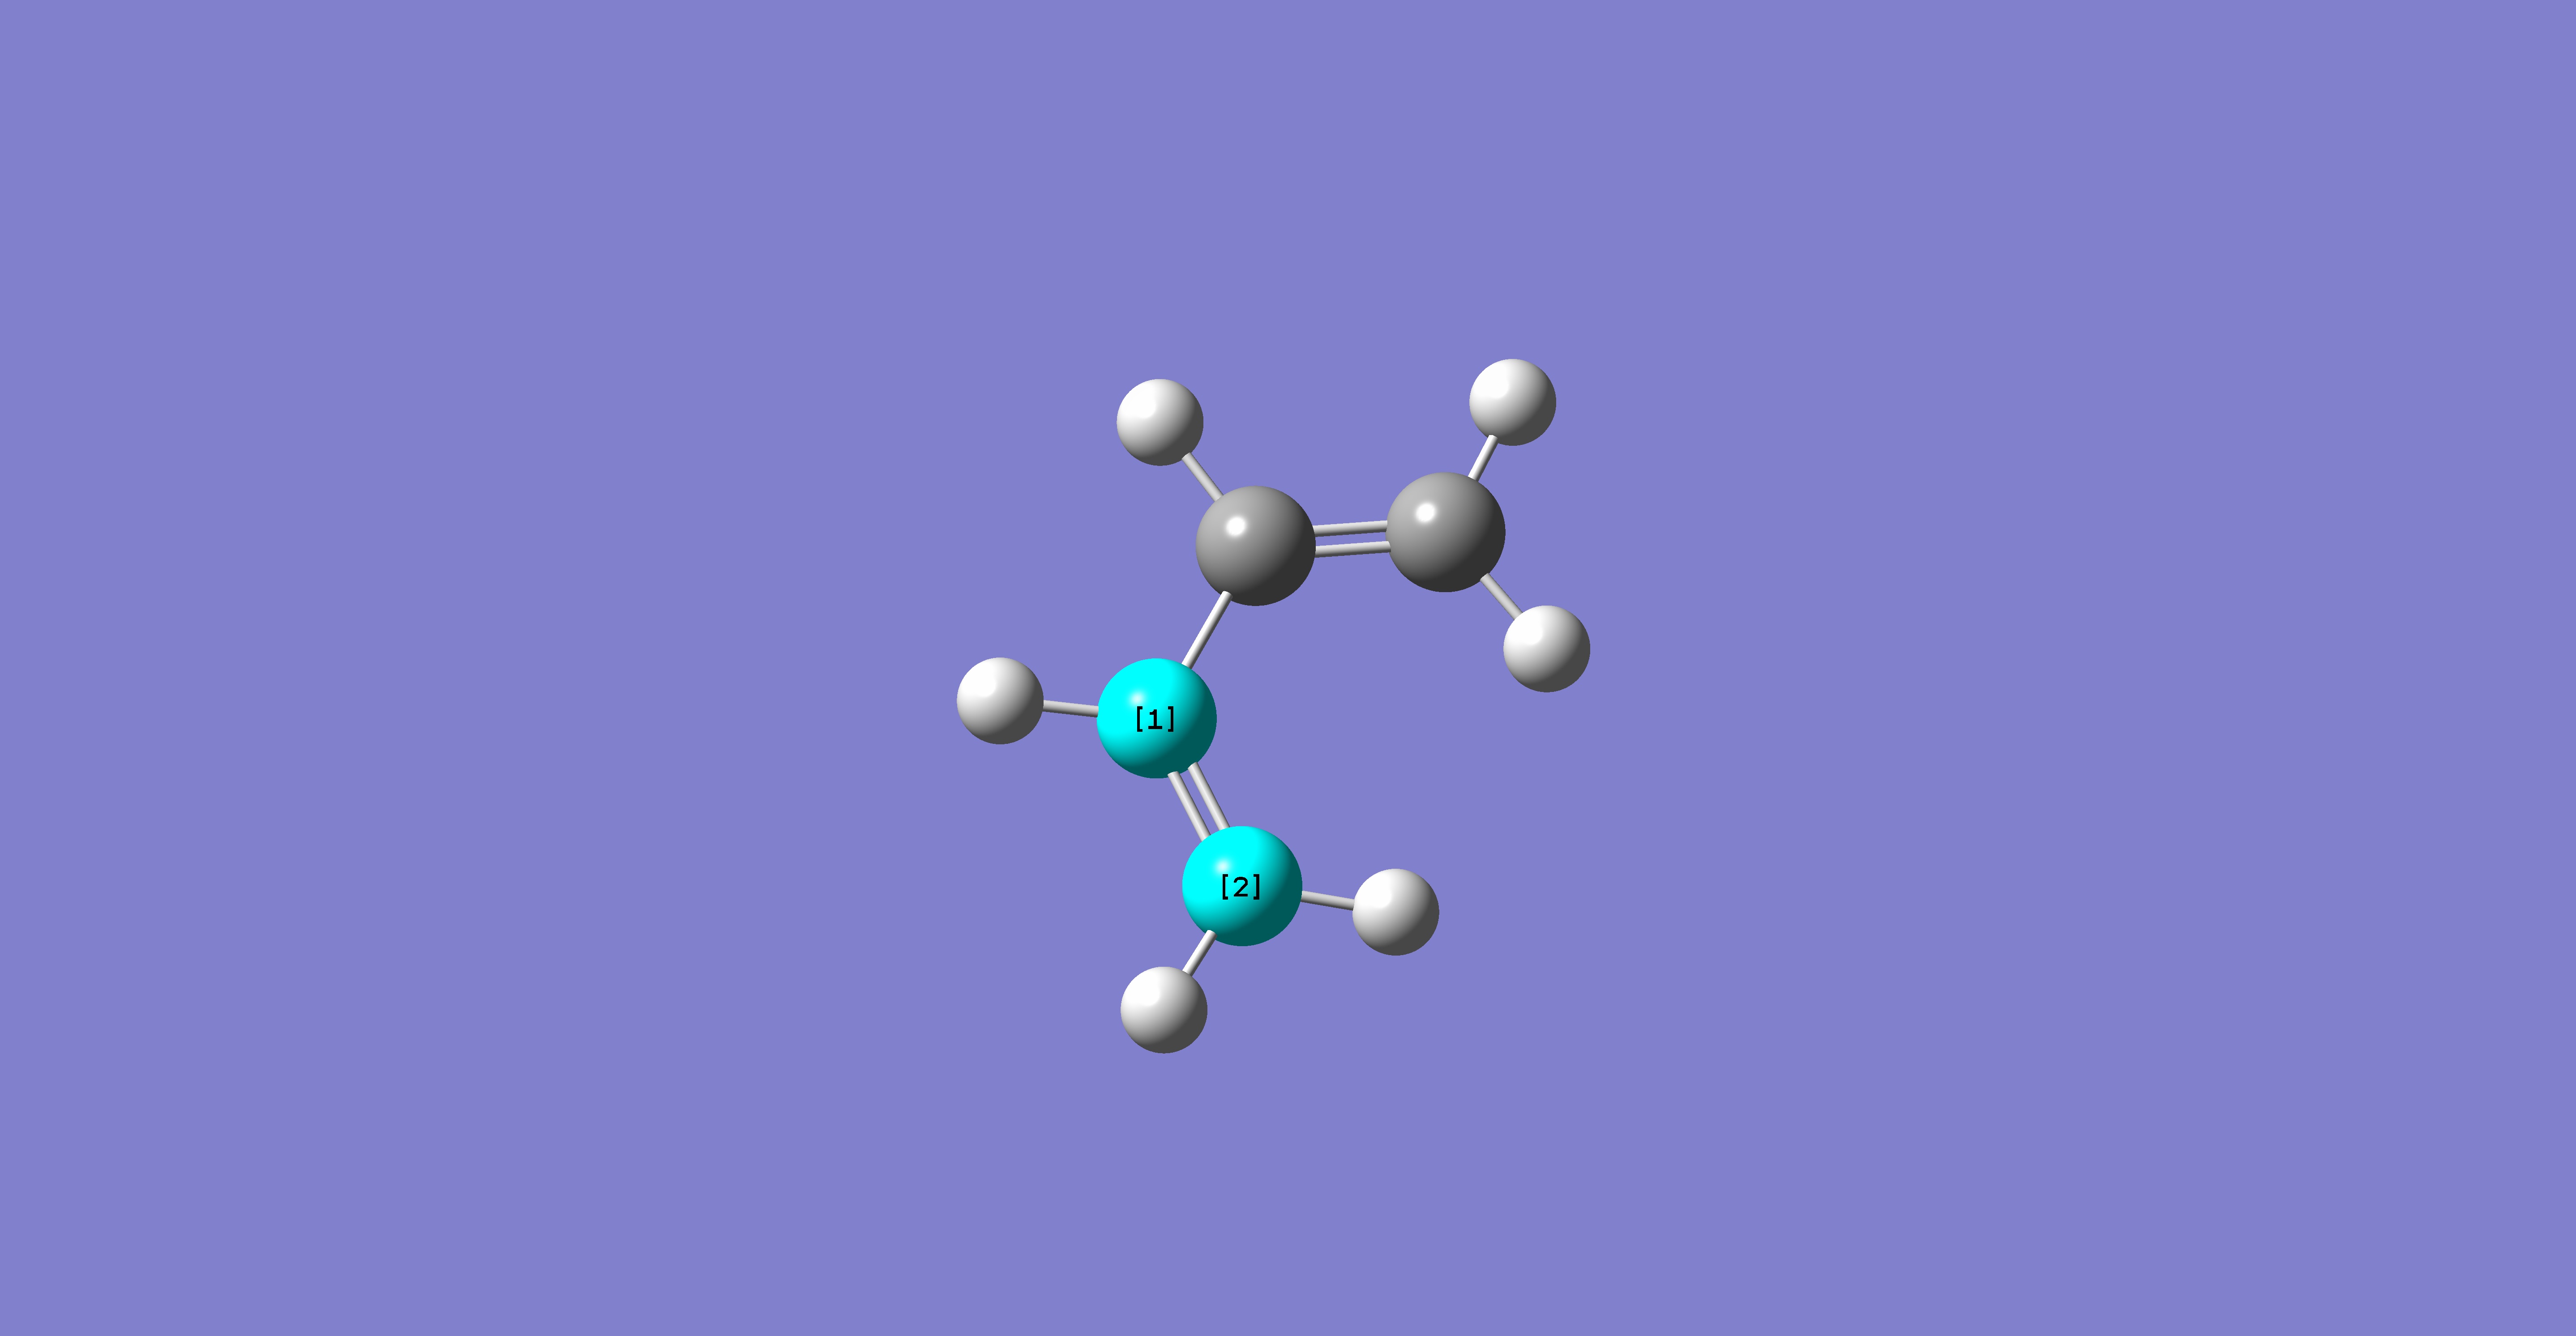
Table 15: Molecular Orbitals of Cis-Butadiene | |||
| Molecular Orbital | Image | Symmetry with
Respect to Plane | |
| HOMO | 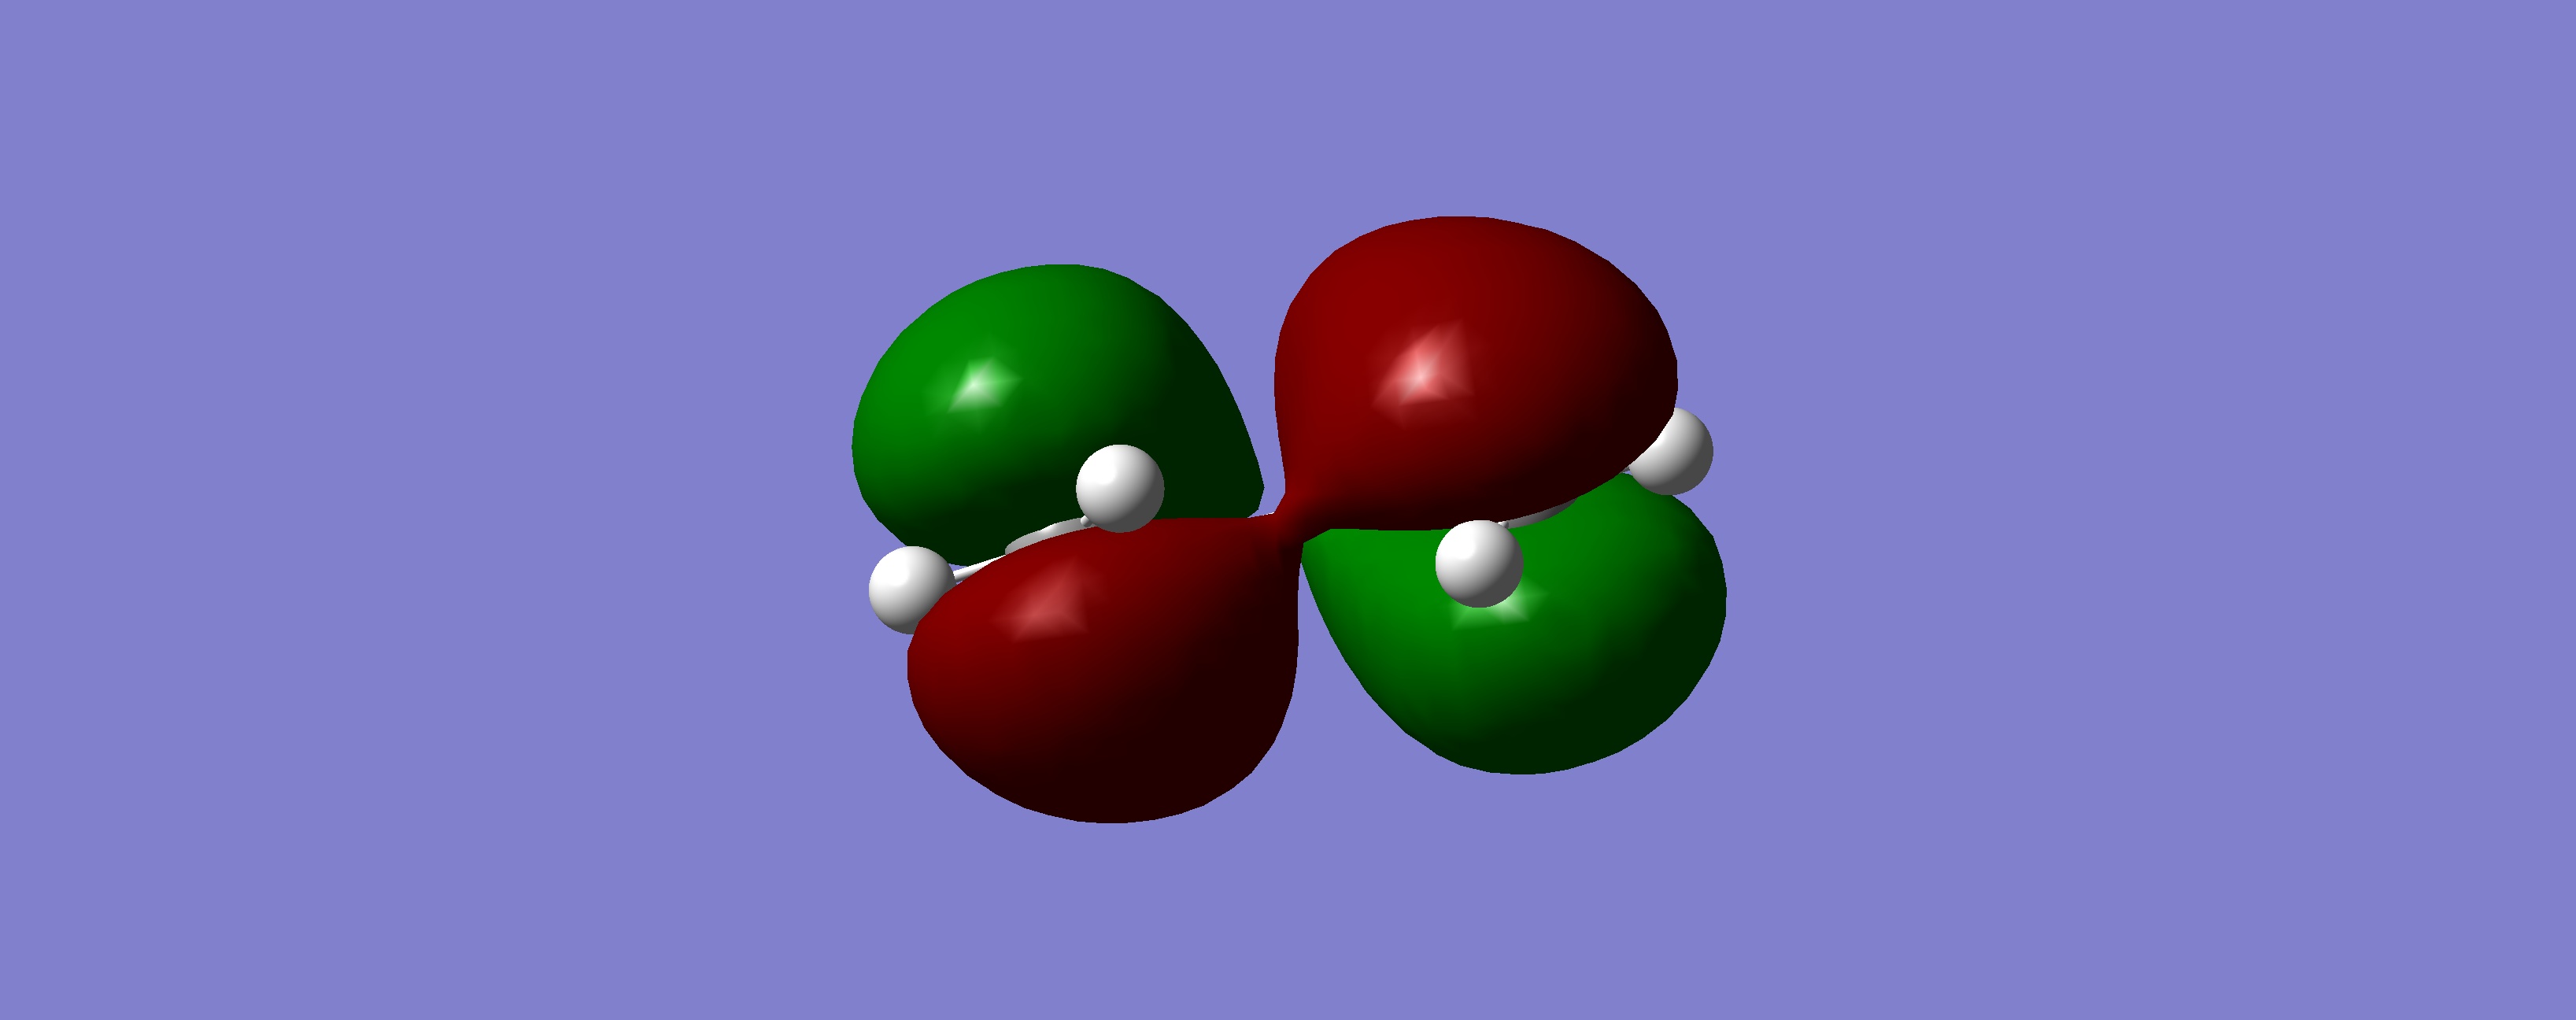
|
Antisymmetric | |
| LUMO | 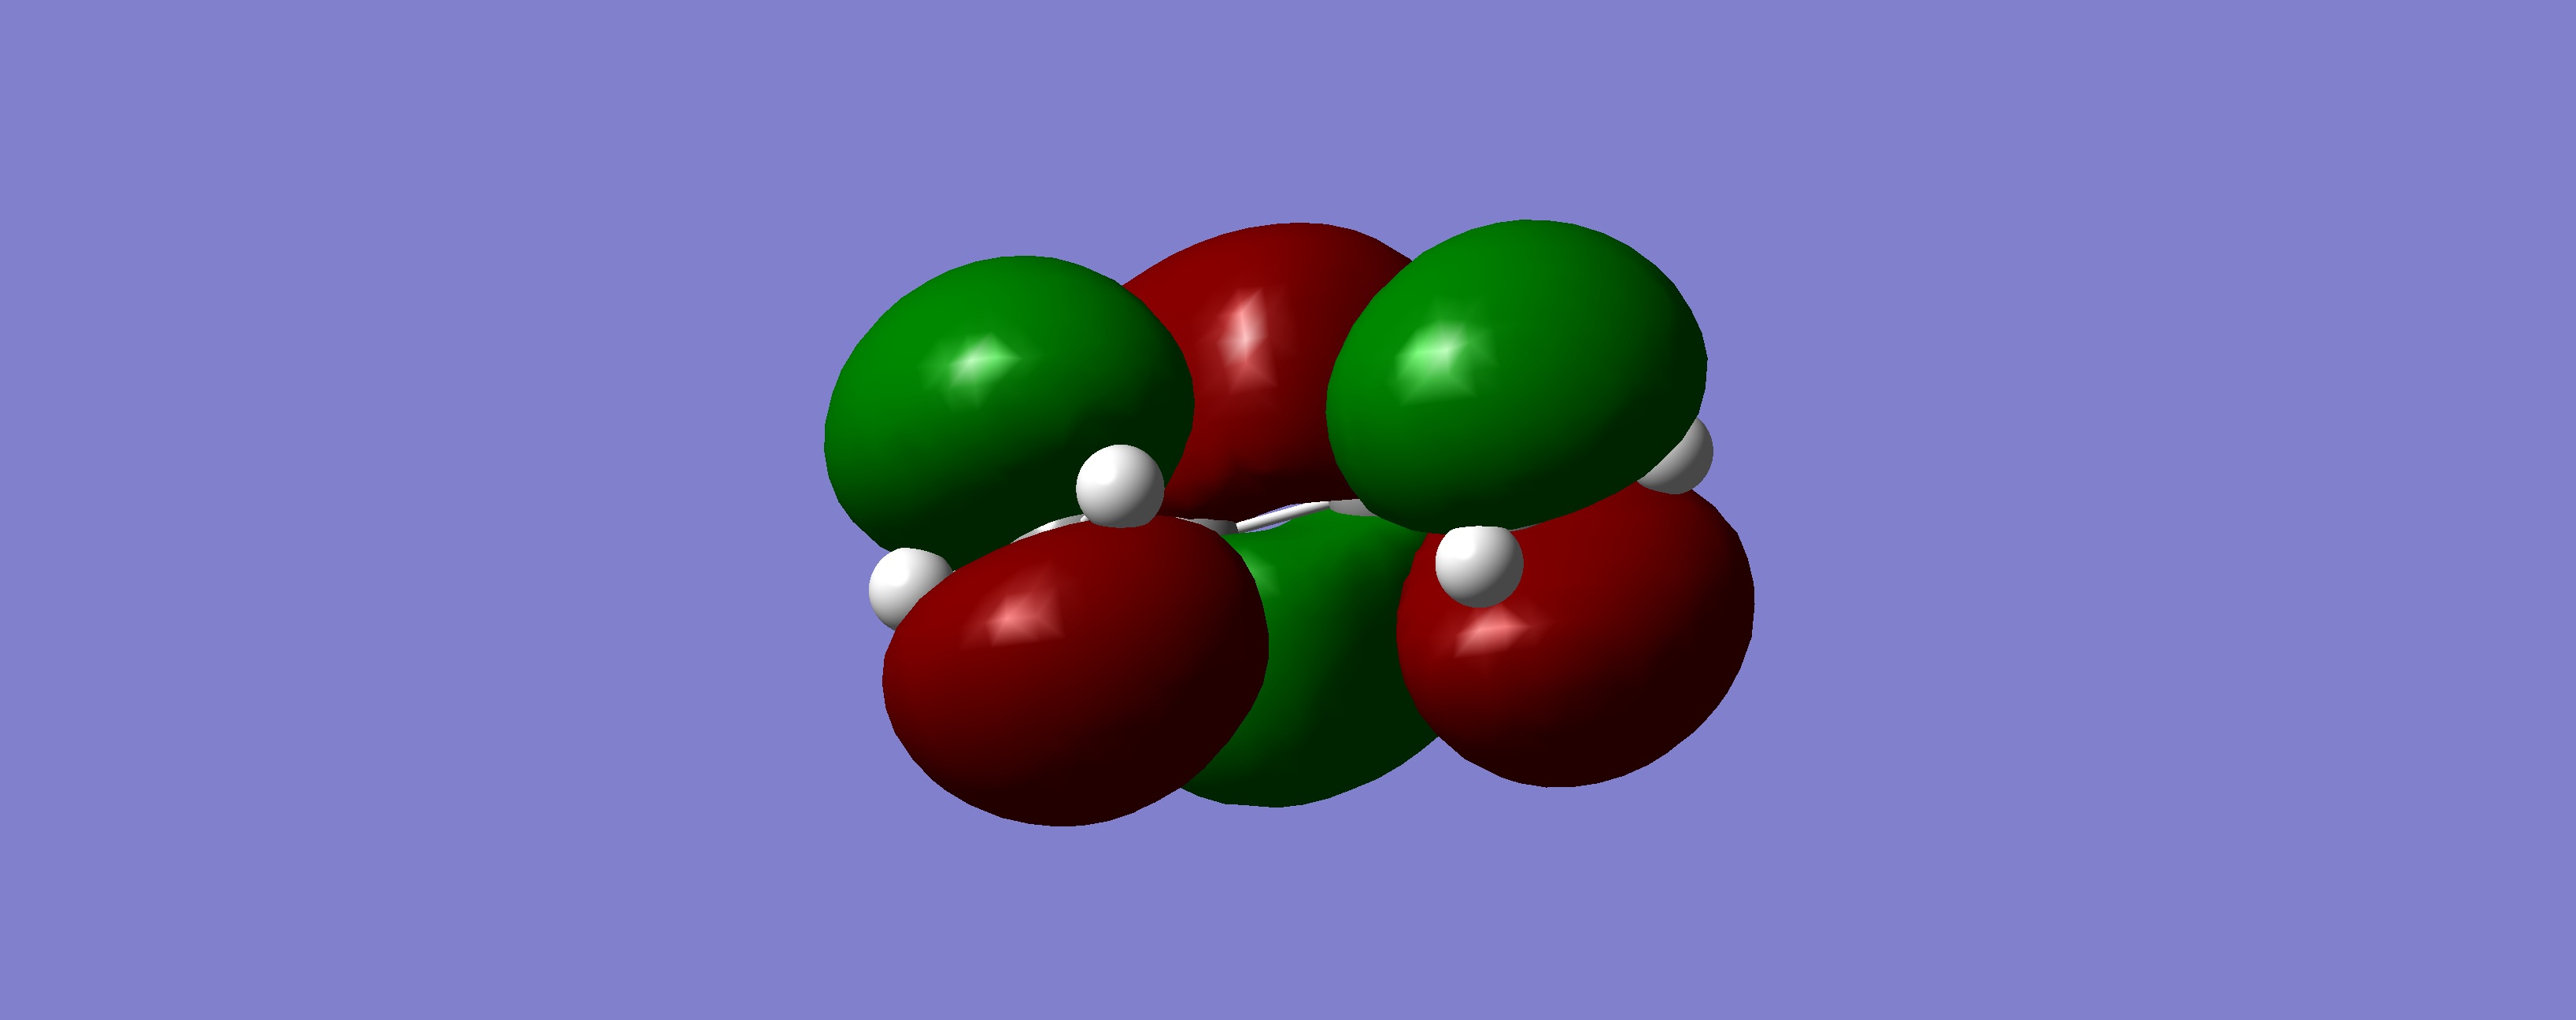
|
Symmetric | |
https://www.ch.ic.ac.uk/wiki/images/8/87/CIS_BUTADIENE_OPT.LOG
The same was done for ethylene
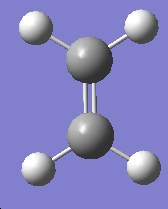
Table 16: Molecular Orbitals of Ethylene | |||
| Molecular Orbital | Image | Symmetry with
Respect to Plane | |
| HOMO | 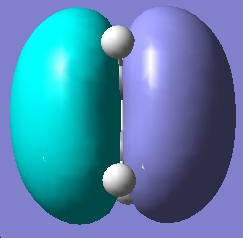
|
Symmetric | |
| LUMO | 
|
Antisymmetric | |
https://www.ch.ic.ac.uk/wiki/images/6/62/Ethylene_mo.log
Part (ii)
Using the optimised forms of the butadiene and ethylene fragement, the two were pasted onto the same molgroup file, and were positioned in a guess structure, setting the bond forming/breaking distance to 2.2Ă. The molecule was then optimised to a TS Berny, rather than a minimum, calculating the force constants once, and "opt=noeigen" in the keywords, and finally using the HF/3-21G method and basis set. The following results were obtained:
Table 17: Initial Optimisation of Transition State | ||||
| Conformer | Structure | Point Group | Energy/Hartrees
HF/3-21G |
Imaginary Frequency/cm-1 |
| Chair Transition State | 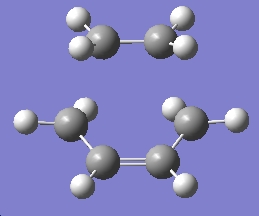
|
Cs | -231.60321 | -818.38 |
https://www.ch.ic.ac.uk/wiki/images/6/64/Ts_guess.log
The imaginary frequency corresponded to the following motion:

Which as can be seen, does correspond to the formation and breaking of bonds in the transition structure, and that the formation of the two bonds synchronous, i.e. both bonds form at the same time. We can compare this imaginary frequency to the lowest positive frequency, which has a value of 166.56cm-1, and this frequency corresponds to the following motion:
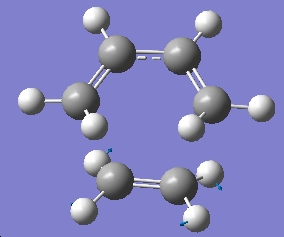
Here we see that the lowest frequency correspnds to a rocking of the two parts of the transition structure, compared with the imaginary frequency which is a bending motion.
Next another optimisation was run, this time using the semi-empircal/AM1 method, so as to calculate the molecular orbitals of the transition state.
Table 18: Molecular Orbitals of Transition State | |||
| Molecular Orbital | Image | Symmetry with
Respect to Plane | |
| HOMO | 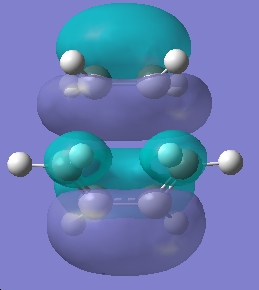
|
Symmetric | |
| LUMO | 
|
Symmetric | |
https://www.ch.ic.ac.uk/wiki/images/b/b6/TS_MO.LOG
Using the investigate tools in Gaussview, the follwing information about the transition state was available:
Table 19: Geometry of Transition State | |||
| Bond Lengths of Partly
Formed σ C-C bonds/Ǎ |
Average sp3
Bond Length/Ǎ |
Average sp2
Bond Length/Ǎ |
van der Waals radius
of the C atom/Ǎ[1] |
| 2.21 | 1.39 | 1.37 | 1.70 |
What we can see by examining the frontier orbitals of the reactants, is that it is in fact the HOMO of ethylene and the LUMO of butadiene which react to from the transition state and then the product. We notice that both the molecular orbitals have the same symetry, both are symmetric with respect to the plane. We can also note that the reaction is allowed due to the fact that it is a six electron process, and therefore conforms to the 4n+2 rule under thermal conditions. The two molecular orbitals therefore react via a suprafacial conformation.
- ↑ A. Bondi; J. Phys. Chem., 1964, 68 (3), pp 441–451. DOI:10.1021/j100785a001
Part (iii)
The aim of this part of the report is to Study the regioselectivity of the Diels Alder Reaction, by computing the exo and endo confomrers of the transition state of the reaction between cyclohexa-1,3-diene with maleic anhydride. The reaction is kinetically controlled, the exo transition state should therfore be higher in energy, due to greater steric congestion.
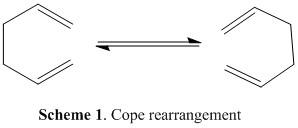
Firstly the endo transition state was modelled by drawing out the two fragments, and positioning them in a guess structure, setting the bond forming/breaking distance to 2.2Ă. The molecule was then optimised to a TS Berny, rather than a minimum, calculating the force constants once, and "opt=noeigen" in the keywords, and finally using the HF/3-21G method and basis set.
Table 20: Optimisation of Endo Transition State | ||||
| Conformer | Structure | Point Group | Energy/Hartrees
HF/3-21G |
Imaginary Frequency/cm-1 |
| Endo Transition State | 
|
Cs | -606.35754 | -645.29 |
Upon inspection of the results, only one negative frequency was present, indicating that the optimised structure is indeed a transition state. A visulaisation of its motion is represented in the picture below:

This visualisation shows us that the negative frequency corresponds to the synchronous formation of the two σ bonds, and also the elongating and breaking of the π bonds. This result confirms to us that the reaction is indeed a pericylcic cycloaddition.
Using the checkpoint file from the optimisation, and editing the MOs, it was possible to view the HOMO and LUMO of the transition state.
Table 21: Molecular Orbitals of Endo Transition States | |||
| Molecular Orbital | Image | Symmetry with
Respect to Plane | |
| HOMO | 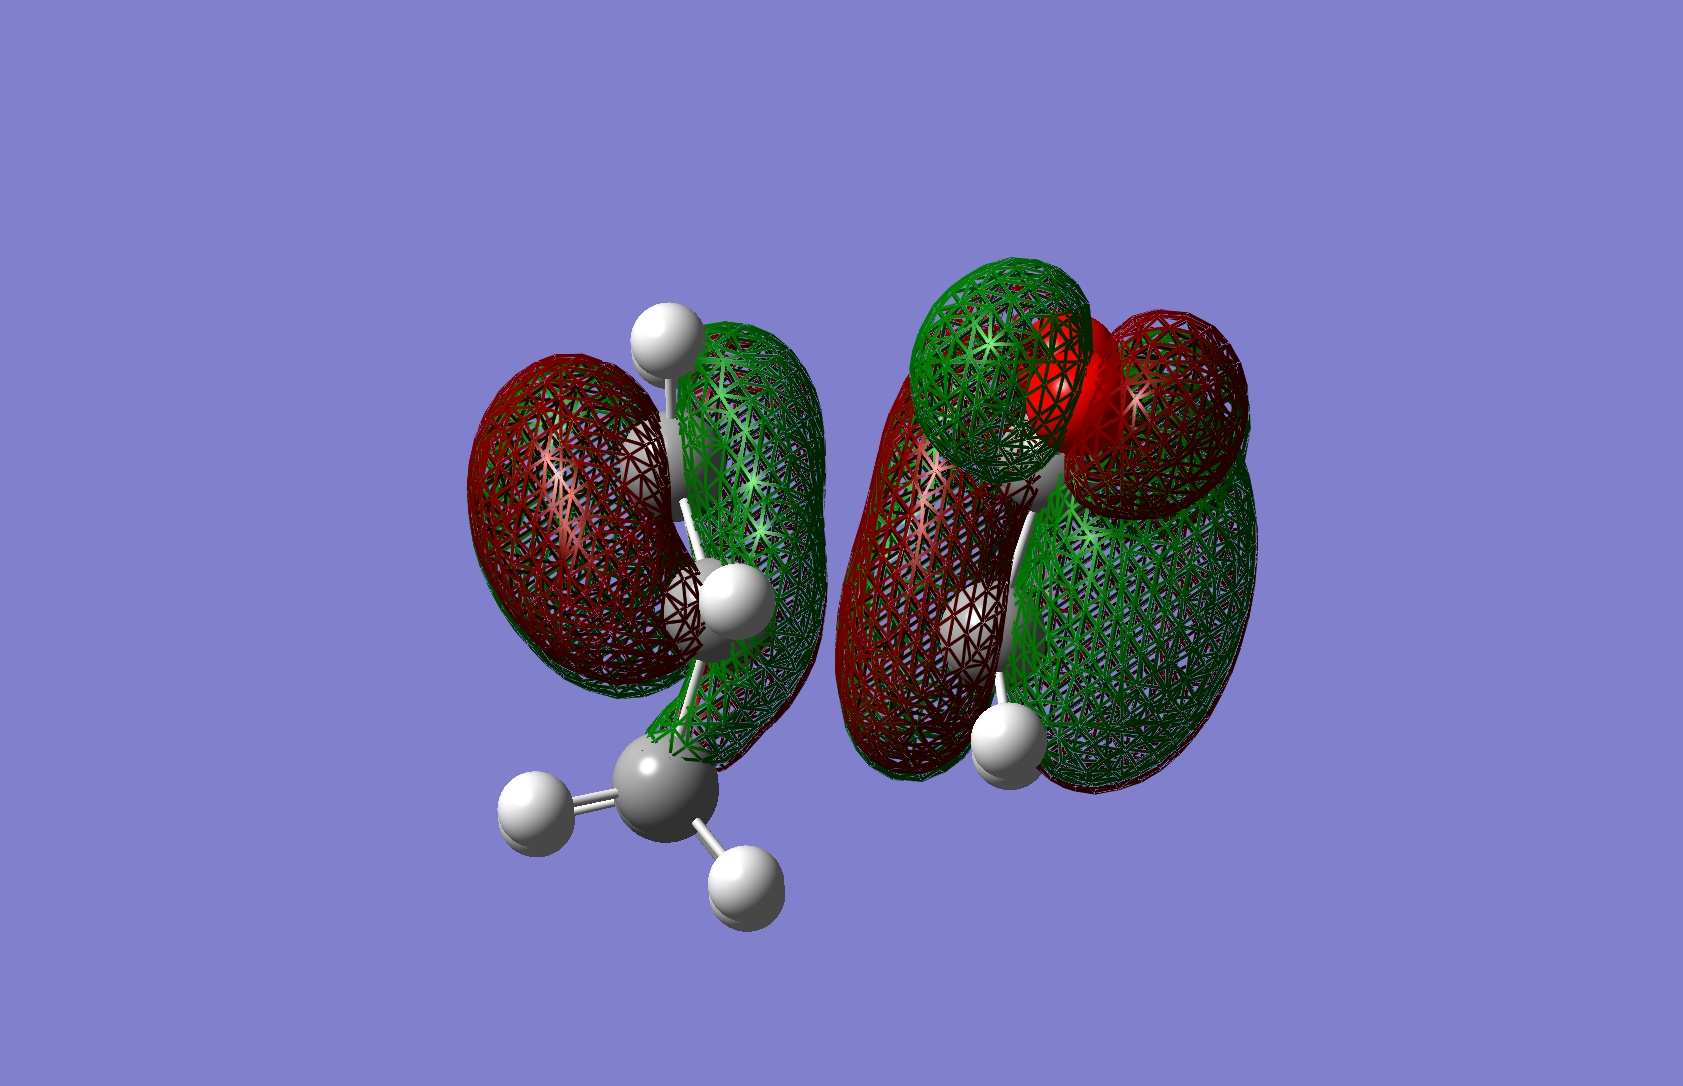
|
Antisymmetric | |
| LUMO | 
|
Antiymmetric | |
Again using the inspection tools in Gaussview the follwing information was available:
Table 22: Geometry of Endo Transition State | ||
| Bond Lengths of Partly
Formed σ C-C bonds/Ǎ |
C-C Through Space Distance Between
the C=O-CO-C=O- Fragment and -CH2=CH2-/Ǎ |
Other C-C DIstances/Ǎ |
| 2.24 | 2.84 | 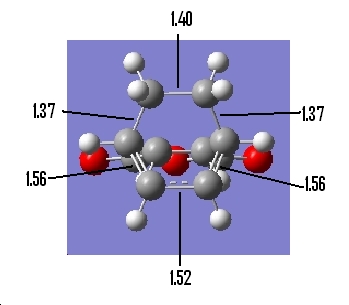
|
https://www.ch.ic.ac.uk/wiki/images/5/52/ENDO_TS.LOG
The same was done for the exo transition state:
Table 23: Optimisation of Exo Transition State | ||||
| Conformer | Structure | Point Group | Energy/Hartrees
HF/3-21G |
Imaginary Frequency/cm-1 |
| Exo Transition State | 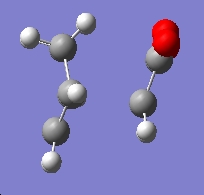
|
Cs | -605.60359 | -647.54 |
https://www.ch.ic.ac.uk/wiki/images/4/4f/Exo_ts_final.log
Again we have one negative frequency which corresponds to the fact that we have optimised a transition state. A visulaisation of the frequency can be seen below:
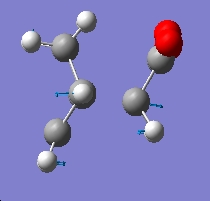
In comparing the endo and exo forms, we see that both have very similar negative frequencies, and indeed that both correspond to the synchronous formation of the two σ bonds, and also the elongating and breaking of the π bonds, and again that the reaction is indeed a pericylcic cycloaddition.
Table 24: Molecular Orbitals of Exo Transition State | |||
| Molecular Orbital | Image | Symmetry with
Respect to Plane | |
| HOMO | 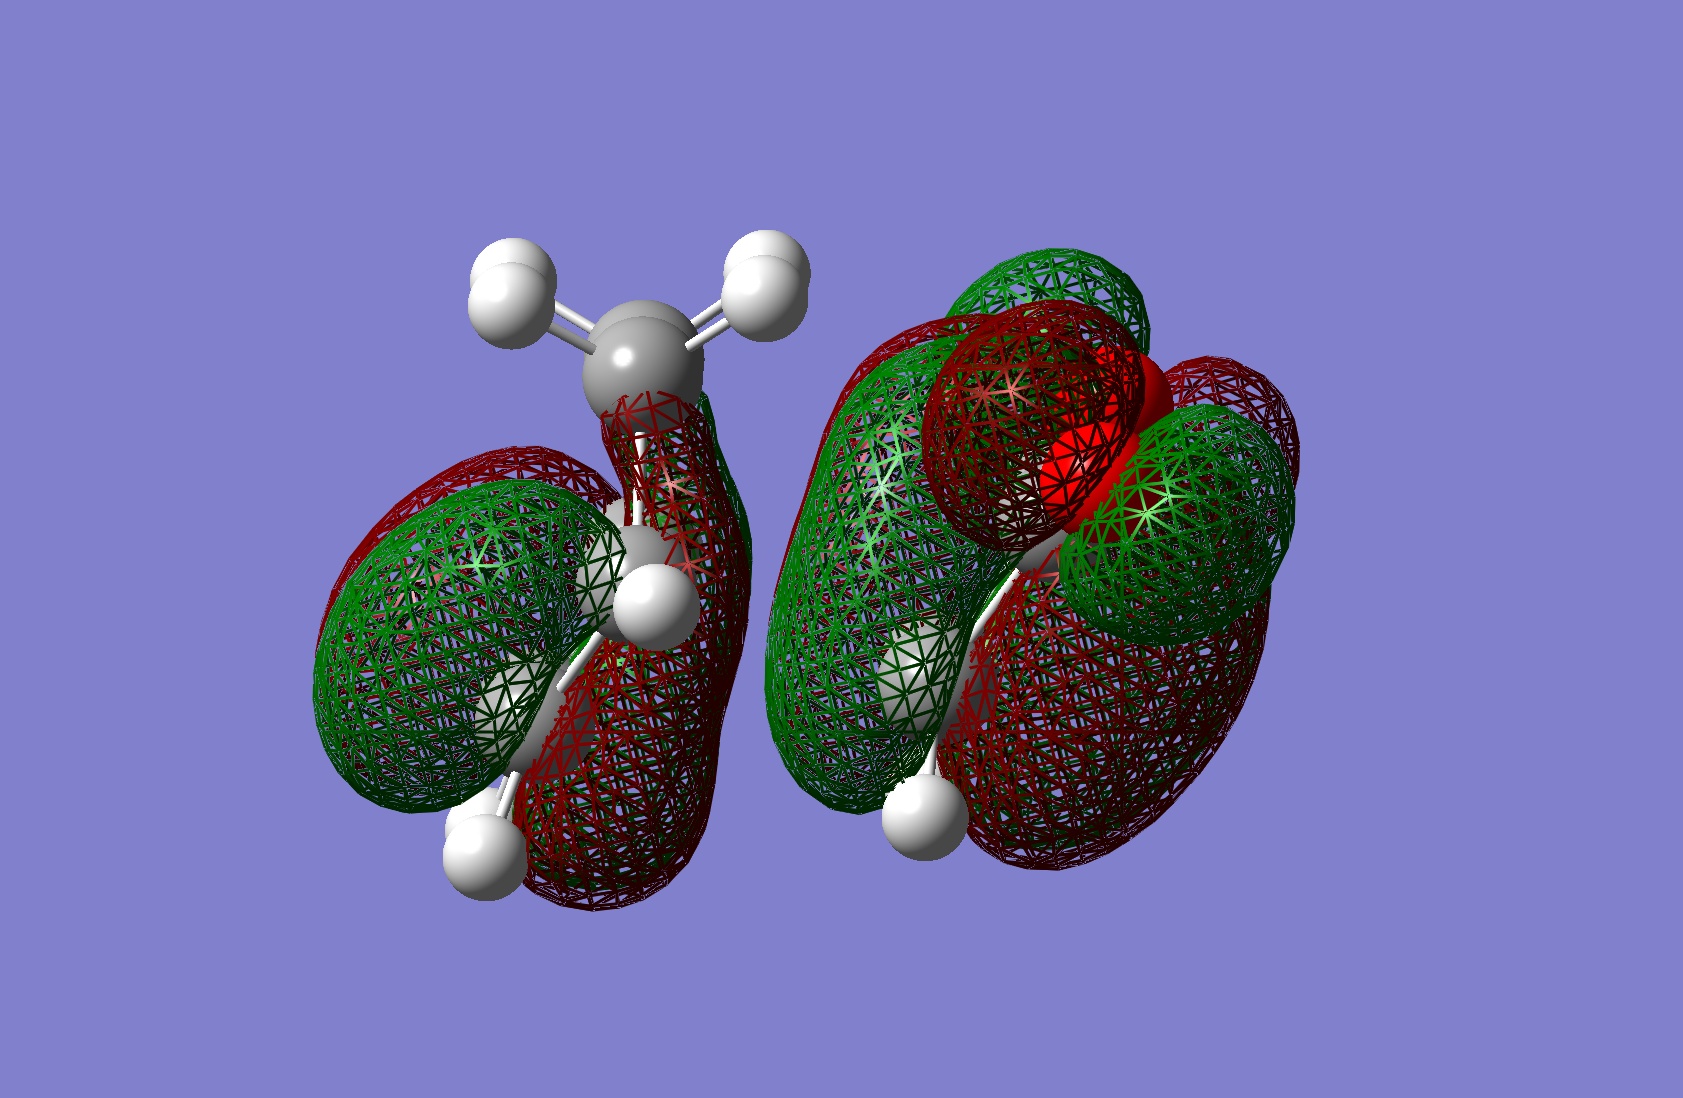
|
Antisymmetric | |
| LUMO | 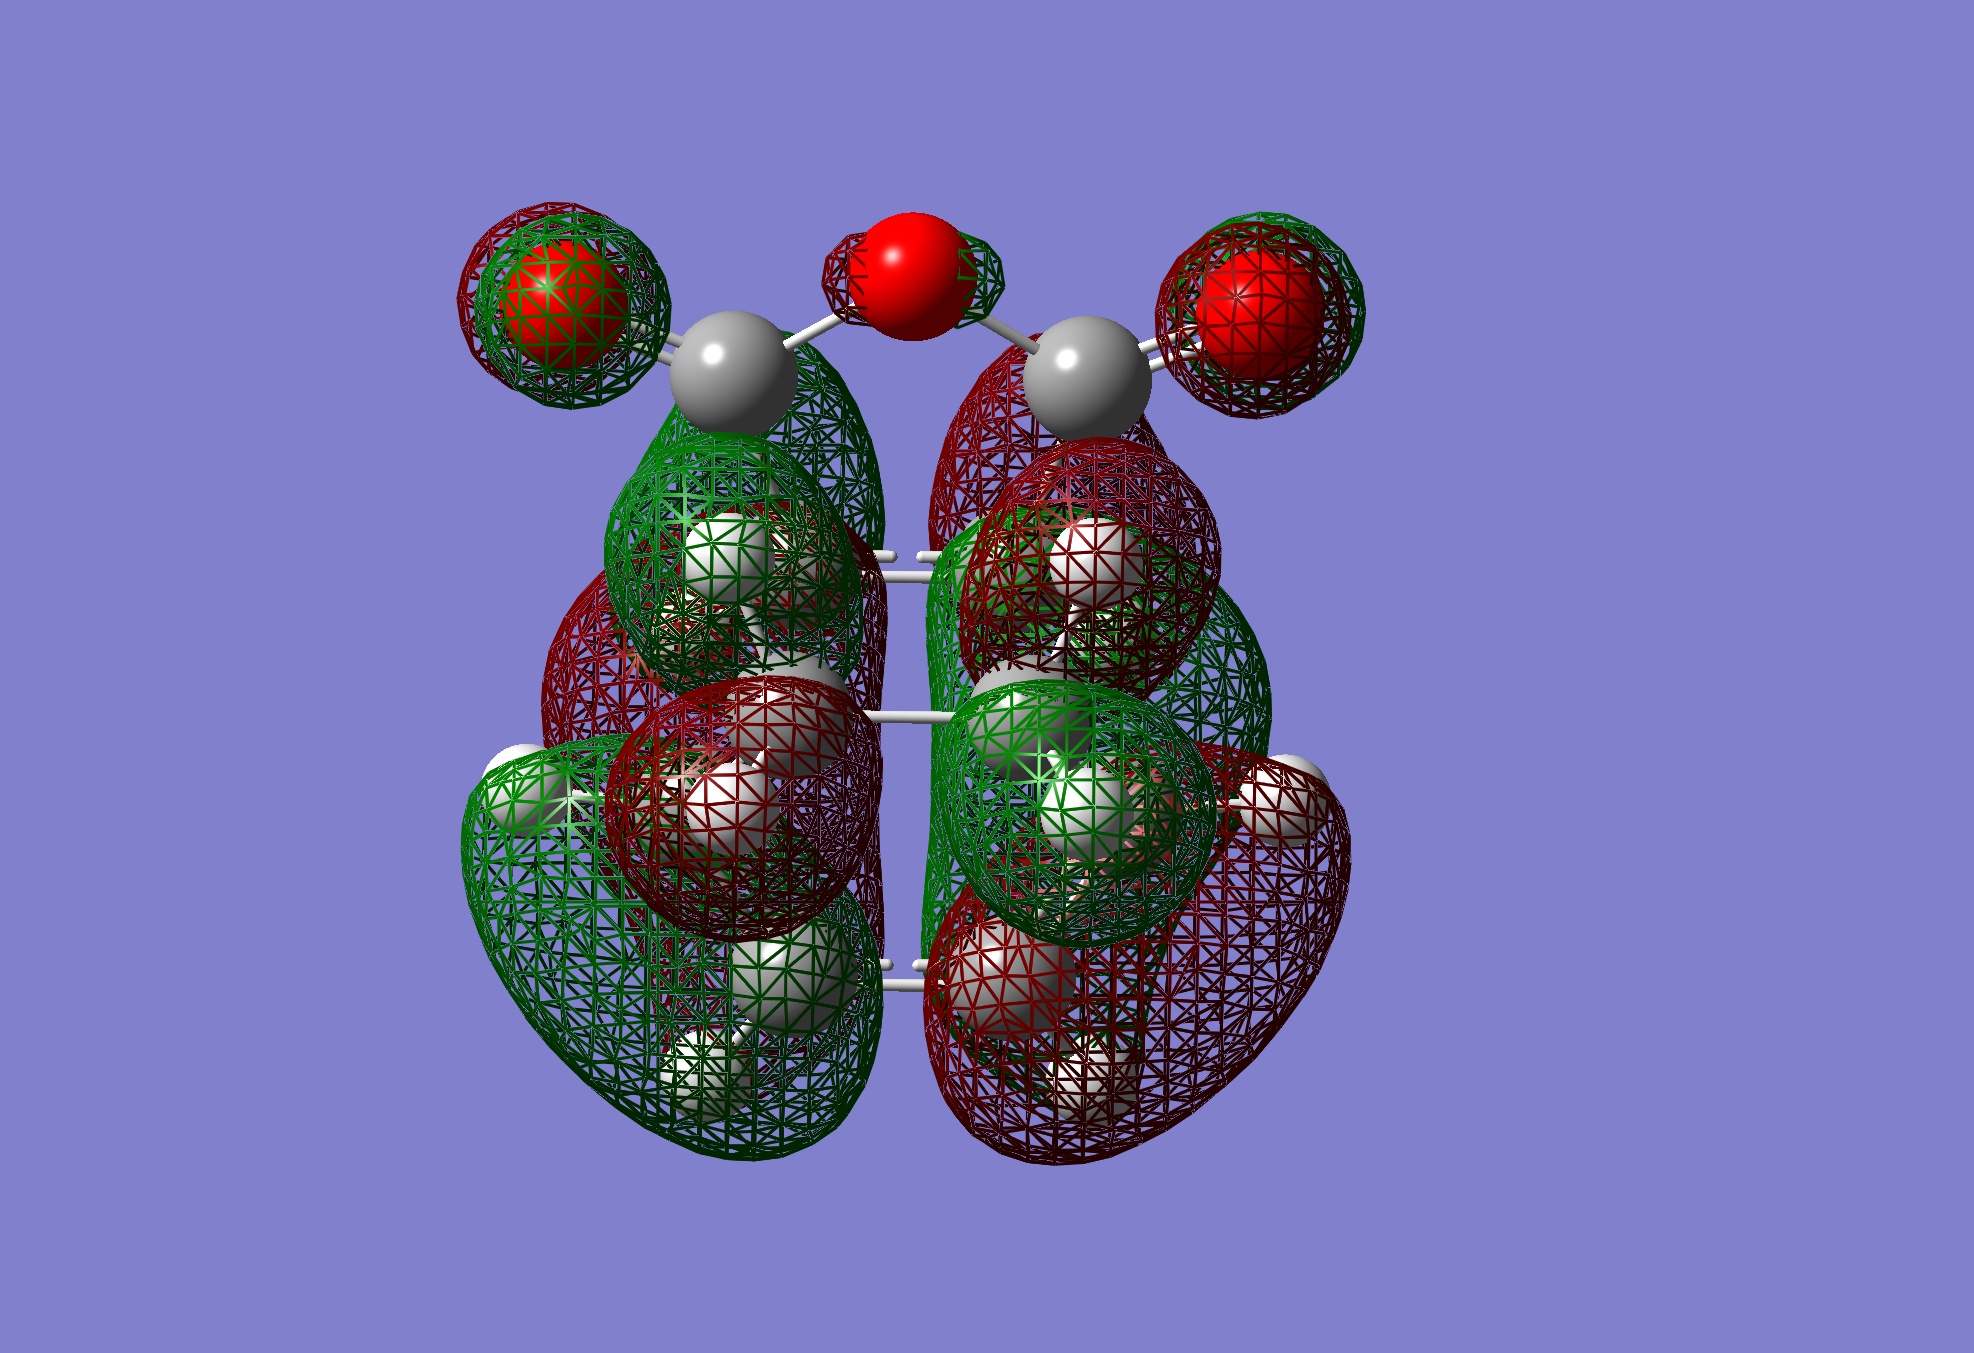
|
Antisymmetric | |
Table 25: Geometry of Exo Transition State | ||
| Bond Lengths of Partly
Formed σ C-C bonds/Ǎ |
C-C Through Space Distance Between
the C=O-CO-C=O- Fragment and -CH2-CH2-/Ǎ |
Other C-C DIstances/Ǎ |
| 2.26 | 2.92 | 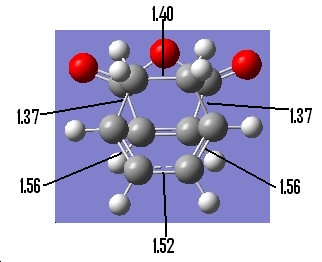
|
Now we are able to compare the endo and exo transition states relative geometries. What we notice is that in the exo transition state, the forming bonds are longer than in the endo conformation. As the new bonds are forming, we can see that there will be a much greater steric repulsion between the groups on the exo form, compared with the endo form, hence why the endo is kinetically more stable.
There is also a theory that there is a secondary oribtal overlap between the π bonds in the endo transition state, which corresponds to the the two groups being closer together, and a lowering of the overall energy of the transition state. We can examin the calculated molecular orbitals to investigate this. Secondary orbital interactions are not responsible for formal bonds, but attractive interactions between two sets of molecular orbitals.
Awc106 13:02, 27 February 2009 (UTC)

