Rep:Mod:asartor111inorganic
Days 1 & 2
BH3 Optimisation
Initial Optimisation
The .log file output of the B3LYP 3-21G optimisation can be found here. The 3-21G basis set used here is not very accurate but has the benefit of being very fast to compute.
| BH3 Optimisation | |
|---|---|
| File Name | AMS_BH3_OPT |
| File Type | .log |
| Calculation Type | FOPT |
| Calculation Method | RB3LYP |
| Basis Set | 3-21G |
| Charge | 0 |
| Spin | Singlet |
| E(RB3LYP) | -26.46226429 a.u. |
| RMS Gradient Norm | 0.00008851 a.u. |
| Imaginary Freq | |
| Dipole Moment | 0.0003 Debye |
| Point Group | CS |
| Job cpu time: 0 days 0 hours 0 minutes 49.0 seconds. | |
To check that the optimisation job did converge:
         Item               Value     Threshold  Converged?
 Maximum Force            0.000220     0.000450     YES
 RMS     Force            0.000106     0.000300     YES
 Maximum Displacement     0.000919     0.001800     YES
 RMS     Displacement     0.000447     0.001200     YES
 Predicted change in Energy=-1.672479D-07
 Optimization completed.
6-31G Optimisation
The initial rough optimisation using the 3-21G basis set was then taken as a starting point for the optimisation using a more accurate basis set, 6-31G(d,p). The .log output file of the second optimisation can be accessed here.
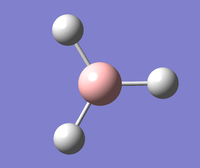
B3LYP 6-31G(d,p)
| BH3 Optimisation 6-31G(d,p) | |
|---|---|
| File Name | AMS_BH3_OPT_631G |
| File Type | .log |
| Calculation Type | FOPT |
| Calculation Method | RB3LYP |
| Basis Set | 6-31G(d,p) |
| Charge | 0 |
| Spin | Singlet |
| E(RB3LYP) | -26.61532361 a.u. |
| RMS Gradient Norm | 0.00000706 a.u. |
| Imaginary Freq | |
| Dipole Moment | 0.0001 Debye |
| Point Group | CS |
| Job cpu time: 0 days 0 hours 0 minutes 13.0 seconds. | |
         Item               Value     Threshold  Converged?
 Maximum Force            0.000012     0.000450     YES
 RMS     Force            0.000008     0.000300     YES
 Maximum Displacement     0.000061     0.001800     YES
 RMS     Displacement     0.000038     0.001200     YES
 Predicted change in Energy=-1.068331D-09
 Optimization completed.
|
|
The initial optimisation gave a total energy of -26.46226429 a.u., while the reoptimisation gave a total energy of -26.61532361 a.u., which is a slightly more negative value. The energy difference between them is 0.15305932 a.u., i.e. the 6-31G(d,p) structure is 401.9 kJmol-1 lower than that of the 3-21G structure. However, these energy values cannot be directly compared because the basis sets are not the same, i.e. these energies cannot be used to make the claim that the second structure is more stable.
While the symmetry was not formally found to be the expected D3h due to a lack of accuracy in the calculation, when taking the values to the expected accuracy of 2 decimal places for bond lengths and 1 decimal place for bond angles, the system effectively does have this symmetry (all bond angles are the same at 120.0°, and all bond lengths are equivalent).
GaBr3 Optimisation
The .log output file of the optimisation can be accessed here. The calculation results are available on D-space[1].
The main difference between this method and that used for BH3 is the choice of basis set. Ga and Br are heavy elements with many electrons that experience relativistic effects, which the program cannot cope with using the standard Schrödinger equation.
Instead, pseudo potentials were used. The underlying assumption, which is made continuously in chemistry when discussing reactivity (e.g. arrow pushing in organic chemistry), is that bonding is controlled by the valence electrons and effectively unaffected by the core electrons. The core electrons are thus simply represented by an Effective Core Potential (ECP, or Pseudo-Potential, PP), while the calculation is performed normally on the valence electrons.
The chosen set, LanL2DZ, uses the Los Alamos ECP on heavier atoms (here for both Br and Ga). It is of a medium accuracy (again there is a trade-off between computational time requirement and accuracy).
As a starting geometry, the 6-31G(d,p)-optimised geometry of BH3 was loaded, and the B and H atoms replaced with Ga and Br atoms, respectively, in GaussView.
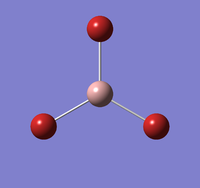
B3LYP LanL2DZ
| GaBr3 Optimisation | |
|---|---|
| File Name | ams_gabr3_opt_landl2dz |
| File Type | .log |
| Calculation Type | FOPT |
| Calculation Method | RB3LYP |
| Basis Set | LANL2DZ |
| Charge | 0 |
| Spin | Singlet |
| E(RB3LYP) | -41.70082783 a.u. |
| RMS Gradient Norm | 0.00000016 a.u. |
| Imaginary Freq | |
| Dipole Moment | 0.0000 Debye |
| Point Group | D3H |
| Job cpu time: 0 days 0 hours 0 minutes 23.1 seconds. | |
         Item               Value     Threshold  Converged?
 Maximum Force            0.000000     0.000450     YES
 RMS     Force            0.000000     0.000300     YES
 Maximum Displacement     0.000003     0.001800     YES
 RMS     Displacement     0.000002     0.001200     YES
 Predicted change in Energy=-1.282681D-12
 Optimization completed.
The symmetry was constrained to D3h. As expected, this resulted in a planar geometry where all bond angles were 120.0° and all Ga-Br bond lengths were the same (2.35 Å).
BBr3 Optimisation
The .log output file of the optimisation can be accessed here. The results are also available on D-Space[2].
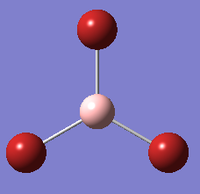
BBr3 is a molecule containing both heavy atoms (Br) for which pseudo-potentials are necessary, and a light atom (B) which does not require the use of a pseudo-potential. The input file was manually edited to allow for computation of the B atom using the 6-31G(d,p) basis set, and the Br atoms using the LanL2DZ set:
%chk=\\ic.ac.uk\homes\ams111\Year 3\IC\Day2\ams_bbr3_opt_gen.chk
# opt b3lyp/gen geom=connectivity pseudo=read gfinput

BBr3 Optimisation GEN

0 1
 B                  0.00000000    0.00001600    0.00000000
 Br                -2.00713716   -0.22758107    0.00000000
 Br                 1.20049864   -1.62454641    0.00000000
 Br                 0.80663875    1.85197008    0.00000000

 1 2 1.0 3 1.0 4 1.0
 2
 3
 4

B 0
6-31G(d,p)
****
Br 0
LanL2DZ
****

Br 0
LanL2DZ
| BBr3 Optimisation GEN | |
|---|---|
| File Name | ams_bbr3_opt_gen.log |
| File Type | .log |
| Calculation Type | FOPT |
| Calculation Method | RB3LYP |
| Basis Set | Gen |
| Charge | 0 |
| Spin | Singlet |
| E(RB3LYP) | -64.43644897 a.u. |
| RMS Gradient Norm | 0.00001048 a.u. |
| Imaginary Freq | |
| Dipole Moment | 0.0003 Debye |
| Point Group | CS |
| Job cpu time: 0 days 0 hours 0 minutes 20.1 seconds. | |
         Item               Value     Threshold  Converged?
 Maximum Force            0.000021     0.000450     YES
 RMS     Force            0.000011     0.000300     YES
 Maximum Displacement     0.000115     0.001800     YES
 RMS     Displacement     0.000063     0.001200     YES
 Predicted change in Energy=-2.469464D-09
 Optimization completed.
Structure Comparison
Given that calculated bond angles are generally only accurate to ~0.1°, all three molecules were shown to have bond angles of 120.0°, even without constraining the symmetry.
Similarly, even when the symmetry was not constrained, each molecule's bond distances were consistent within their accuracy of 0.01 Å. They are as follows:
| Molecule | Bond Length (Å) | |
|---|---|---|
| Calculated | Literature[3] | |
| BH3 | 1.19 | 1.1900 |
| GaBr3 | 2.35 | 2.249 |
| BBr3 | 1.93 | 1.893 |
Comparison to experimental values
The reported literature values for BBr3 and GaBr3 were measured by electron diffraction, while that for BH3 was measured by infrared spectroscopy. The calculated bond lengths represent the separation of the two atoms at the most stable state of the molecule (the optimised structure). Any experimental measurement of the bond length, however, will be affected by the fact that the atoms are vibrating.
Electron diffraction measurements show the average separation averaged over all populated vibrational states[3]. The calculated ideal geometry lies at the minimum of the potential energy function of the molecule; generally such potential energy functions are asymmetric, with the gradient being steeper when the atoms are closer together than equilibrium, and shallower when they are further apart. This means that, generally, when not at equilibrium, it is more favourable to be further apart than closer together. It is thus likely that the average bond length given by experimental data is longer than the ideal bond length at equilibrium.
This difference is readily apparent for the GaBr3 measurement, where the experimental value is 0.10 Å longer than the calculated value. For the BBr3 value, however, the experimental value is 0.04 Å shorter than the calculated bond length. Perhaps this means that the potential energy function for this molecule is unusual in its shape due to more complex effects, or perhaps the calculated geometry does not accurately represent the real structure, and so the molecule's properties are not representative.
Trends in bond length
The literature does agree with the calculated values in terms of the trend of bond lengths: the Ga-Br bonds are the longest, while the B-H bonds are the shortest.
Between BH3 and BBr3, the difference is a complete substitution of the ligands. This results in an increase of the bond length of 0.74 Å, from 1.19 to 1.93 Å. In terms of electron count, both are 'X-type' ligands, that is, they donate a single electron to the central atom. Bromine atoms, however, are much larger than hydrogen atoms in every way - they have more electrons, are heavier, and have a greater atomic radius (covalent radii[3]: H 0.32 Å, B 0.84 Å, Br 1.17 Å). The bromine atoms' steric size explains the increase in bond length; the sum of the atoms' covalent radii is larger.
By simply adding the elements' covalent atomic radii, the expected B-H bond length would be 1.16 Å, and that of B-Br 2.01 Å. The B-H bond is slightly longer than expected from this simple addition, whereas the B-Br bond is slightly shorter than expected. A possible explanation for this is that Br is more similar in size to B (Br ~40% larger than B) than H is (H ~60% smaller than B). A key factor of bond formation is the overlap integral of the involved orbitals; as B and Br are more similar in size, their overlap will be better, which improves the extent of bonding interaction and thus strengthens and consequentially shortens the bond relative to the expected value.
Between BBr3 and GaBr3, the difference is a substitution of the central atom. This results in an increase of the bond length by 0.42 Å, from 1.93 to 2.35 Å. Ga and B are in the same group, suggesting similar electronic behaviour, but gallium is two rows below boron and thus heavier and larger (covalent radius[3] 1.23 Å). The same two effects of this change are relevant as in the ligand discussion. The larger steric size of gallium means the Ga-Br bond is longer than the B-Br bond. By adding the covalent radii, the expected B-Br length is 2.01 Å while the expected Ga-Br length is 2.40 Å. This means that the Ga-Br bond is shorter than expected to an even greater extent than the B-Br bond, which corresponds to the fact that Ga is closer to Br in size (Ga is only ~5% larger than Br, while B is 28% smaller than Br).
What is a bond?
When working with Gaussian, there are occasions where no bond is drawn between two atoms where intuition suggests a bond should be present. Initially this may seem to be a cause for concern; however, Gaussian simply draws a bond when two atoms are within a certain distance of each other. This doesn't necessarily mean that there is no bond between these atoms, however. The nature of a chemical bond is hard to define. This topic was partially explored in a previous experiment (1C)[4]. The simplistic approach of drawing a bond between two atoms suggest that a chemical bond is a distinct physical phenomenon; however, this is not the case. Solving the Schrödinger equation does not result in such 'bonds' being visible[5].
One common way of describing a bond is as a favourable interaction between two atoms. This, however, leaves the distinction of precisely how favourable an interaction needs to be in order to count as a bond - a covalent bond, for example, is surely distinct from a hydrogen bond, or a weak van der Waals interaction. Also, the question of localisation must be answered; what if not just two atoms, but a greater number of them, are mutually attracted to each other? Is this a bond?
One theory to describe systems in terms of bonds is the Quantum Theory of Atoms in Molecules (QTAIM), which looks at the electron density distribution in a molecule. Because electrons tend to be attracted to positively charged nuclei, nuclei are represented by maxima in the electron density. Between these maxima, if there is a saddle point, described as the "bond critical point", this represents that the two nuclei are bonded to each other[5]. This topological approach allows for a quantification of the concept of a bond. It says nothing about the separation or nature of the atoms. This may suggest that GaussView's approach to drawing a bond between two atoms as long as they are sufficiently close is fundamentally wrong; however, in the vast majority of cases, bonded atoms are indeed at such distances. GaussView is, after all, mostly a tool for building structures that are then used for calculations - for this purpose, the simplified, intuitive approach to chemical bonds being lines connecting two atoms that are close together makes sense, as it allows the user to build the molecule according to his or her understanding.
Days 3 & 4
BH3 Frequency Analysis
The .log output file of the frequency analysis can be found here.
| BH3 Frequency | |
|---|---|
| File Name | ams_bh3_freq |
| File Type | .log |
| Calculation Type | FREQ |
| Calculation Method | RB3LYP |
| Basis Set | 6-31G(d,p) |
| Charge | 0 |
| Spin | Singlet |
| E(RB3LYP) | -26.61532361 a.u. |
| RMS Gradient Norm | 0.00000702 a.u. |
| Imaginary Freq | 0 |
| Dipole Moment | 0.0001 Debye |
| Point Group | CS |
| Job cpu time: 0 days 0 hours 0 minutes 22.0 seconds. | |
 Low frequencies ---  -25.0305  -12.9079   -0.0010    0.0006    0.0008   15.0420
 Low frequencies --- 1162.9967 1213.0340 1213.1468
The 'Low frequencies' were too high in magnitude and so the structure was re-optimised by adding in the keywords scf=conver=9 int=ultrafine, and ticking the 'Use tight convergence criteria' box. The .log output file of this repotimisation can be found here.
| BH3 Reoptimisation | |
|---|---|
| File Name | ams_bh3_reopt_631g |
| File Type | .log |
| Calculation Type | FOPT |
| Calculation Method | RB3LYP |
| Basis Set | 6-31G(d,p) |
| Charge | 0 |
| Spin | Singlet |
| E(RB3LYP) | -26.61532360 a.u. |
| RMS Gradient Norm | 0.00000594 a.u. |
| Imaginary Freq | |
| Dipole Moment | 0.0001 Debye |
| Point Group | CS |
| Job cpu time: 0 days 0 hours 0 minutes 17.0 seconds. | |
 Item               Value     Threshold  Converged?
 Maximum Force            0.000009     0.000015     YES
 RMS     Force            0.000007     0.000010     YES
 Maximum Displacement     0.000053     0.000060     YES
 RMS     Displacement     0.000034     0.000040     YES
 Predicted change in Energy=-7.783630D-10
 Optimization completed.
The frequency analysis was run again. The .log file can be found here.
| BH3 Reoptimised Frequency | |
|---|---|
| File Name | AMS_BH3_REOPT_FREQ_631G |
| File Type | .log |
| Calculation Type | FREQ |
| Calculation Method | RB3LYP |
| Basis Set | 6-31G(d,p) |
| Charge | 0 |
| Spin | Singlet |
| E(RB3LYP) | -26.61532360 a.u. |
| RMS Gradient Norm | 0.00000594 a.u. |
| Imaginary Freq | 0 |
| Dipole Moment | 0.0001 Debye |
| Point Group | CS |
| Job cpu time: 0 days 0 hours 0 minutes 28.0 seconds. | |
 Low frequencies ---  -19.8568  -17.0127   -9.6394   -0.0006   -0.0004    0.0008
 Low frequencies --- 1162.9117 1213.0852 1213.1686
While improved, the magnitudes are still slightly too large. One more optimisation was performed, this time also constraining the point group to D3h, with very tight tolerance. The .log output file can be accessed here.
| BH3 Reoptimisation Constrained | |
|---|---|
| File Name | AMS_BH3_REOPT_CONSTR_631G |
| File Type | .log |
| Calculation Type | FOPT |
| Calculation Method | RB3LYP |
| Basis Set | 6-31G(d,p) |
| Charge | 0 |
| Spin | Singlet |
| E(RB3LYP) | -26.61532364 a.u. |
| RMS Gradient Norm | 0.00000211 a.u. |
| Imaginary Freq | |
| Dipole Moment | 0.0000 Debye |
| Point Group | D3H |
| Job cpu time: 0 days 0 hours 0 minutes 30.0 seconds. | |
 Item               Value     Threshold  Converged?
 Maximum Force            0.000004     0.000450     YES
 RMS     Force            0.000003     0.000300     YES
 Maximum Displacement     0.000017     0.001800     YES
 RMS     Displacement     0.000011     0.001200     YES
 Predicted change in Energy=-1.021904D-10
 Optimization completed.
The frequency analysis .log output file is here.
| BH3 Reoptimisated Constrained Frequency | |
|---|---|
| File Name | AMS_BH3_REOPT_CONSTR_FREQ_631G |
| File Type | .log |
| Calculation Type | FREQ |
| Calculation Method | RB3LYP |
| Basis Set | 6-31G(d,p) |
| Charge | 0 |
| Spin | Singlet |
| E(RB3LYP) | -26.61532364 a.u. |
| RMS Gradient Norm | 0.00000215 a.u. |
| Imaginary Freq | 0 |
| Dipole Moment | 0.0000 Debye |
| Point Group | D3H |
| Job cpu time: 0 days 0 hours 0 minutes 25.0 seconds. | |
 Low frequencies ---  -11.7227  -11.7148   -6.6070   -0.0005    0.0278    0.4278
 Low frequencies --- 1162.9743 1213.1388 1213.1390
The frequencies are now all between -15 and 15 cm-1, indicating that the optimisation is of sufficient quality. All of the listed frequencies in the second row are positive, indicating that the optimisation did indeed find a minimum on the energy surface.
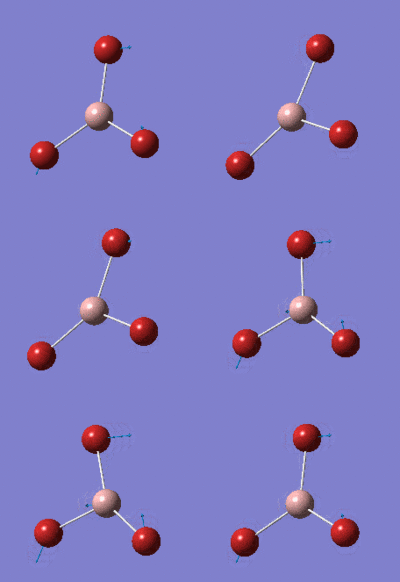
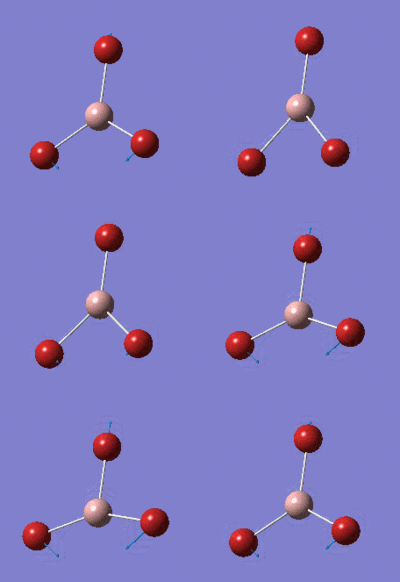
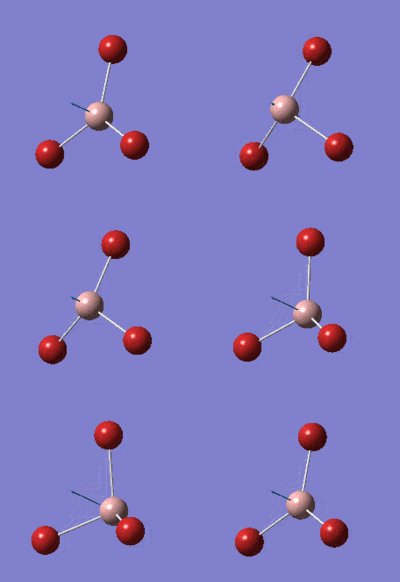
Vibrational Modes
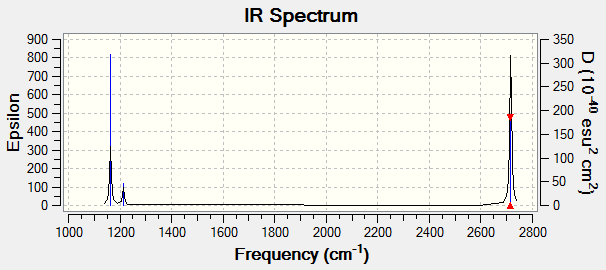
IR Spectrum
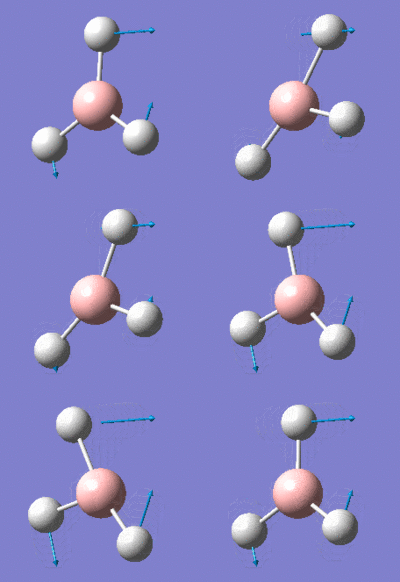
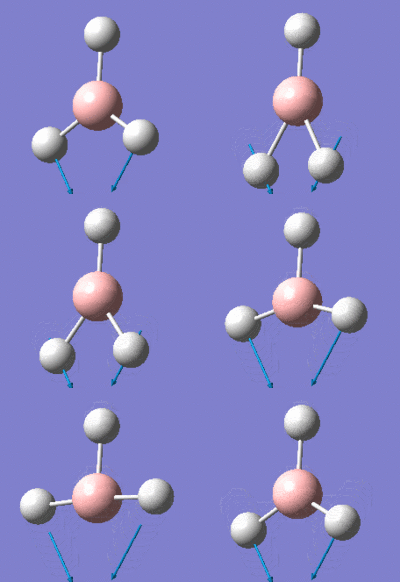
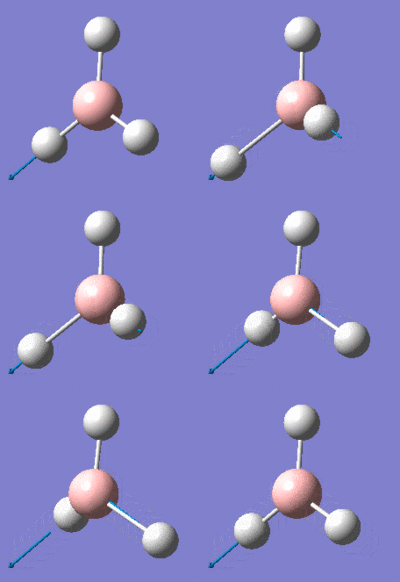
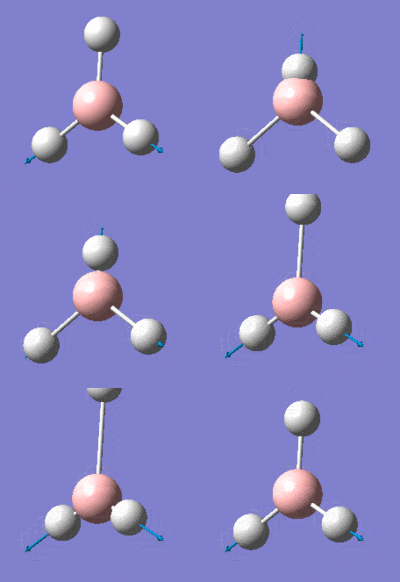
Despite there being six distinct vibrational modes, only three peaks are visible in the IR spectrum.
Mode 4 has an intensity of 0; it is not IR active because the totally symmetric vibration does not effect a change in the molecule's dipole moment. For this reason, the IR spectrum does not show a peak at its frequency.
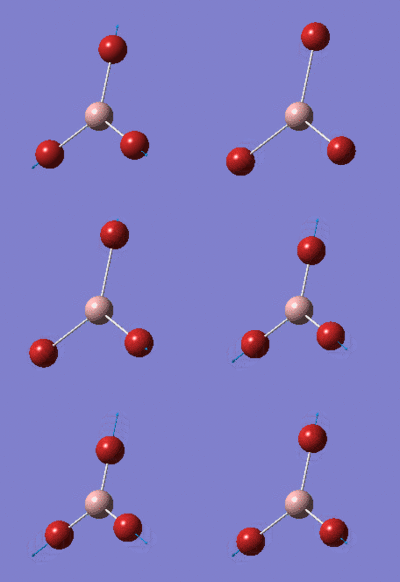
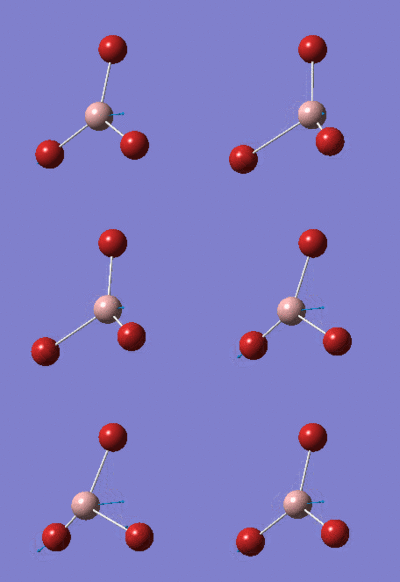
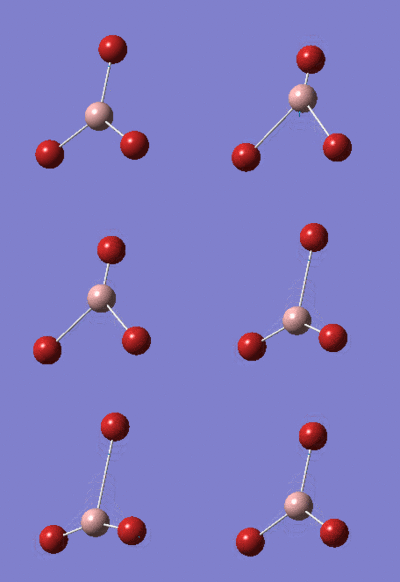
Modes 2 and 3 have the same calculated frequency. The peak at this frequency thus represents both of these IR-active 'wagging' modes of the molecule. The same applies to modes 5 and 6; they have the same frequency and the peak represents both IR-active stretching modes.
GaBr3 Frequency Analysis
Log file here. Results available on D-Space[6].
| GaBr3 Frequency | |
|---|---|
| File Name | ams_gabr3_freq_landl2dz |
| File Type | .log |
| Calculation Type | FREQ |
| Calculation Method | RB3LYP |
| Basis Set | LANL2DZ |
| Charge | 0 |
| Spin | Singlet |
| E(RB3LYP) | -41.70082783 a.u. |
| RMS Gradient Norm | 0.00000011 a.u. |
| Imaginary Freq | 0 |
| Dipole Moment | 0.0000 Debye |
| Point Group | D3H |
| Job cpu time: 0 days 0 hours 0 minutes 7.9 seconds. | |
 Low frequencies ---   -0.5252   -0.5247   -0.0024   -0.0010    0.0235    1.2010
 Low frequencies ---   76.3744   76.3753   99.6982
The negative sign in front of some of the rotational and translational frequencies does not actually represent a 'negative frequency' (this would be physically meaningless), but rather is an indicator that the frequency is imaginary rather than real. The lowest real mode listed is thus 0.0235 cm-1.
Vibrational Modes
IR Spectrum
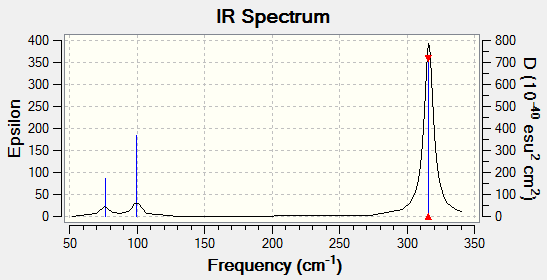
The IR spectrum is in decent agreement with that reported in the literature[7], which lists peaks at 349, 122 and 82 cm-1. The calculated values are 316, 100, and 76 cm-1, all but one of which lie within 10% of the experimental values, which is the accuracy usually associated with computed frequencies.
Comparison of BH3 and GaBr3 Vibrations
| No. | BH3 | GaBr3 | ||||
|---|---|---|---|---|---|---|
| Frequency (cm-1) | Intensity | Symmetry | Frequency (cm-1) | Intensity | Symmetry | |
| 1 | 1162.97 | 92.6 | A2" | 76.37 | 3.3 | E' |
| 2 | 1213.14 | 14.1 | E' | 76.38 | 3.3 | E' |
| 3 | 1213.14 | 14.1 | E' | 99.70 | 9.2 | A2" |
| 4 | 2582.58 | 0.0 | A1' | 197.34 | 0.0 | A1' |
| 5 | 2715.72 | 126.3 | E' | 316.18 | 57.1 | E' |
| 6 | 2715.72 | 126.3 | E' | 316.19 | 57.1 | E' |
The main difference between the vibrational modes of BH3 and GaBr3 is that, in the former, the central atom tends to vibrate with smaller magnitudes than the outer atoms, whereas in the latter, the magnitudes of the central atom are larger. This can be explained by the elements' relative masses; B is almost 11 times as heavy as H, whereas the masses of Ga and Br are within 15% of each other. Thus the relative energies of vibrations of B and H would be very uneven if they were to vibrate with the same magnitude; B requires more energy and thus moves less.
The frequencies of GaBr3 are much smaller. Using the following expression of the vibrational frequency ω in terms of the force constant k and the reduced mass μ:
It is clear that the much heavier masses of Ga and Br compared to B and H are causing this difference in vibrational frequency, as the frequency is inversely proportional to the square root of the reduced mass. The atoms are heavier and thus would require far more energy to reach similar vibrational frequencies.
Between BH3 and GaBr3, the three lower-frequency modes are reordered; in BH3 the degenerate set is at a higher frequency than the A1' bend, but at a lower frequency for GaBr3. This suggests that the out-of-plane 'wagging' mode is of higher relative energy in GaBr3. Perhaps this is due to the larger atoms present in GaBr3; in this fairly symmetrical vibrational mode, the large Br atoms never have the opportunity to move away from each other, and thus likely experience greater repulsive steric effects than the H atoms in the BH3 case.
In both cases, the frequencies can be split into two 'groups': the first three modes are of similar frequencies, and the remaining three are similar to each other and significantly higher. This makes sense because the groups of three are similar modes; the first three are involve wagging-type motions, whereas the remaining three involve stretching motions. These bond stretching vibrations occur at a high frequency, proportional to the square root of the bond's strength.
Discussion of Frequency Analysis
It is important to use the same calculation setup when the intention is to compare to molecules. Different basis sets result in different potential surfaces representing the electron clouds, and as it is these potential surfaces (and particularly their gradients, i.e. derivatives of the function) that give us the "physical" phenomena, changing the udnderlying surface obviously fundamentally changes the results. The choice of basis set must be made intelligently, ideally by comparing the results of a series of calculations to literature to see which fits best. Ideally we'd be able to "look" at real molecules and see which surface is closer to real electron clouds; alas! We'll have to make do with comparing calculated data to that which can be experimentally determined. Once we have identified the best basis set given the conditions, we can then compare molecules to each other that have been optimised using the same basis set.
Similarly, it is important to use the same basis set for the frequency analysis as for the geometry optimisation. The geometry optimisation uses the potential surfaces from the provided basis set and finds an ideal geometry for these surfaces; it would be meaningless to then attempt to analyse the gradients and second derivatives of a completely different set of surfaces in the frequency analysis! The point of the frequency analysis is to reveal more information about the optimised geometry, and so the calculations must be consistent.
The frequency analysis has two main purposes. The first is that it gives us the vibrational modes and the frequencies, which is interesting information in its own right and also allows for comparison with literature in the form of experimental IR spectra. The second is that it calculates the second derivatives of the potential energy plot, which indicates whether the stationary point we found in the optimisation step is a maximum or minimum; we want it to be a minimum (positive second derivative, i.e. positive frequencies) as this represents a stable conformer (whereas a maximum indicates a transition state between them). A negative second derivative corresponds to a maximum on the curve, and so the fact that no negative frequencies exist is a quick check of whether the optimisation was successful.
The first row of the 'low frequencies' output corresponds to frequencies of rotational and translational modes of the molecule. Ideally these are zero, as the program is attempting to optimise a molecule in isolation and find its vibrational states without considering motion relative to other points in space (i.e. other molecules)[8]. However, due to inherent errors in the computational process, this is not actually the case, so the call has to be made on what is "close enough". The higher the level of calculation used, the closer the frequencies will be to zero.
BH3 MO Diagram
The results of the MO calculation are available on D-Space[9].
| BH3 MO Calculation | |
|---|---|
| File Name | AMS_BH3_REOPT_CONSTR_631G_MO |
| File Type | .fch |
| Calculation Type | SP |
| Calculation Method | RB3LYP |
| Basis Set | 6-31G(D,P) |
| Charge | 0 |
| Spin | Singlet |
| Total Energy | -26.61532363 a.u. |
| RMS Gradient Norm | 0.00000000 a.u. |
| Imaginary Freq | |
| Dipole Moment | 0.0000 Debye |
| Point Group | |
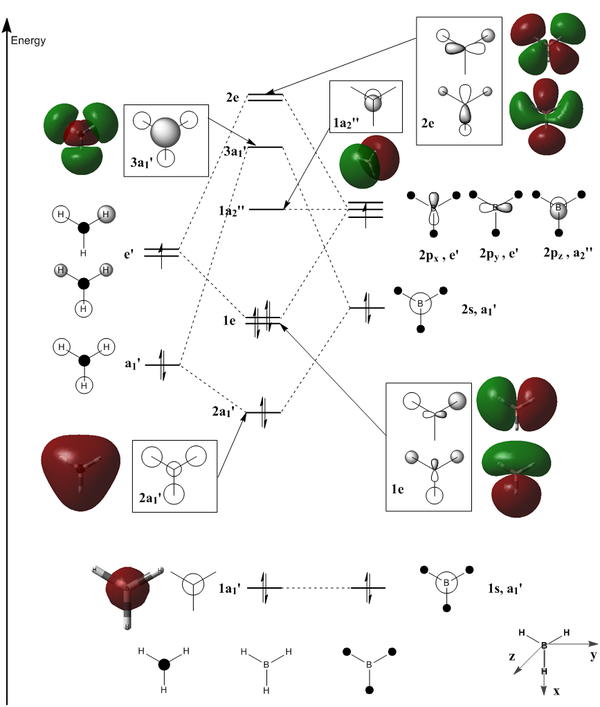
The key difference between the LCAOs and the calculated MOs is that the former are discrete linear combinations of atomic orbitals, whereas the MOs actually are continuous shapes. For example, the first bonding LCAO is a symmetric combination of the 1s orbitals of each hydrogen atom and the 2s orbital of boron. The calculated 2a1' MO agrees that this is a totally symmetric orbital (there is only one phase), but rather than showing four discrete s-like regions, it is one large orbital covering the entire molecule. Realistically it makes sense for the atomic orbitals to combine in this way rather than remaining separate; this shared electron density is what holds the molecule together. LCAOs are still a useful mental tool in terms of imagining how different atoms may interact with each other, but it is important to keep in mind that while they conceptually describe the MOs, the shapes do not remain as simplistic as is often drawn as a symbolic representation.
Another difference is that LCAOs are often drawn as simple combinations of the orbitals without considering whether their shape is preserved. Particularly in the case of antibonding combinations such as in orbitals 2e lobes of opposite phase realistically try to avoid being close together. p orbitals in opposite phases, for example, don't remain parallel but rather bend outwards away from each other. It is very important to keep this effect in mind when doing a simpler LCAO analysis as it can have significant effects on molecules' reactivity; for example, the fact that carboxyl groups generally undergo attack from nucleophiles at an angle of 109° to the C-O bond is due to the fact that the C-O π* orbital bends outwards at this angle[10].
In summary, LCAO theory does not provide a particularly accurate picture of the real situation, but it does reveal the same patterns, and is a useful mental tool when considering reactivity in terms of MO theory.
NH3 Analysis
The geometry was initially optimised using the 6-31G(d,p) basis set. The .log output file can be accessed here.
| NH3 Optimisation | |
|---|---|
| File Name | AMS_NH3_OPT_631G |
| File Type | .log |
| Calculation Type | FOPT |
| Calculation Method | RB3LYP |
| Basis Set | 6-31G(d,p) |
| Charge | 0 |
| Spin | Singlet |
| E(RB3LYP) | -56.55776856 a.u. |
| RMS Gradient Norm | 0.00000885 a.u. |
| Imaginary Freq | |
| Dipole Moment | 1.8464 Debye |
| Point Group | C1 |
| Job cpu time: 0 days 0 hours 0 minutes 32.0 seconds. | |
 Item               Value     Threshold  Converged?
 Maximum Force            0.000024     0.000450     YES
 RMS     Force            0.000012     0.000300     YES
 Maximum Displacement     0.000079     0.001800     YES
 RMS     Displacement     0.000053     0.001200     YES
 Predicted change in Energy=-1.629715D-09
 Optimization completed.
A frequency analysis was then performed. The .log output file can be accessed here.
| NH3 Frequency | |
|---|---|
| File Name | AMS_NH3_FREQ_631G |
| File Type | .log |
| Calculation Type | FREQ |
| Calculation Method | RB3LYP |
| Basis Set | 6-31G(d,p) |
| Charge | 0 |
| Spin | Singlet |
| E(RB3LYP) | -56.55776856 a.u. |
| RMS Gradient Norm | 0.00000890 a.u. |
| Imaginary Freq | 0 |
| Dipole Moment | 1.8464 Debye |
| Point Group | C1 |
| Job cpu time: 0 days 0 hours 0 minutes 15.0 seconds. | |
 Low frequencies ---  -30.7178   -0.0009    0.0007    0.0010   20.2209   28.2838
 Low frequencies --- 1089.5549 1694.1246 1694.1858
Similarly to the BH3 case, this optimisation resulted in low frequencies too large in frequency. A reoptimisation was performed, using the same basis set but adding the keywords scf=conver=9 int=ultrafine, and ticking the 'Use tight convergence criteria' box.
The .log output file of this reoptimisation can be found here.
| NH3 Reoptimisation | |
|---|---|
| File Name | AMS_NH3_REOPT_631G |
| File Type | .log |
| Calculation Type | FOPT |
| Calculation Method | RB3LYP |
| Basis Set | 6-31G(d,p) |
| Charge | 0 |
| Spin | Singlet |
| E(RB3LYP) | -56.55776872 a.u. |
| RMS Gradient Norm | 0.00000140 a.u. |
| Imaginary Freq | |
| Dipole Moment | 1.8465 Debye |
| Point Group | C1 |
| Job cpu time: 0 days 0 hours 0 minutes 11.0 seconds. | |
 Item               Value     Threshold  Converged?
 Maximum Force            0.000004     0.000015     YES
 RMS     Force            0.000002     0.000010     YES
 Maximum Displacement     0.000008     0.000060     YES
 RMS     Displacement     0.000004     0.000040     YES
 Predicted change in Energy=-1.854665D-11
The frequency analysis .log file is here.
| NH3 Reoptimised Frequency | |
|---|---|
| File Name | AMS_NH3_REOPT_FREQ_631G |
| File Type | .log |
| Calculation Type | FREQ |
| Calculation Method | RB3LYP |
| Basis Set | 6-31G(d,p) |
| Charge | 0 |
| Spin | Singlet |
| E(RB3LYP) | -56.55776872 a.u. |
| RMS Gradient Norm | 0.00000137 a.u. |
| Imaginary Freq | 0 |
| Dipole Moment | 1.8465 Debye |
| Point Group | C1 |
| Job cpu time: 0 days 0 hours 0 minutes 14.0 seconds. | |
 Low frequencies ---  -10.5141   -7.3675   -4.4180   -0.0022   -0.0017   -0.0015
 Low frequencies --- 1089.3354 1693.9182 1693.9300
The frequencies are not low enough to indicate the optimisation was of sufficient quality, and none of the vibrational frequencies are negative, indicating that the optimisation did lead to a minimum.
.log file of MO calculation here. These results are also available on D-Space[11].
| NH3 Molecular Orbitals | |
|---|---|
| File Name | ams_nh3_reopt_freq_631g_mo |
| File Type | .fch |
| Calculation Type | SP |
| Calculation Method | RB3LYP |
| Basis Set | 6-31G(D,P) |
| Charge | 0 |
| Spin | Singlet |
| Total Energy | -56.55776854 a.u. |
| RMS Gradient Norm | 0.00000000 a.u. |
| Imaginary Freq | |
| Dipole Moment | 1.8465 Debye |
| Point Group | |
From this file, the charge distribution in the molecule could be found. The image below shows the charge distribution on a colour scale from -1.125 (red) to 1.125 (green).
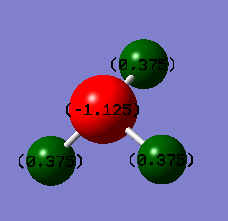
As expected, the three H atoms have the same charge, as the molecule is symmetrical. The N atom has a significantly negative charge (-1.125), due to its higher electronegativity compared to hydrogen, whereas the H atoms have smaller positive charges (+0.375). The magnitudes are smaller on the H atoms as there are three atoms contributing to the charge distribution. The sum of all charges is zero, as the molecule is neutral overall.
H3B−NH3 Analysis
This time the optimisation was performed using the tight settings from the beginning, while keeping an eye on the computational time; this didn't take very long and so the decision to not break it into two steps seemed valid.
.log output file of optimisation here.
| NH3BH3 Optimisation | |
|---|---|
| File Name | AMS_NH3BH3_OPT_631G |
| File Type | .log |
| Calculation Type | FOPT |
| Calculation Method | RB3LYP |
| Basis Set | 6-31G(d,p) |
| Charge | 0 |
| Spin | Singlet |
| E(RB3LYP) | -83.22468908 a.u. |
| RMS Gradient Norm | 0.00000138 a.u. |
| Imaginary Freq | |
| Dipole Moment | 5.5646 Debye |
| Point Group | C1 |
| Job cpu time: 0 days 0 hours 2 minutes 8.0 seconds. | |
 Item               Value     Threshold  Converged?
 Maximum Force            0.000002     0.000015     YES
 RMS     Force            0.000001     0.000010     YES
 Maximum Displacement     0.000034     0.000060     YES
 RMS     Displacement     0.000010     0.000040     YES
 Predicted change in Energy=-1.180595D-10
 Optimization completed.
Frequency analysis log file here.
| NH3BH3 Frequency | |
|---|---|
| File Name | AMS_NH3BH3_FREQ_631G |
| File Type | .log |
| Calculation Type | FREQ |
| Calculation Method | RB3LYP |
| Basis Set | 6-31G(d,p) |
| Charge | 0 |
| Spin | Singlet |
| E(RB3LYP) | -83.22468905 a.u. |
| RMS Gradient Norm | 0.00000138 a.u. |
| Imaginary Freq | 0 |
| Dipole Moment | 5.5646 Debye |
| Point Group | C1 |
| Job cpu time: 0 days 0 hours 1 minutes 5.0 seconds. | |
 Low frequencies ---   -5.0883   -3.2312   -0.0012   -0.0012   -0.0010    2.6790
 Low frequencies ---  263.3861  632.9542  638.4091
The translational and rotational frequencies are sufficiently low, and none of the vibrational frequencies are negative, indicating that a minimum was reached with good accuracy.
Association Energy
The molecules NH3, BH3, and H3B-NH3 have now all been calculated using the same method and basis set (B3LYP 6-31G(d,p)). A comparison of their energies allows for a calculation of the B-N bond in the final complex, as the total energy of the complex can be expected to differ from the sum of the energies of the component molecules by this bond energy.
The calculation is as follows. All decimal places of the calculated values were retained for the intermediate calculation steps, and the final result rounded to a reasonable number of significant figures.
E(NH3) = -56.55776872 a.u.
E(BH3) = -26.61532364 a.u.
E(NH3BH3) = -83.22468905 a.u.
ΔE = E(NH3BH3)-[E(NH3)+E(BH3)] = -0.05159669 a.u.
1 a.u. is 1 Hartree, which is 2625.49962 kJ/mol. Thus the calculated association energy is 2625.49962*(-0.05159669)= -135.5 kJmol-1.
The literature[12] offers a value of -183.9 to -172.1 kJmol-1 for the enthalpy of formation of this compound, having a midpoint of -178.0 kJmol-1. This can be used to calculate the association energy by subtracting the enthalpies of formation of borane and ammonia, which the literature[3] reports as +89.2 and -45.9 kJmol-1, respectively. This gives an experimental association energy of -178.0 - (89.2 - 45.9) = -221.3 kJmol-1.
While the values are both negative (implying the formation of the complex is favourable) and of the same order of magnitude, their magnitudes are quite different. This suggests that the level of calculation is not sufficiently accurate to represent this bond well.
Week 2 Mini-Project: NH-Substituted S8 Crowns
For the sake of clarity, the Mini Project was written up on a separate wiki page.
Mini-Project: NH-Substituted S8 Crowns
References
- ↑ A. Sartor, 2013. DOI:10042/26137
- ↑ A. Sartor, 2013. DOI:10042/26180
- ↑ 3.0 3.1 3.2 3.3 3.4 CRC Handbook of Chemistry and Physics, ed. W. M. Haynes, D. R. Lide and T. J. Bruno, CRC Press, Boca Raton, 93rd edn., 2012.
- ↑ https://wiki.ch.ic.ac.uk/wiki/index.php?title=Mod:asartor111#NCI_Analysis
- ↑ 5.0 5.1 J. R. Lane, J. Contreras-García, J.-P. Piquemal, B. J. Miller, and H. G. Kjaergaard, Journal of Chemical Theory and Computation, 2013, 9, 3263–3266.
- ↑ A. Sartor, 2013. DOI:10042/26179
- ↑ E. Rytter, M.-A. Einarsrud, and C. E. Sjøgren, Spectrochimica Acta Part A: Molecular Spectroscopy, 1986, 42, 1317–1322.
- ↑ J. W. Ochterski, "Vibrational Analysis in Gaussian"
- ↑ A. Sartor, 2013. DOI:10042/26181
- ↑ H. B. Burgi, J. D. Dunitz, J. M. Lehn, and G. Wipff, Tetrahedron, 1974, 30, 1563–1572. DOI:10.1016/S0040-4020(01)90678-7
- ↑ A. Sartor, 2013. DOI:10042/26183
- ↑ Y. K. Shaulov, G. O. Shmyreva, and V. S. Tubyanskaya, Zhurnal Fizicheskoi Khimii, 1966, 40, 61–63.


