Rep:Mod:asartor111
Conformational analysis using Molecular Mechanics
Endo and Exo: two products of the Diels-Alder reaction of cylopentadiene
The Diels-Alder reaction is a [2+4] cycloaddition between a diene in the s-cis conformation and a dienophile, often an electron-poor alkene. Cyclopentadiene is a reagent of particular interest when considering the Diels-Alder reaction for two reasons: firstly, it undergoes the process readily at room temperature (although for improved rates the reaction is usually performed around 40°C[1]); secondly, it undergoes the reaction with itself, that is, it acts both as the diene and as the dienophile.
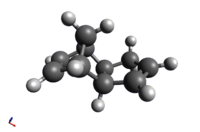
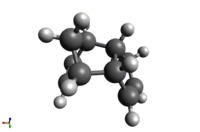
Diels-Alder reactions typically have two distinct products, labelled 'endo' and 'exo'. They are isomers which differ as a consequence of the two possible approach paths during the reaction. Given that the endo-product is the dominant product of the dimerisation, the question remaining is: is this the kinetic or the thermodynamic product? This is quite straightforward to answer using molecular mechanics, as the thermodynamic product of a reaction will always be the most stable, or, to put it more explicitly, that of the lowest total energy.
The two dimers were modelled using Avogadro and optimised using the MMFF94s force field, which is a force field designed to achieve high accuracy but still be possible to apply to large molecules, such as proteins[2]. Table 1 shows their relative total energies, which is then broken down into components.
It is clear from these results that the endo product, which has a greater total energy, is not the thermodynamic product. This leads to the conclusion that the reaction is kinetically controlled. Unlike a thermodynamically controlled reaction, where the outcome is determined by the energetics of the product, a kinetically controlled reaction is defined by the transition state.
(click to enlarge)
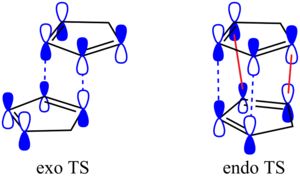
In order to understand why the endo transition is formed it would be possible to attempt to simulate the transition state using Gaussian, however, time constraints did not allow for this approach. Instead, a more simplified approach can be taken in considering the so-called "frontier orbitals", the HOMO and the LUMO.
Although this approach is simplified, it still offers an obvious explanation for the preference of the endo-product: in this arrangement, the orbital lobes not involved in the reaction itself are close enough, and of the right symmetry, to interact favourably (drawn in red)). This favourable interaction stabilises the transition state, lowering its energy, and thus decreasing the activation energy of this reaction pathway. Were the reaction performed under equilibrating conditions, such as at a higher temperature, it would be expected that more of the exo product is formed; this has a higher activation barrier due to the less stabilised transition state, but the final product is more stable. At higher temperatures, more of the starting material would be sufficiently energetic to overcome this greater activation barrier and form the thermodynamic product.
This finding agrees with the literature, which reports that the endo product dominates, but some of the exo product is formed upon heating[3].
Closer inspection of the breakdown of each product's energies shows that the bulk of the excess energy of the exo product can be attributed to angle bending. This usually corresponds to a deviation from the normally ideal bond angles (109° for an sp3 centre, 120° for sp2 and 180° for sp). Inspection of the bond angles around the sp2-hybridised alkene carbon in each dimer reveals a bond angle of 107° for the exo and 112° for the endo dimer (angles shown on Jmol applets above). While neither is ideal, the exo case deviates further from ideality and is consequently less stable.
Hydrogenation of endo cyclopentadiene dimer
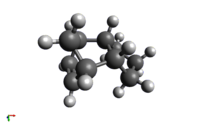
The endo product of the Diels-Alder reaction discussed above can undergo step-wise hydrogenation. In order to find out which of the two double bonds is hydrogenated more readily in terms of thermodynamic factors, the geometries of the two singly hydrogenated products 3 and 4 were optimised using molecular mechanics (MMFF94s as above) and their energies calculated.
|
 |
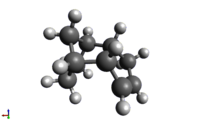 |
It is evident that product 4 is significantly more stable, with its total calculated energy being ~80% of product 3's. 4 could thus be expected to be the dominant initial product. This is in agreement with the literature[4], which reports that 9,10-dihydrodicylopentadiene is the first product formed "due to the steric hindrance effect". Computational chemistry makes it possible to quantify this effect and discuss it in more detail. The largest factor contributing to 3's increased energy is the angle bending term. Examining the sp2 centres in both structures (annotated in the Jmol applets above) shows that the angles in product 3 are significantly distorted from ideality, at 107°, while in product 4 the angle is closer to the ideal value, at 113°. This strain significantly destabilises product 3.
Atropisomerism: a synthetic intermediate en-route to Taxol
Structures 9 and 10 were provided as two possible geometries of an intermediate in the synthesis of Taxol by Paquette, who reported that the preferred structure depends on the nature of the substituents on the cyclohexyl group[5]. They are atropisomers of each other; isomers related by rotation about single-bond with a significant energy barrier. In this example the existence of such an energy barrier is not surprising due to the generally fixed, cage-like structure of a bridged ring with an additional fused ring.
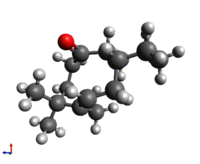
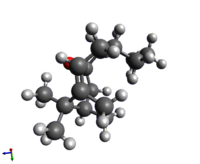
The initial goal was to again compare the energies of these two structures in order to support a brief discussion regarding which would be the thermodynamic product of the preceding reaction step. Upon initial optimisation of intermediate 9 using the MMFF94s force field in Avogadro, the resulting structure offered a twist-boat structure of the cyclohexyl group. This raised suspicion because, in the author's experience, cyclohexane derivatives are generally most stable in the chair conformation. While some research revealed that there were exceptions to this trend, such as 3,3,6,6-tetramethyl-1,2,4,5-tetrathiane, which has been shown both experimentally (by X-ray studies) and computationally (including use of B3LYP/6-31G*) to be more stable in the twist boat conformation than the chair conformation[6], the decision was made to investigate further. After some manual manipulation of the cyclohexane group geometry before optimisation, two chair conformers, both more stable than the twist-boat, were found.
This raised an important point to keep in mind when using molecular mechanical calculations: the software is essentially attempting to optimise the parameters by finding energy minima where the gradient is zero; however, these minima may be local rather than global ones, leading to structures that may not be the most stable conformers.
There is likely a fourth conformer - the second twist-boat, to complete the set - but even careful manual adjustment of the geometry in Avogadro did not result in optimisation giving this geometry. Given that both chair conformers are more stable than the found twist-boat conformer, it was deemed highly unlikely that this elusive second twist-boat would actually be the most stable geometry, and the search was discontinued.
|
 |
 |
 |
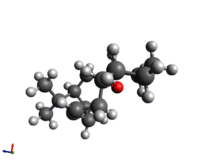
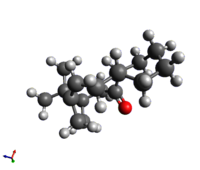
The procedure was repeated for the alternative product 10. Interestingly the twist boat conformer here is lower in energy than one of the two chair conformers, presumably as a function of orbital interactions with the newly aligned carboxyl oxygen. As with structure 9, however, the likely second twist boat structure could not be identified and was assumed to be higher in energy.
|
 |
 |
 |
A fair comparison of the two structures should use the most stable conformer of each, as this is likely to be the major component of a sample of the substance. In comparing the energies of the most stable conformer of 9 (Chair A, '9CA') and 10 (Chair B, '9CB'), it becomes apparent that 10 is the more stable structure by a difference of ~10 kcal/mol (although the absolute value of this energy is meaningless outside of the immediate context of the MMFF94s force field applied by the Avogadro software). The main source of this difference in energy is the angle bending term. Examining the bond angles around the sp2 carbonyl carbon shows that in structure 10 (carbonyl 'down', or 'tucked in' to the ring structure) the bond angle (annotated on Jmol applet) more closely resembles the 120° usually preferred by sp2 hybridised centres as a consequence of the orbital interactions.
Hyperstable alkenes
One notable property of both 17 and 18 is that the alkene group reacts much more slowly in subsequent functionalisation steps than would be expected. Normally, alkenes are more reactive than their alkane counterparts due in part to the presence of a carbon-carbon pi bond and the steric accessibility of the carbon centre (being in a trigonal planar rather than a tetrahedral arrangement).
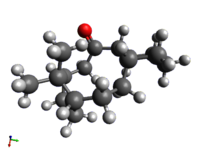
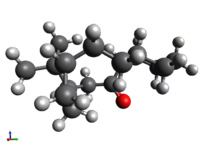
One may expect, from a simplistic chemical understanding, that an alkene such as this, with the double bond in a restricted arrangement not allowing the usually preferred trigonal planar geometry, would be even more reactive, as functionalisation would result in alleviation of this torsional strain. The computations show, however, that the opposite is true: the torsional energy is the main factor contributing to the increase in energy upon hydrogenation. A paper published on the topic in 1981[7] made use of the term 'olefinic strain' (OS) to signify the energy difference between the alkene and alkane forms. This value is usually positive, indicating that the alkene is less stable, but for certain bridgehead olefins was found to be negative. The value is defined as the difference in energy between the most stable conformer of the alkene and the most stable conformer of the alkane, and so the alkane equivalents' energies were calculated below for the sake of comparison.
|
 (Avogadro, MMFF94s) |
 (Avogadro, MMFF94s) |
In both cases, the most stable conformers of the alkane turned out to be the equivalent chair conformers to the alkene forms. As expected, the OS of both structures was found to be negative (-7.4 kcal/mol for 9, -8.9 kcal/mol for 10), explaining the low reactivity; hydrogenation results in a less stable structure. In both cases the most significant contribution to the negative OS is the torsional term, indicating that the decrease in stability upon hydrogenation is a function of the increased torsional strain in the cage structure (that is, strain associated with twisted bonds).
The literature mentions that this hyperstability has only been found to occur when the alkene group is adjacent to the bridge[7], indicating that the cause of the increased stability is definitely to do with the cage structure of the bridged ring, rather than a general steric effect or a function of the pi bond's strength. For future investigations it would be potentially interesting to calculate the different energies of isomeric structures as the double bond is moved around different locations in the ring. The energies of structures with the double bond between different carbons could be used to test this bridgehead hypothesis.
References for this section
- ↑ D. Hönicke, R. Födisch, P. Claus, and M. Olson, Ullmann’s Encyclopedia of Industrial Chemistry, 2000. DOI:10.1002/14356007.a08_227
- ↑ Thomas A. Halgren, "Merck molecular force field. I. Basis, form, scope, parameterization, and performance of MMFF94", J. Comp. Chem., 1996, 17 (25), 490-519.DOI:<490::AID-JCC1>3.0.CO;2-P 10.1002/(SICI)1096-987X(199604)17:5/6<490::AID-JCC1>3.0.CO;2-P
- ↑ P. Caramella, P. Quadrelli, and L. Toma, Journal of the American Chemical Society, 2002, 124, 1130–1131. DOI:10.1021/ja016622h
- ↑ G. Liu, Z. Mi, L. Wang, and X. Zhang, Industrial & Engineering Chemistry Research, 2005, 44, 3846–3851. DOI:10.1021/ie0487437
- ↑ S. W. Elmore and L. A. Paquette, Tetrahedron Letters, 1991, 32, 319–322. DOI:10.1016/S0040-4039(00)92617-0
- ↑ A. R. Katritzky, C. A. Ramsden, J. A. Joule, and V. V. Zhdankin, Handbook of Heterocyclic Chemistry, Wiley, Oxford, 3rd edn., 2010.
- ↑ 7.0 7.1 W. F. Maier and P. V. R. Schleyer, Journal of the American Chemical Society, 1981, 103, 1891–1900. DOI:10.1021/ja00398a003
Spectroscopic Simulation using Quantum Mechanics
Initial geometry optimisation
The geometry of Structure 18 was initially optimised in Avogadro using the MMFF94s force field. As expected from the numerous possible conformers of the parent molecule (10), this structure also had more than one conformer; one with a boat and one with a chair structure of the cyclohexyl group, with the chair being slightly more stable (by ~2kcal/mol).
|
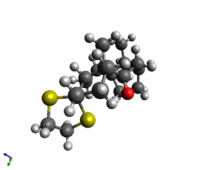 Energy: 100.90 kcal/mol |
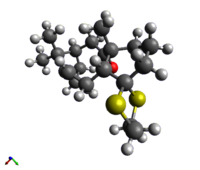 Energy: 102.31 kcal/mol |
Further optimisation and NMR simulation
Following the initial optimisation by molecular mechanics, the structure was loaded into Gaussian for further optimisation using quantum mechanics, as well as calculation of the chemical shifts of each atom in the structure.
As a potential third step, it would have been possible to use Gaussian to calculate the spin-spin coupling of each atom in the structure in order to produce an NMR spectrum including the coupling peaks and thus more closely resembling experimental spectra. However, this process requires significant computational efforts for structures as large as these. Additionally, the chemical shifts themselves offer plenty of data to compare to literature and analyse. For these reasons, the decision was made to not perform the spin-spin coupling calculation.
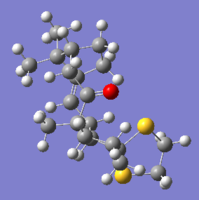
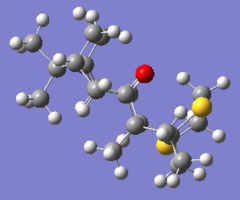
The optimised geometries are included below, and annotated with some relevant distances used in the discussion that follows.
 |
 |
1H NMR
| Atom # | 17 | 47 | 50 | 49 | 48 | 39 | 32 | 35 | 33 | 37 | 27 | 7 | 29 | 34 | 26 | 38 | 36 | 40 | 30 | 51-53 | 41-43 | 31 | 28 | 44-46 |
|---|---|---|---|---|---|---|---|---|---|---|---|---|---|---|---|---|---|---|---|---|---|---|---|---|
| Chair conformation | 5.97 | 3.20 | 3.18 | 3.06 | 2.96 | 2.82 | 2.77 | 2.73 | 2.65 | 2.50 | 2.49 | 2.44 | 2.23 | 2.01 | 2.00 | 1.99 | 1.84 | 1.59 | 1.54 | 1.42 | 1.27 | 1.26 | 1.26 | 1.15 |
| Boat conformation | 5.28 | 3.22 | 3.32 | 3.12 | 3.12 | 2.87 | 2.40 | 2.09 | 2.85 | 2.46 | 2.27 | 1.85 | 1.68 | 1.98 | 2.30 | 1.95 | 1.85 | 1.41 | 2.27 | 1.37 | 1.23 | 1.06 | 1.62 | 1.15 |
A list of 1H peaks was found in the literature[3] and the assignment is made as far as possible (see discussion below).
| Shift (ppm) | Multiplicity | Possible assignment (atom #) | Comment | |
|---|---|---|---|---|
| 5.21 | m, 1H | 17 | Boat conformer (5.28ppm) good match, chair too high (5.97ppm) | |
| 3.00-2.70 | m, 6H | 47-50, 39, 32 | 39,32,35,33,37,27 | See discussion below |
| 2.70-2.35 | m, 4H | 35,33,37,27 | 47-50 | |
| 2.20-1.70 | m, 6H | 29,34,26,38,36,40 | Range slightly wider for calculated values | |
| 1.58 | t, 1H | 7 | Shift 0.86ppm higher for chair calculation, 0.27ppm higher for boat | |
| 1.50-1.20 | m, 3H | 30,31,28 | Range matches well for chair calculation | |
| 1.10 | s, 3H | 51-53 | Shifts higher in calculations | |
| 1.07 | s, 3H | 41-43 | ||
| 1.03 | s, 3H | 44-46 | ||


Comparison of this calculated spectrum to experimental data proved difficult as the literature reference grouped peaks at similar shifts into multiplets, whereas the computed result contains an individual peak for each proton. The aim in running NMRs on both the chair and boat conformations of structure 18 was to compare both to the literature in order to deduce which of the two conformers was present in the sample; however, due to the lack of detailed information available from the literature spectrum this task proved impossible within the experiment's time constraints.
As expected, in both the literature and calculated spectra, the most deshielded proton was the alkene proton, with a shift of 5.21 ppm in the literature and 5.28 and 5.97 ppm in the calculated boat and chair conformer spectra, respectively.
Hereafter the discussion concerns only the non-alkene protons as their shift patterns are of greater interest; for convenience, protons are described are 'most deshielded' or equivalent discounting the alkene proton (as writing 'most deshielded other than the alkene proton' in each instance would not improve the text's clarity).
The most notable difference between the literature spectra lay in the shifts of the protons on the dithiane ring (atoms 47-50). In the calculated spectra of both conformers, these four protons had the highest shifts, as may be expected from their proximity to the electronegative sulfur atoms. In the literature spectrum, however, the most deshielded protons are listed in three multiplets with integrations of 6, 4, and 6, respectively. A glance at the same literature reference's NMR listings for the other atropisomer, structure 17, showed that the same was not the case here; the most deshielded multiplet on 17's spectrum has an integration of 4, corresponding to the dithiane group.
There are two possible explanations for this. The first is that the two atropisomers are sufficiently physically different from each other to result in significantly different shifts for the dithiane protons (3.40-3.10 rather than 2.70-2.35 ppm). This is not impossible; with the carboxyl group pointing up rather than tucked into the bottom of the cage structure, the dithiane group may be in closer through-space proximity to the carboxyl oxygen and thus experience a deshielding effect. The second possibility is that the authors of the literature reference mis-assigned the spectrum of structure 18, and that the '6-4-6' multiplet group is actually a '4-12' or similar group; the most deshielded four protons correspond to the dithiane protons whereas the remaining 12 are different protons around the cage structure. Unfortunately the reference's supporting information did not include a copy of the original NMR spectra for compounds 17 or 18, only a list of peaks, making it difficult to judge which of these two explanations is more likely, but if it is the latter it goes to show how important computational chemistry can be in clarifying or debunking previously published data. The reference used was the most recent published NMR spectrum of the compound found, but the data is still 23 years old; contacting the authors to discuss the topic or request the original spectra is unlikely to be a fruitful exercise, and so being able to compute the spectra offers a good check.
The other topic of note lies in the methyl groups. In the vast majority of cases, terminal carbon-carbon bonds are free to rotate on a timescale faster than that of an NMR recording, and so the three protons on a methyl group are equivalent. The computed spectrum, however, makes use of an optimised geometry that is static and so this time-averaging of the proton shifts is not automatically incorporated. The shifts of the affected proton groups (41-43, 44-46 and 51-53) were manually averaged by calculating the arithmetic mean. These three groups were judged to be the only cases of 'true' degeneracy in the system (that is, protons whose peaks should be at the same shift because they are in identical chemical environments). All other protons are alone in their environment because of the rigid cage structure of the molecule. For this reason, alongside the graphical output where peaks within 0.05ppm of each other are grouped for the sake of visual clarity, the individual peaks are listed in the table above.
The typical examples of deshielding effects encountered over the course of an undergraduate degree consider atoms connected by a number of direct bonds. However, this calculated spectrum strongly suggests that through-space effects can also have a significant effect on a proton's chemical environments; it is a persistent pattern around the 10-membered ring that protons on the bottom face have higher chemical shifts than those on the top face. These protons are equivalently far away from the carboxyl oxygen in terms of number of separating bonds, but are significantly closer to it in three-dimensional space. (A few examples are listed in the table below. The example values are taken from the Chair conformer's spectrum, but the pattern persists on the Boat conformer.) Thus this result strongly suggests that the carboxyl oxygen's electronegativity has a deshielding effect on protons in its vicinity. For future investigations it may be of interest to simulate spectra of a range of similar compounds with different cage sizes to test the distances over which this effect is significant.
| Atom # | Shift | Atom # | Shift | Atom # | Shift | |
|---|---|---|---|---|---|---|
| Bottom face | 35 | 2.73 | 29 | 2.22 | 37 | 2.50 |
| Top face | 34 | 2.01 | 28 | 1.26 | 36 | 1.84 |
| Difference | - | 0.72 | - | 0.96 | - | 0.66 |
A similar effect is apparent in the three methyl groups; while the exact values of their averaged shifts differ between the chair and boat conformations, the order is the same: the methyl group adjacent to the 6-membered ring has the highest shift, while the methyl group on the bridge facing away from the carbonyl group has the lowest. This is the same order as their relative closeness to the carboxyl oxygen.
In lieu of deciding which conformer is the one measured by the literature, we can at least compare the two conformer's spectra to each other. The most significant differences in shift are caused when the change in cyclohexyl conformation causes a change in the physical closeness to an electronegative group - again, it is through-space rather than bonded interactions that are of interest. Two of the most significant differences in shifts between the two conformers are in protons 29 and 30, located on the cyclohexyl group. Proton 29 is more deshielded on the chair conformer (2.23ppm) than on the boat conformer (1.68ppm), whereas the opposite is the case for proton 30 (1.54ppm on chair, 2.27ppm on boat). This relationship directly correlates with the change in separation between the protons and the carboxyl oxygen. On the chair conformer, 29 is closer to the oxygen atom (2.39 Å) than 30 (3.03 Å). On the boat conformer, however, the carbon which proton 29 is attached to twists away from the oxygen, leading to an H..O separation of 4.85 Å. Meanwhile, proton 30 is moved slightly closer (2.34 Å). The closer the proton is to the electronegative atom, the greater its chemical shift.
13C NMR
| Atom # | 15 | 10 | 9 | 6 | 5 | 13 | 4 | 18 | 1 | 23 | 22 | 3 | 14 | 8 | 25 | 11 | 20 | 12 | 19 | 2 |
|---|---|---|---|---|---|---|---|---|---|---|---|---|---|---|---|---|---|---|---|---|
| Literature (ppm) | 211.49 | 148.72 | 120.90 | 74.61 | 60.53 | 51.30 | 50.94 | 45.53 | 43.28 | 40.82 | 38.73 | 36.78 | 35.47 | 30.84 | 30.00 | 25.56 | 25.35 | 22.21 | 21.39 | 19.83 |
| Chair Calculated (ppm) | 212.23 | 148.08 | 120.14 | 94.11 | 60.42 | 54.88 | 54.20 | 49.69 | 49.13 | 46.76 | 41.82 | 41.77 | 38.74 | 34.13 | 33.64 | 28.15 | 26.46 | 24.55 | 22.62 | 21.72 |
| Chair Difference (ppm) | +0.74 | -0.64 | -0.76 | +19.5 | -0.11 | +3.58 | +3.26 | +4.16 | +5.85 | +5.94 | +3.09 | +4.99 | +3.27 | +3.29 | +3.64 | +2.59 | +1.11 | +2.34 | +1.23 | +1.89 |
| Boat Calculated (ppm) | 211.83 | 148.67 | 118.84 | 9.08 | 67.89 | 55.60 | 56.11 | 50.11 | 42.03 | 48.20 | 44.22 | 35.31 | 37.59 | 31.05 | 28.84 | 28.66 | 25.74 | 25.26 | 23.40 | 21.05 |
| Boat Difference (ppm) | +0.34 | -0.05 | -2.06 | -65.53 | +7.36 | +4.30 | +5.17 | +4.58 | -1.25 | +7.38 | +5.49 | -1.47 | +2.12 | +0.21 | -1.16 | +3.10 | +0.39 | +3.05 | +2.01 | +1.22 |

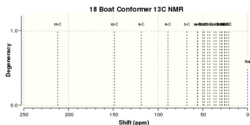
In an effort to find a reasonable correction for the carbon atoms directly bound to sulfur atoms, 1,3-dithiolane was modelled and its NMR spectrum calculated with exactly the same options (MMFF94s followed by B3LYP 6-31G(d,p), chloroform solvent). The plan was to then calculate the difference between the experimental and calculated peaks, and then apply this same difference to the peaks calculated for structure 18. 1,3-dithiolane was chosen for this purpose because it matches the sulfur-containing subgroup on structure 18. The method would be crude (as it assumes that the correction is linear and directly transferrable between the two structures) and rely on the dithiolane literature spectrum being accurate, but it was expected to offer a decent starting point for analysis.
The calculated peaks were 44.5ppm for the carbons attached to a single sulfur atom (A), and 42.7ppm for the carbon attached to both sulfur atoms (B), which is significantly different from the most recent reported literature spectrum[4] listing two peaks at 8.0 and 34.3ppm. Applying this correction, however, proved relatively unfruitful. Firstly, the literature peaks were not assigned, so a decision had to be made on whether the 8.0 ppm peak corresponded to environment A or B. When assuming the peak corresponded to A, the corrections were -36.5ppm for A and -8.4ppm for B. When assuming it corresponded to B, the corrections were -10.2ppm for A and -34.7ppm for B.
| Atom | Chair 22 (A) | Chair 23 (A) | Chair 6 (B) | Boat 22 (A) | Boat 23 (A) | Boat 6 (B) |
|---|---|---|---|---|---|---|
| Literature | 36.8 | 40.8 | 74.6 | 36.8 | 40.8 | 74.6 |
| Calculated | 41.8 | 46.8 | 94.1 | 44.2 | 48.2 | 89.1 |
| Corrected 1 | 31.7 | 36.6 | 59.4 | 34.1 | 38.0 | 54.4 |
| Corrected 2 | 5.4 | 10.3 | 85.7 | 7.8 | 11.7 | 80.7 |
The results, shown in the table above, are better for the first correction (assuming that the S-C-C carbon is at 8.0ppm) but still far from perfect. While the A carbon shifts now match the literature within ~5ppm, the B shifts have gone from being up to 20 ppm above the literature value to being up to 20 ppm below it. This goes to show how potentially difficult simulating NMRs for compounds containing sulfur and similar elements can be. It is difficult to find corrections that work in all cases, but continuing to adjust the correction method until the data matches literature may end up skewing the data in a biased manner.
The good news is that, other than the carbons directly bound to sulfur, all but 1 of the Chair conformer's calculated peaks lie within 5 ppm of the literature values. This one exception is carbon 1, which is within 2 bonds of two sulfur atoms, so the same correction factor may be causing issues. For the Boat conformer, 2 peaks are more than 5ppm out, and both belong to carbons on the cyclohexyl group (carbons 4 and 5). This suggests that it is the Chair conformer that is dominantly present in the experimental sample, which agrees with the energies initially calculated by molecular mechanics above (the Chair conformer is slightly more stable).
References for this section
- ↑ A. Sartor, 2013. DOI:10042/26041
- ↑ A. Sartor, 2013. DOI:10042/26042
- ↑ 3.0 3.1 3.2 L. A. Paquette, N. A. Pegg, D. Toops, G. D. Maynard, and R. D. Rogers, Journal of the American Chemical Society, 1990, 112, 277–283. DOI:10.1021/ja00157a043
- ↑ Y.-J. Cao, Y.-Y. Lai, H. Cao, X.-N. Xing, X. Wang, and W.-J. Xiao, Canadian Journal of Chemistry, 2006, 84, 1529–1533. DOI:10.1139/v06-151
Crystal Structures of Shi and Jacobsen Catalysts
Shi Catalyst
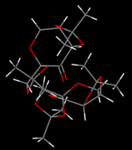
The Shi catalyst's crystal structure[1] was found in the Cambridge Structural Database (CSD) using ConQuest and directly loaded into Mercury for analysis. The structure showed a pair of molecules in the unit cell. For both molecules A and B, the carbon-oxygen bonds at each of the two anomeric centres were measured. The bond lengths were found to be different not only between two oxygens bound to the same carbon atom, but also between corresponding bonds of the two molecules.
|
 |
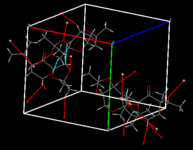 |
While the crystal structure can be visualised through the Jmol applet linked above, and the anomeric bond lengths are labelled there, more information about the structure, particularly with regard to H..H contacts, was garnered through Mercury. There are twelve anomeric C-O bonds to consider: there are 2 molecules in the structure, each with 3 anomeric centres containing 2 C-O bonds. On each molecule, one anomeric centre is on the sugar ring and one on each 5-membered ring. Of the latter only one is considered as a representative example. The molecules were dubbed A and B. The anomeric centres are referred to as 'sugar' (carbon in the 6-membered ring) and 'acetal' (carbon in the 5-membered ring). The different bond lengths are listed in the table above.
For the 6-ring anomeric centres on both molecules, the oxygen occupies the axial position, indicating that they are α-anomers. This is known to be the dominant anomer in the vast majority of anomers with a substituted group (i.e. OR rather than OH)[2]|Conformational Analysis Lecture Notes where the β-anomer cannot be stabilised by hydrogen bonding. In both molecules, the 'sugar 1' C-O bond (along the 6-membered ring) is longer than the 'sugar 2' bond (between the ring and the axial oxygen) by a difference on the order of 0.01Å, indicating that the ring bond is weaker. This indicates that electron density from the lone pairs of the axial oxygen is being donated into the C-O σ* orbital on the ring.
Similarly, for the anomeric centres on the 5-membered ring, the two C-O bonds are unequal due to such a donation from OLP into σ*C-O. The extent of the difference is greater for these bonds, with one bond being about 0.02Å longer. This indicates that in the 5-membered rings the overlap between the OLP into σ*C-O is better - the orbitals are able to adopt a more anti-periplanar arrangement, causing a stronger interaction and thus a greater effect on the bond lengths.
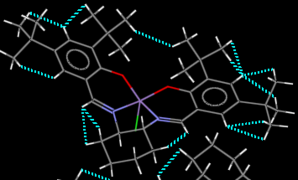
Also of interest is the fact that the two molecules in the crystal structure exhibit different bond lengths. This can be attributed to the presence of short contacts between the molecule affecting the optimal geometry of each atom when considering the packing of the unit cells. These short contacts are indicated in red and cyan on the image above (showing four packed molecules).
Jacobsen Catalyst
 |
 |
 |
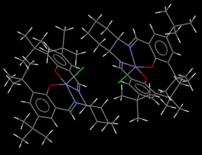
The Jacobsen catalyst's crystal structure[3] is interesting because of the constrained geometry (the ligand is held around the metal centre in a mostly planar arrangement) involving bulky groups.
So-called "contacts" between atoms (separations between atoms at a proximity where certain physical effects such as steric interactions become relevant) can be a double-edged sword; the interaction is a function of their nuclear separation. The most favourable dispersion interaction occurs when the atoms' separation is equal to the sum of their van der Waals' radii. At larger separations, the interaction is still favourable but the magnitude decreases. The danger lies in contacts at smaller separations; these very quickly become unfavourable, increasing the system's energy[2].
In the found crystal structure of the Jacobsen catalyst, plenty of the favourable H..H contacts at a separation greater than 2.4Å (as hydrogen's van der Waals radius is 1.2Å) are visible as per the first image below. The second image, however, reveals unfavourable contacts. With the phenyl groups forced into a coplanar arrangement, their tert-butyl groups cannot avoid each other complain. One short contact exists between protons on the tert-butyl groups. At a separation of 2.328Å, or ~0.07Å shorter than the ideal separation, the structure's energy is likely increased as a consequence. The situation is worse within each phenyl group. The tert-butyl groups lie meta to each other, and are far enough apart to avoid unfavourable contacts between them. However, the phenyl proton between them is wedged in between the two groups and experiences several short contacts. One is as short as 2.051Å, almost 0.4Å shorter than the ideal distance, and will have a significant unfavourable effect on the stability.
The two contacts discussed above are also included in the Jmol applet for clarity. No unfavourable C..H or C..C contacts were identified in the structure.
References for this section
- ↑ Z.-X. Wang, S. M. Miller, O. P. Anderson, and Y. Shi, The Journal of Organic Chemistry, 2001, 66, 521–530. DOI:10.1021/jo001343i
- ↑ 2.0 2.1 Conformational Analysis Lecture Notes
- ↑ P. J. Pospisil, D. H. Carsten, and E. N. Jacobsen, Chemistry – A European Journal, 1996, 2, 974–980. DOI:10.1002/chem.19960020812
Properties of the Synthesised Epoxides
NMR
The epoxides' structures were initially optimised in Avogadro using the MMFF94s force field. This geometry was then used as a starting point for a quantum mechanical optimisation using Gaussian, through the B3LYP 6-31G(d,p)basis set. As well as optimising the geometry, this run also calculated the chemical shift of each atom in the structure. Finally, the output formatted checkpoint file from this calculation was used as a starting point for a final calculation to find the spin-spin coupling of all atoms involved. For the 1H spectrum, this data was entered into gNMR to simulate a spectrum involving visible peaks. (Only coupling constants of a magnitude greater than 1.5Hz were used for this process as those smaller would not be visible on the final spectrum.) The calculations were only run on one of the two possible enantiomer products for each epoxidation, as the NMR spectra would be identical for the other enantiomer, whereas the calculated optical rotations would simply have the opposite sign.
(R)-Styrene Epoxide
 (click to enlarge) |
 (B3LYP 6-31G(d,p) )[1] |
|
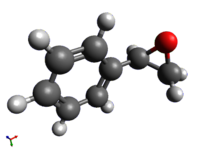
The geometry of the epoxide, optimised by quantum mechanical methods, is shown above with all atoms labelled.
The 1H NMR as output by gNMR after applying relevant coupling constants was overlaid onto a literature spectrum[3] recorded at the same frequency as the gNMR setting (400Hz) and in the same solvent as the initial calculation (chloroform). As the image shows, the spectra are similar but not identical. The calculated spectrum without the literature overlay can be seen here.
For all three non-aromatic protons, the calculated shift is slightly higher than that reported in the literature. Two are within 0.2ppm of the literature value, whereas the most shielded, belonging to hydrogen 17, is off by 0.4ppm. The peak widths, however, are equivalent.
The multiplet corresponding to the aromatic protons has a chemical shift close to the literature (within 0.2ppm). The major difference is that the calculated spectrum seems to show at least 2 distinct multiplets, whereas in the literature spectrum all five proton's shifts seem to be roughly equivalent. This could be in part due to the lack of time-averaging present in the calculated spectrum.
The calculated 13C NMR spectrum is tabulated above. Because of the rapid rotation of the C-C single bond between the aryl ring and the epoxide group, carbon pairs 4/6 and 1/3 should be equivalent through time-averaging, so the arithmetic mean of their peaks was taken. All peaks are in good agreement (within 5ppm) with the literature values.
(R,R)-Trans-Stilbene Epoxide
 (click to enlarge) |
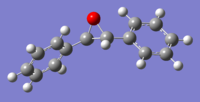 (B3LYP 6-31G(d,p) )[4] |
|
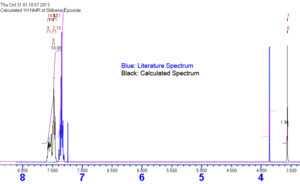
As before, the 1H spectrum was output by gNMR and overlaid onto a literature spectrum[6] with corresponding frequency and solvent (400MHz, chloroform). The calculated spectrum without the literature overlay can be seen here.
The 1H NMR spectrum shows distinct regions for the aromatic and epoxide protons. The peaks are of comparable width to the literature peaks. Again, the aromatic proton region contains more distinct multiplets in the calculated spectrum than the recorded one. Both regions' shifts are within 0.3ppm of the literature.
The calculated 13C NMR spectrum is tabulated above. Once again time-averaging was accounted for manually by taking arithmetic means. Due to the high degree of symmetry in the structure, there are several groups of equivalent carbons: 5/9 (quaternary Ph-C), 4/6/10/14 (ortho Ph-C), 1/3/11/13 (meta Ph-C), 2/12 (para Ph-C) and 7/8 (epoxide C). All peaks are in agreement within 5ppm.
Optical Rotations
In an effort to assign the absolute configurations of the products, their optical rotatory power (ORP) calculated. For this, the output of the quantum mechanical geometry optimisation from the NMR was taken as a starting point for a new calculation, using the same basis set, in which the optical rotation was found both at 589 and 365nm. (The two wavelengths were chosen because they are most commonly used in literature, being the wavelengths emitted by a sodium and mercury lamp, respectively.) The results are listed in the table below.
| Light frequency | 589 nm | 365 nm |
|---|---|---|
| (R)-Styrene Epoxide[7] | -30.12° | -94.05° |
| (R,R)-Trans-Stilbene Epoxide[8] | +298.00° | +1253.84° |
For (R)-styrene epoxide, the literature values are inconclusive at best; both negative and positive values of different magnitudes have been reported. (It is situations like these where the calculations are helpful; from the literature alone it is impossible to accurately assign the enantiomer based on the ORP.) It may be possible to get an idea by checking the literature values provided by Shi and Jacobsen themselves (as these are potentially more reliable), but it seems styrene is an unpopular reagent for these two reactions; the only piece of information found reported by Shi et al.[9] is a value of -8.7° at 589nm for the (S) enantiomer in a sample with ee 27%. Using a linear approximation, this can be scaled to a value for the pure enantiomer of -8.7°/0.27 = -32°. This is actually in fairly good agreement with the calculated value (within 2°). However, the fact that the literature value was recorded in a different solvent (benzene) means the value is not wholly reliable. Even though the magnitudes cannot be directly compared, at least the negative sign for the (S) enantiomer does suggest that the correct assignment for the (R) enantiomer is the positive sign.
For (R,R)-trans-stilbene epoxide, values reported in the literature are all of the same positive sign, and within a 100° range - which, while large, is not as bad as the styrene epoxide case. Shi et al.[9] reported an ORP of 319.8° at 589nm. Although the recording was made in benzene rather than chloroform (which was used in the calculations), the magnitude is similar and the value is of the correct sign. A different group did report the value in chloroform[10]. At 239.2°, it is still of a similar size to the calculated value, and of the correct sign. Thus there is a strong suggestion that the (R,R)-assignment is correct.
The method used to calculate the optical rotations is generally only reliable for magnitudes above 100°, so the styrene epoxide values cannot be relied upon excessively. The stilbene epoxide values, however, can be assumed to be relevant for future assignments.
A trend observed with both compounds is that the magnitude of rotation is greater for smaller wavelengths (higher frequencies). This is a trend that is generally observed amongst optically active compounds[11]. Unfortunately no literature values could be found at 385nm, or any other wavelength, for either compound, so the trend could not quantitatively be compared to literature.
References for this section
- ↑ A. Sartor, 2013. DOI:10042/26043
- ↑ K. Huang, H. Wang, V. Stepanenko, M. De Jesús, C. Torruellas, W. Correa, and M. Ortiz-Marciales, The Journal of Organic Chemistry, 2011, 76, 1883–1886. DOI:10.1021/jo102294j
- ↑ S. Wu, A. Li, Y. S. Chin, and Z. Li, ACS Catalysis, 2013, 3, 752–759. DOI:10.1021/cs300804v
- ↑ A. Sartor, 2013.DOI:10042/26045
- ↑ O. Boutureira, J. F. McGouran, R. L. Stafford, D. P. G. Emmerson, and B. G. Davis, Organic & Biomolecular Chemistry, 2009, 7, 4285–4288. DOI:10.1039/B911675C
- ↑ H.-Y. Wu, C.-W. Chang, and R.-J. Chein, The Journal of Organic Chemistry, 2013, 78, 5788–5793. DOI:10.1021/jo400648f
- ↑ A. Sartor, 2013. DOI:10042/26044
- ↑ A. Sartor, 2013. DOI:10042/26046
- ↑ 9.0 9.1 B. Wang, X.-Y. Wu, O. A. Wong, B. Nettles, M.-X. Zhao, D. Chen, and Y. Shi, The Journal of Organic Chemistry, 2009, 74, 3986–3989. DOI:10.1021/jo900330n
- ↑ S. E. Denmark and H. Matsuhashi, The Journal of Organic Chemistry, 2002, 67, 3479–3486. DOI:10.1021/jo020050h
- ↑ E. Koubek and H. Quinn, Journal of Chemical Education, 1989, 66, 853. DOI:10.1021/ed066p853.1
Analysis of Transition State Data of β-methyl styrene
Due to the prohibitive computational time, the results of these calculations were provided in the script. β-methylstyrene epoxide was chosen for analysis because its transition states were available for both the Shi and Jacobsen epoxidations, allowing for comparison between the two.
Calculation of enantiomeric excess
Knowing the free energies of all transition states for both enantiomers makes it possible to calculate the enantiomeric excess of the reaction.
At first, an attempt was made to calculate the relative fractions of each of the eight transition states using their Boltzmann factors, then summing the fractions belonging to each enantiomer to provide the total fraction, and using this to calculate the enantiomeric excess. The goal was to write a simple Python script performing this calculation after asking the user for input (how many transition states existed for each enantiomer, and each transition state's energy). However, the very large numbers involved in the exponentials of the Boltzmann factors caused an overflow error in the program. The solution of this problem was not facile, as the large constants were present in the exponential and thus could not simply be cancelled out (rather, each factor was essentially being raised to a large power). The project was put on hold for the time being and not pursued further before the completion of the 2-week laboratory due to time constraints.
Instead, the simplified approach was followed: the assumption was made that only the lowest-energy transition state of each pathway would be used in the reaction. This reduced the problem down to two structures, one with RR and one with SS stereochemistry, with distinct energies. These were considered as two products in a hypothetical equilibrium:

(In reality there is no direct reaction converting RR into SS or vice versa, rather their initial formation is a function of the energies of the diastereomeric transition state.) Knowing the free energies of both sides of the equilibrium allows us to find the equilibrium constant, K, knowing the change in free energy (RHS - LHS) in Joules, the gas constant (8.314 J/molK), and the temperature, which is here assumed to be room temperature (298K).

The above equation can be solved for K, the equilibrium constant, which is also equal to the ratio of the mole fractions of each substance (FSS and FRR).

Knowing that all mole fractions must add up to 1 (FSS + FRR = 1), we now have a system of two simultaneous equations:

Which can be solved for FSS and FRR as follows:
 |
Finally, the enantiomeric excess of the reaction is defined as the absolute value of the difference in the enantiomers' mole fractions:

Shi Epoxidation
For the Shi epoxidation, the calculated transition states were provided. There are eight transition states: 4 for each product, of which there are 2 endo and 2 exo transition states, of which each uses one of the two (non-equivalent) oxygens on the dioxirane group of the active catalyst. Their energies are tabulated below.
| RR Series | Energy (Hartrees) | SS Series | Energy (Hartrees) |
|---|---|---|---|
| 1 | -1343.022970 | 1 | -1343.017942 |
| 2 | -1343.019233 | 2 | -1343.015603 |
| 3 | -1343.029272 | 3 | -1343.023766 |
| 4 | -1343.032443 | 4 | -1343.024742 |
For both enantiomers, the lowest energy transition state is #4. The energy difference, ΔG, is 0.007701 Hartrees, or 20218 Joules. Plugging this value into the equations detailed above gives K = 0.0002845. Consequently, the enantiomeric excess of the dominant RR enantiomer (the transition state of which is lowest in energy) is:

This enantiomeric excess of 99.94% is very high which gives credit to the Shi catalyst's usefulness in asymmetric synthesis. The literature reports good but slightly smaller values depending on the methods utilised, the highest being 95.5%[1]. However no literature values are wholly representative, as the solvent used in the simulation was water, and no literature used non-organic solvents.
Jacobsen Epoxidation
The procedure here is entirely analogous. Here each enantiomer has two possible transition states listed (endo and exo), with the following energies:
| RR Series | Energy (Hartrees) | SS | Energy (Hartrees) |
|---|---|---|---|
| 1 | -3383.253816 | 1 | -3383.262481 |
| 2 | -3383.254344 | 2 | -3383.257847 |
For both enantiomers, the most stable transition state is #1. The energy difference ΔG is -0.008665 Hartrees or -22750 Joules, resulting in an equilibrium constant of K =9724, indicating a significant excess of the SS enantiomer. This is quantified by the enantiomeric excess as before:

Thus the theoretical enantiomeric excess is 99.98%. Finding a literature value for comparison proved difficult as the Jacobsen epoxidation is generally used for cis- rather than trans-alkenes (which is why this high calculated value is surprising; one would expect this reaction to be much more popular if it were this selective!) Jacobsen et al. report values as high as 92%[2] for different alkenes.
Examining the Shi Epoxidation transition state
Visual analysis of geometry
As calculated above, when epoxidising β-trans-methylstyrene, the Shi reaction is highly RR-selective. To aid understanding of the mechanisms leading to the selectivity calculated above, the structure of the lowest transition state leading to each enantiomer was examined.
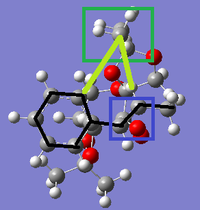
Images of the two transition states (both the 4th in their series, those of the lowest energy) are shown from a 'top-down' view, with the alkene being on top. The C-C bonds of the alkene are emphasised with black lines for visual clarity. The blue box indicates the reaction centre, where the upper dioxirane oxygen is in the process of being transferred onto the alkene double bond.
 |
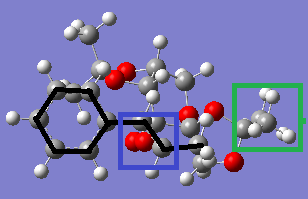 |
The green box indicates the methyl group on the catalyst that is pointing up from one of the diacetal groups and is on the same plane as the alkene. The main difference between the two transition states is that this methyl group is located at the end of the alkene molecule in the SS transition state, but halfway along it - between the double bond and the phenyl ring - in the RR transition state. It is likely that this larger extent of contact between the methyl group and protons on the alkene is allowing for a greater number of Van der Waals interactions (drawn in light green) stabilising the system, thus causing the lower energy of this transition state and in turn the RR selectivity.
NCI Analysis
|
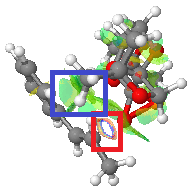
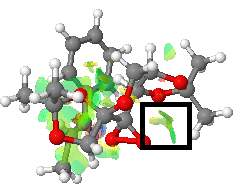
In order to better understand the reasoning behind the enantiomeric excess calculated, the lowest-energy transition state of the Shi epoxidation reaction (RR 4) of β-methylstyrene was examined. Its electron density was used to calculate a surface corresponding to noncovalent interactions present. Noncovalent interactions are nonlocal interactions, distinct from typical covalent bonds - such as van der Waals interactions, hydrogen bonds, or steric clashes - and can be found using only the electron density distribution of a molecule[3].
Most noticeable is a red/blue ring isosurface present where the bond is forming (red rectangle). Because it is present in the middle of the bond formation, the physical processes causing it are complex and temporary. Being a consequence of bond formation, it probably cannot accurately be described as 'non-covalent', as the area is halfway to being a covalent bond.
More easily understandable interactions are visible, for example between the diacetal methyl group on the catalyst and a hydrogen on the styrene phenyl ring (blue rectangle). Such green areas indicate favourable interactions. They are mostly present here between hydrogen atoms, representing favourable Van der Waals interactions at distances greater than the sum of their Van der Waals radii. As discussed above, it is the location of this methyl group that is the key difference between the RR and SS transition state; these interactions relatively stabilise the RR transition state, causing the strong preference for the RR product.
There is also an interaction between one of the catalyst's methyl groups and the dioxirane oxygen that is not participating in the reaction (black rectangle). Perhaps this stabilising interaction helps direct towards the other dioxirane oxygen by making this arrangement more energetically favourable than the approach from the other direction.
QTAIM Analysis
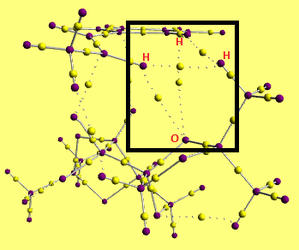
The same transition state was also examined using the Quantum Theory of Atoms In Molecules (QTAIM). The key element of QTAIM is the presence of a Bond Critical Point (BCP) between bonded atoms. BCP are considered by looking at the electron density distribution; nuclei lie at local maxima of the electron density, and BCPs represent the saddle points between them[4].
|

|
The structure shows atoms as purple and BCPs as yellow dots, with solid lines indicating bonds and dotted lines indicating weaker interactions.
The black rectangle indicates interactions between one of the diacetal oxygens on the catalyst and two hydrogen atoms on the alkene (spanning between a phenyl hydrogen atom and one of the terminal hydrogen atoms), as well as interactions between a methyl carbon on the catalyst and the same two alkene hydrogen atoms. It seems that the geometry of the transition state is held in place by this 'cage' of interactions, causing a directing effect on the selectivity of the reaction.
The blue rectangle is centreed on an anomeric carbon. It shoes the asymmetry in these anomeric bonds; the BCP of one C-O bond is noticeably closer to the carbon atom than the other. This is a result of the different orbital overlaps, and consequently different interactions, between the bonds.
The red rectangle indicates an unexpected finding; it seems there is an interaction between one of the hydrogen atoms on the cyclohexyl group of the catalyst, and one of the carbon atoms on the phenyl group of the alkene. Perhaps this degree of stabilisation is enough to affect the selectivity of the reaction by making this transition state the lowest in energy.
Conclusions
While the visual inspection of the transition states seems like a very crude method of analysis, its intuitive results were later confirmed by the NCI calculations. NCI and QTAIM differ in that QTAIM attempts to localise the interactions - BCPs are always between two atoms, rather than a broader region, and defined as points rather than surfaces. This means that NCI is superior for spotting effects such as the favourable interaction between the methyl group and alkene protons which is spread between these two groups. However, QTAIM has the benefit of showing where such interactions are most pronounced - for example, which two alkene protons the methyl proton interacts with dominantly. This could potentially be useful when e.g. designing new molecules; precursors could be examined for which functional groups experience a particular desirable or undesirable effect, and the design of new structures adjusted accordingly.
References for this section
- ↑ Z.-X. Wang, Y. Tu, M. Frohn, J.-R. Zhang, and Y. Shi, Journal of the American Chemical Society, 1997, 119, 11224–11235. {{DOI|10.1021/ja972272g}
- ↑ E. N. Jacobsen, W. Zhang, A. R. Muci, J. R. Ecker, and L. Deng, Journal of the American Chemical Society, 1991, 113, 7063–7064. DOI:10.1021/ja00018a068
- ↑ E. R. Johnson, S. Keinan, P. Mori-Sánchez, J. Contreras-García, A. J. Cohen, and W. Yang, Journal of the American Chemical Society, 2010, 132, 6498–6506. DOI:10.1021/ja100936w
- ↑ J. R. Lane, J. Contreras-García, J.-P. Piquemal, B. J. Miller, and H. G. Kjaergaard, Journal of Chemical Theory and Computation, 2013, 9, 3263–3266. DOI:10.1021/ct400420r
New candidates for investigations: expanding the stilbene set
The final task of the experiment was to suggest a new epoxide to potentially add to the experiment. The goal is twofold; firstly to increase the number of epoxides available to allow a greater number of students to work on different compounds, secondly to find compounds with interesting reactivities or physical properties that could be examined computationally. The search was limited to epoxides with an optical rotatory power of magnitude greater than 500°.

Proposed here are not one but two epoxides: trans-4-chlorostilbene epoxide ( (2R,3R)-2-(4-chlorophenyl)-3-phenyl oxirane) and trans-4-methylstilbene epoxide ( (2R,3R)-2-(4-methylphenyl)-3-phenyl oxirane). They are of potential interest because, alongside trans-stilbene oxide, they form a series of epoxides that differ only by a singly functional group on one of the aromatic rings (H, Cl, Me). A very recent paper[1] reports the systematic analysis of binding potencies of drugs, and how they are affected by the addition of a single methyl group. It showed that the potency could be increased by a factor as high as more than 2'000, which goes to show that even seemingly unimportant groups can have a significant effect on a molecule's activity. (The causes of the shifts in the molecules examined included bond rotation barriers and altered ring conformations, but sometimes even miniscule changes in polarity had significant effects.) An experiment including a series of epoxides with single functional group substitutions could potentially be an interesting exploration of this topic.
The ORP of trans-4-chlorostilbene epoxide has been reported in the literature in benzene and ethanol[2] as well as chloroform[3]. This range of data would allow for a discussion of solvation models in computational chemistry, testing which solvents' results agreed best with the literature, and a theoretical examination of why different solvents would result in different optical rotations.
Trans-4-chlorostilbene epoxide is available for purchase from Sigma Aldrich. Its alkene precursor, trans-4-chlorostilbene, is available from Matrix Scientific but its cost ($225 per 500mg as of 31/10/13) makes its synthesis from 4-chlorostyrene and bromobenzene, both of which are readily available, a more likely premise.
Trans-4-methylstilbene epoxide's ORP has been reported in two of the three solvents above, benzene and ethanol[2], and so the examination of solvent effects could be expanded to both epoxides with analysis of how and why the solvent effects differ between structures. (The recorded magnitudes of trans-4-methylstilbene epoxide's ORP are actually below 500°, but rather around 300°, so it does not match the set criteria in its own right, but is proposed here in conjunction with trans-4-chlorostilbene, which does have a sufficiently large ORP.)
Neither trans-4-methylstilbene epoxide nor its alkene precursor are readily commercially available, but the latter can be synthesised from styrene and p-toluenesulfonyl chloride, both of which are available.
Also, circular dichroism (CD) spectra have been recorded on both of these epoxides[4], offering more literature data for comparison and analysis. Additionally, both molecules' ORPs have only been reported once in each solvent, so it is not unlikely that the assignment or the precise value is incorrect, and the calculations could contribute positively to the amount of information available to the scientific community.
References for this section
- ↑ H. Schönherr and T. Cernak, Angewandte Chemie International Edition, 2013. DOI:10.1002/anie.201303207
- ↑ 2.0 2.1 A. Solladié-Cavallo, A. Diep-Vohuule, V. Sunjic, and V. Vinkovic, Tetrahedron: Asymmetry, 1996, 7, 1783–1788. DOI:10.1016/0957-4166(96)00213-3
- ↑ T. Niwa and M. Nakada, Journal of the American Chemical Society, 2012, 134, 13538–13541. DOI:10.1021/ja304219s
- ↑ P. M. Dansette, H. Ziffer, and D. M. Jerina, Tetrahedron, 1976, 32, 2071–2074. DOI:10.1016/0040-4020(76)85110-1

