Rep:Mod:ap1707inorg
MODULE 2 Anshumalita Patel
Borane
Borane Optimization
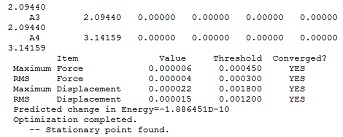
Borane was first drawn in Gaussview and the bond lengths were set to 1.5Å before the molecule was optimized to its lowest energy geometry using Gaussian. The method used was DFT-B3LYP (which identifies the approximations used in solving the Schrodinger equation) and the basis set was 3-21G which determines the accuracy of the calculation (in this case it is low but allows for quick calculations). By looking at the Summary and the Output File it can be verified that the structure had been optimized. Firstly the Summary showed that the gradient was near 0, in the case of borane it gave a value of 0.000003 a.u and the Output showed that the final set of forces had converged. Both these results showed that small displacements no longer affected the energy and so the structure was at equilibrium/had been optimized:
Optimized Borane |
A graph can be obtained of the program scanning the Potential Energy Surface of borane to find the lowest energy geometry and also of the Root Mean Squared Gradient which shows the average deviation from the ideal bond length with each optimization step, ending in the optimum (zero) :
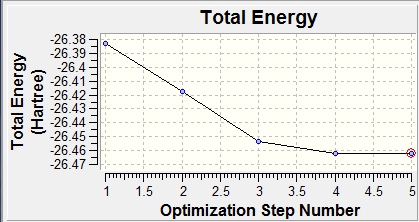
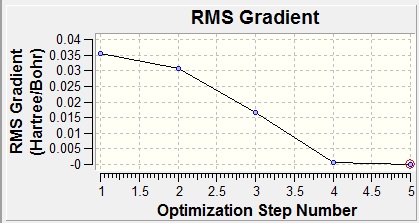
Graphically, this can be seen as a shortening of the bond lengths from the initial 1.5Å to the ideal which was found to be 1.19Å.The ideal angle was given as 120° between boron and each of the hydrogens and the point group was D3h with a total energy of -26.4623 a.u.

Vibrational Analysis of Borane
In order to check that the optimization has given us the lowest energy conformation we must ensure that we are at a minimum on the Potential Energy Surface. To do this we must take the second derivative of the PES and find out if the frequencies are positive (as this would mean a minimum has been reached). A frequency analysis was carried out on borane using Gaussview and yielded the following frequencies for borane (second line):

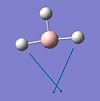
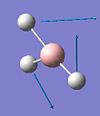
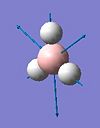
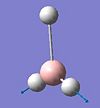
A minimum has indeed been found as none of the frequencies are negative. We can now look at the various vibrational modes of borane:
All the values above are rounded to whole numbers due to the inaccuracy involved in modelling anharmonic vibrations with a harmonic approximation and thus incurring a +/- error of 10%. An IR spectrum was also taken:
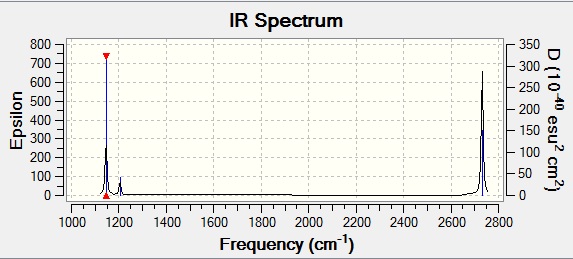
The vibrations which absorb at the highest frequencies are those which need the most energy for the motion to occur and these are, as can be seen in the table above, the stretching motions. This is also reflected in the intensities, where the asymmetric stretches have the highest intensity. However the symmetric stretch has an intensity of 0 and this is because the identical positive and negative movements of the symmetric vibration cancel one another out (this is also the reason that no peak can be seen on the IR for this stretch as it does not result in a change in dipole moment). The wagging vibration is seen at 1146cm-1. The rocking and scissoring vibrations are degenerate and can be seen as the low intensity peak at 1205cm-1. The asymmetric stretches are also degenerate so their peaks also overlap and are seen as one at 2731cm-1.
Molecular Orbitals of Borane
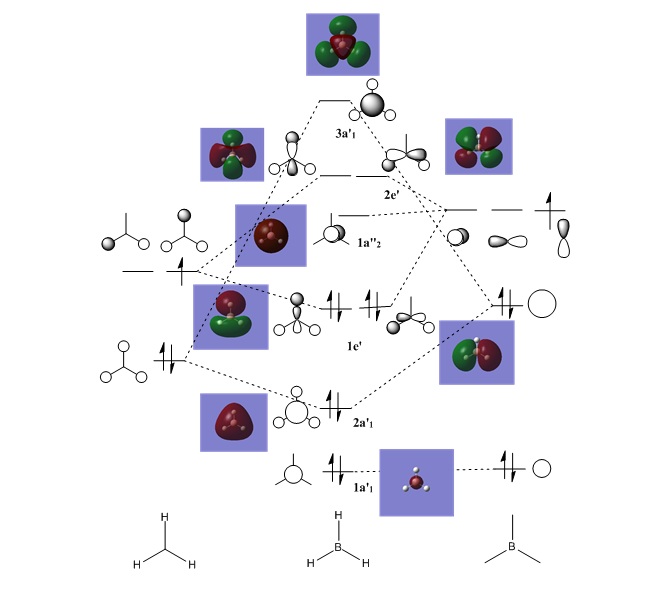
The correlation between the LCAO molecular orbitals and the representations of the "real" molecular orbitals is very good. The MOs shown are the interactions between the hydrogen 1s and the boron 2s and 2p orbitals. It is found that not only do the number and positions of the nodes match well, but also the general form and proportions of the MOs are as predicted. It can be seen that the LUMO is in fact non-bonding rather than anti-bonding which explains the slight electropositivity of boron.
However this method of analysis does have some limitations as can be seen by the two highest antibonding molecular orbitals (3a'1 and 2e'), where it is hard to judge which should be higher because even though s-s interactions are stronger than s-p interactions, a'1 orbitals are usually lower than e' and so they could be swapped around.
Natural Bond Orbital Analysis
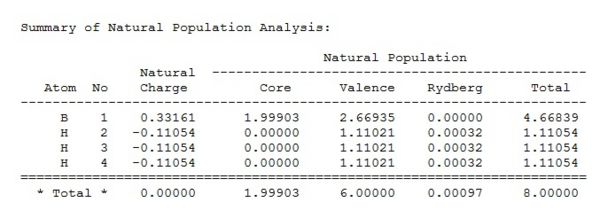
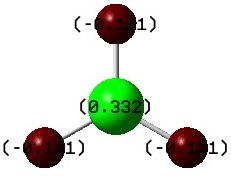
A more quantitative view of the contributions of each fragment to its MO can be found by Natural Bond Orbital Analysis. NBOs are formed from Natural Hybrid Orbitals. They reflect the idea of localized bonds and lone pairs as basic units of molecular structure. The NBO calculations yield information on atomic charges and the percentage contributions of the atomic orbitals to the MO by partitioning the total electron density into what look like AOs. Therefore this is a theoretical technique but aids understanding of electronic distribution and structure. Below are the charges on borane in text format and displayed on an image of the molecule (where red and green represent negative and positive charge respectively).
From this we can see that boron is slightly electropositive and hydrogen is slightly electronegative but that these charges cancel out and so overall there is no dipole moment. This slight positivity on boron explains borane's lewis acidity. Below we can see that this acidity stems from the empty pz Orbital 5 (starred because it is formally occupied) which is able to accept electrons:

All in all,this type of analysis is informative and can be quite good at explaining key points about reactivity and charge distribution.
Thallium Bromide
Thallium Bromide Optimisation
Thallium bromide was optimised to its lowest energy geometry using the DFT-B3LYP method with a medium-level basis set (LanL2DZ). The symmetry was tightly confined to the D3h point group so that the program would return an optimized molecule with a good D3h symmetry. The optimization summary can be seen below:
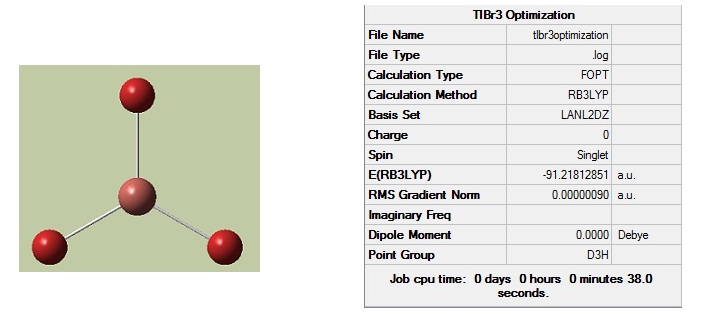
We can check that the forces have converged and a stationary point has been found by looking at the ouput file:

However to make sure a minimum has been reached, a frequency analysis was performed and the following low frequencies were found:

(The same method and basis set had to be used for both these calculations as otherwise the molecule will have been treated in an entirely different way for each calculation and they will not have the same level of accuracy therefore could not be compared). The low frequencies are all positive, proving a minimum has been reached and we can see that the lowest "real" normal mode is 46cm-1.
We can now look at the properties of the optimised structure which shows a bond length of 2.65Å and a bond angle of 120° as expected for a trigonal planar complex. In comparison to the literature[1] (bond length=2.52Å and bond angle=120°) this is very close and would probably be closer if a basis set with greater accuracy were used.
Bonds are sometimes not seen in the returned models from calculations in Gaussview due to the fact that they are set by predefined parameters and so if a bond is too long, it will not be shown as the program will not consider it as such. This leads us to the question of defining the term "bond" and, as chemists, we would think of bonds as an attraction between opposing charges which must be of a certain strength for us to form chemical compounds.
Cis and Trans Molybdenum Complexes [Mo(CO)4(PPh3)2]
Optimization of Molybdenum Isomers
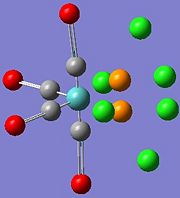
Here we are going to investigate the thermal stability and spectral characteristics of two molybdenum isomers. However because the tri-phenyl phosphine ligands will make the calculations too computationally expensive, they will be swapped with PCl3 which is more easily computable and has a similar electronic contribution to the bonding. The optimization is performed in two steps, first the DFT-B3LYP method was used with a LANL2MB basis set to give an approximately optimized molecule where the dihedral angles are not so well described. If we use this to carry out the second (more precise) optimization it is likely that a minima will be reached which is not the lowest energy one. And so the molecules must be manually adjusted in order that the PCl3 groups are in the correct orientation. When this is done, a second optimization using the more accurate LANL2DZ pseudo-potential and basis set was carried out with the additional line of "int=ultrafine scf=conver=9" to increase the electronic convergence. The output files were checked to see if the forces had converged to a stationary point and then frequency analysis was performed to ensure all the frequencies were positive and that a minimum had been reached.
Cis Isomer Final Optimization Trans Isomer Final Optimization Cis Isomer Frequency Analysis Trans Isomer Frequency Analysis
| Cis Isomer | Trans Isomer | ||||||
|---|---|---|---|---|---|---|---|
|
|
Energy/Geometry Analysis of Molybdenum Isomers

The trans complex appears to have a lower relative energy and therefore is seen to be the more stable isomer. The difference in the energies is only 2.733 kJ/mol, which is much smaller than the value of 72.98kJ/mol found in the literature[2]. This is because there the ligands are actually PPh3 rather than PCl3 and so are much more bulky and probably increase the energy by a great deal in the cis-isomer due to their proximity causing steric strain.
Again, due to the literature[3]referring to the complex with the PPh3 ligand, the values below do not correlate exactly:

For the cis-isomer, the equatorial Mo-C bond is shorter than the axial because the carbonyl takes electron density from the neighbouring PCl3 group and so there is higher electron density in this bond (and thus it is shorter). In the trans isomer the Mo-C bonds are all the same length (approximately equal to the cis axial bond lengh as all the phosphine groups are the same distance apart from the carbonyls.
The P-Mo-P bond angles are close to the expected 95°(cis) and 180°(trans) but are not exact due to the repulsion between the electron rich phosphine groups and the other ligands. The angle is even further distorted on introducing the more bulky PPh3 ligand as can be proved by the literature value for the cis P-Mo-P angle.
Therefore the stability of the complexes seems to depend on both electronics and sterics. If we wanted to alter the relative ordering of these isomers (i.e make cis the more stable isomer) we would have to reduce the size and the electronegativity of the tri-substituted phosphine ligand and so instead of PCl3 or PPh3, we could try perhaps PH3 or PMe3.
Vibrational/IR Analysis of Molybdenum Isomers
Two very low frequency vibrations were seen for both the cis and trans isomers. They manifested themselves as rotations of the chlorine atoms around phosphorous and molybdenum. At room temperature the molecules would be expected to be vibrating in these modes as little energy is required for this type of motion (as observed by the low frequencies):
| Cis Vibrations | Frequency (cm-1) | Intensity | Trans Vibrations | Frequency (cm-1) | Intensity |
 |
11 | 0.03 | 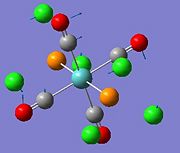 |
5 | 0.09 |
 |
18 | 0.01 | 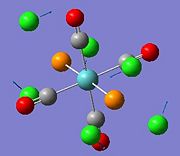 |
6 | 0.00 |
We will now look at the carbonyl vibrational stretches and how they appear on the infrared spectrum:
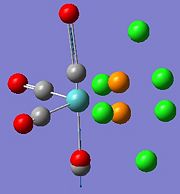
| Cis Vibrations | Frequency (cm-1) | Lit. Freq | Intensity | Trans Vibrations | Frequency (cm-1) | Lit. Freq | Intensity |
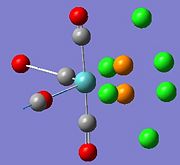 |
1945 | 1867 | 763 | 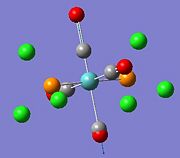 |
1950 | 1889 | 1475 |
 |
1949 | 1896 | 1498 | 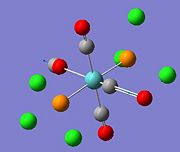 |
1951 | 1889 | 1467 |
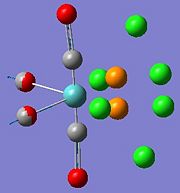 |
1958 | 1924 | 633 | 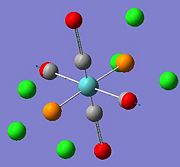 |
1977 | 1924 | 0.64 |
 |
2023 | 2026 | 598 | 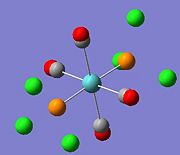 |
2031 | 2026 | 3.79 |
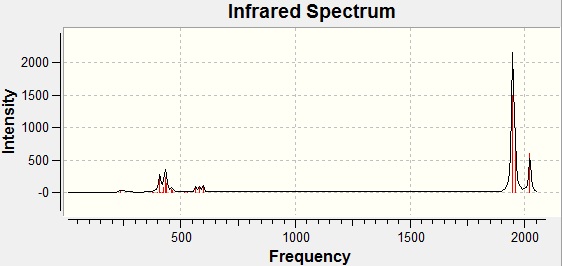
Cis Isomer IR Spectrum
Trans Isomer IR Spectrum
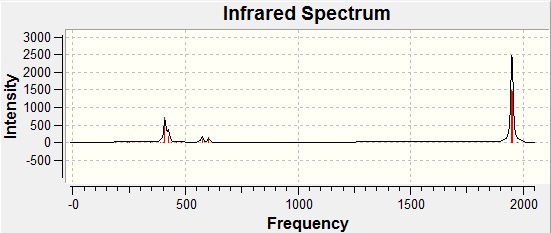
The trans-isomer has a different symmetry to the cis-isomer (it is D4h rather than C2v) and this symmetry means that two of the C=O stretches are degenerate in the trans-complex. They are modes 42 and 43 in the table above which have approximately equal frequencies of 1950cm-1 and 1951cm-1. This is observed on the spectrum as one peak. For the cis-complex, these two stretches are not chemically equivalent and so we find four peaks on the spectrum (one for each stretch). It would seem that the literature values shown (for the complex with PPh3 ligands) are lower than those calculated. This could be due to overestimations in the computational calculations.
Mini Project- Investigation into Borazine and its Monosubstituted Derivatives
An investigation will now be carried out into borazine and the structures and properties of its mono-substituted derivatives. The three substituents that will be looked at are fluorine, chlorine and amino (NH2) which are substituted onto one of the borons of the inorganic ring. Borazine is a planar molecule with D3h symmetry. It is isostructural and isoelectronic to benzene but, unlike benzene, it can undergo addition reactions relatively easily.
We will now look at how certain substitutions affect the molecule.
Firstly, the four molecules were drawn in Gaussview and then optimised using the DFT-B3LYP method and the 6-311G (d, p) basis set- which is good and accurate for "light" molecules. The same method and basis set were used to calculate the frequencies with the additional key words,"pop=(full,nbo)" to obtain a full analysis of the electron density and MOs. The optimised molecules can be seen below:
| Borazine | B-Monochloro-borazine | B-Monofluoro-borazine | B-Monoamino-borazine | ||||||||||||
|---|---|---|---|---|---|---|---|---|---|---|---|---|---|---|---|
|
|
|
|
The output files were checked to ensure that all the forces had converged to a stationary point, and the frequency output file was checked to see if all the frequencies were positive. This was true for all four molecules and so minimums had been found for each of them.
Bond Lengths

The bond lengths agree well with the literature values available[5][6] We can see they vary with the electronegativities of the substituents. The B-F bond is the shortest due to fluorine being the most negative (1.35Å). However, unexpectedly, the B-N bond (1.42Å) is found to be shorter than the B-Cl bond (1.8Å) despite chlorine being more electronegative. This might be due to pi interactions of the sp2 nitrogen lone pair into the empty boron p-orbital which would indeed shorten the bond. It would be expected that the monoaminoborazine is then stabilised by this interaction. We can now look at the charge distribution to see if this might be the case.
NBO Analysis
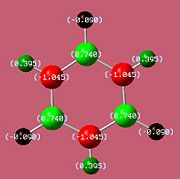
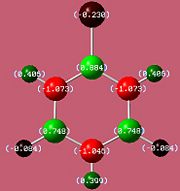
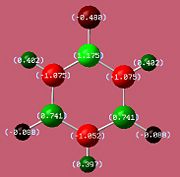
If the assumption above of the pi interaction of the nitrogen lone pair and boron is true, then we would expect that the withdrawal of electron density from the functional nitrogen would result in its two hydrogens having less of a positive charge.
 |
 |
 |
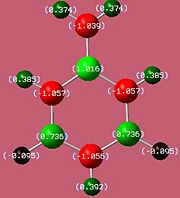 |
As we can see from the charge distribution, the hydrogens on the functional group of B-Monoamino-borazine do indeed have less of a positive charge and so our assumption may carry some weight. As expected the boron bonded to the fluorine is more positive than that bonded to chlorine.
IR Spectra
 |
 |
 |
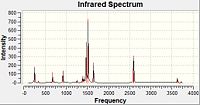 |
The large peaks at 1500cm-1 found on all four spectra are due to the B-N stretching of the ring. The C-Cl stretch is seen at 1026cm-1 and the C-F at 1228cm-1. This would be expected as the greater the dipole moment of the bond, the harder it would be to stretch it due to the increased electrostatic interactions and thus the higher the stretching frequency. For the C-N stretching at 1422cm-1 we could perhaps explain this with the earlier theory of the pi-donation from the lone pair which would increase the double-bond character of this interaction and so would mean the bond was stiffer and the stretching frequency would be higher. The peaks for these stretches are all of a fairly low intensity.
Borazine Freq B-Monochloro-borazine Freq B-Monofluoro-borazine Freq B-Monoamino-borazine Freq
MO Analysis
MOs were calculated using the same method and basis set but with the addtional "pop=full" keywords and the Full NBO tab selected:
Borazine MOs
Chloroborazine MOs
Fluoroborazine MOs
Fluoroborazine MOs
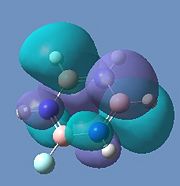
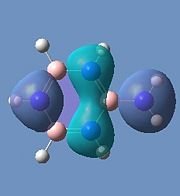
Borazine is made up of a sigma back-bone of sp2 orbitals and a group of delocalized pi orbitals. We can see that the pi orbitals are not symmetrical however and this is because of the large electronegativity difference between boron and nitrogen. The more electronegative nitrogen atoms contribute more to the bonding molecular orbitals and the boron atoms contribute more to the antibonding molecular orbitals. This non-uniform distribution of the pi electrons means that the pi-bonding in the ring is reduced and so is the aromatic stabilisation, thus allowing it to undergo addition reactions.
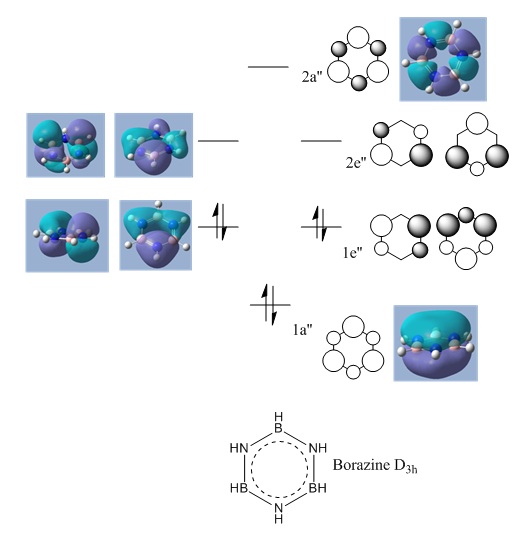
We can see that the LCAO correlate very well with the calculated MO surfaces.
 |
 |
 |
 |
 |
 |
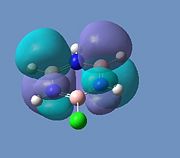
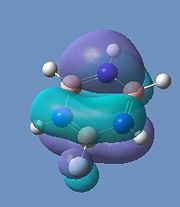
In the substituted molecules, we can see the HOMO has a third node resulting from the functional group and so this second out-of-phase interaction would destabilise these molecules with respect to borazine. The orbitals for aminoborazine seem to be more diffuse due to the decreased electronegative pull from the substituent in comparison to chlorine and fluorine. The LUMOs for all the molecules seem to be very similar.
References
- ↑ J. Blixt et al. J. Am. Chem. Soc., 1995, 117, 5089
- ↑ D. W. Bennett et al. J. Chem. Cryst., 34, 2004 pp. 353-359.
- ↑ DOI:10.1016/S0020-1693(96)05133-X
- ↑ J. Shamir et al. J. Raman Spect., 24, 1993, pp. 101-105
- ↑ K. Parker, S.Davies, Relative Energies and Properties of Fluoroborazines,J. Phys. Chem. A, Vol. 101, No. 49, 1997 9411
- ↑ W. Harshbarger et al.,Structure of B-Monoaminoborazine.J. Am. Chem. Soc., 1969, 91 (3), pp 551–555


