Rep:Mod:aosc13011
PART 1
The hydrogenation of Cyclopentadiene Dimer
Introduction
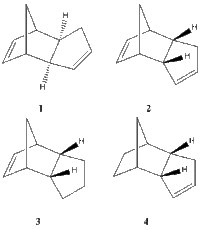
*The aims of this computational exercise are to rationalise the formation of the endo dimer by inspecting the energies of both possible dimerisation outcomes and to determine whether the hydrogenation step is kinetically or thermodynamically controlled.
Energy calculations
The energies of the four compounds were computed via molecular mechanics techniques using both the Avogadro and ChemBio3D software.
Each of the structures was drawn in ChemBio3D and optimized using both the MM2 and MMFF94s force fields. The results of the MM2 force field computations for the total energies are summarized in the table below.
| Compound | Total bond stretching energy | Total angle bending energy | Total torsional energy | Total van der Waals energy | Total electrostatic energy | Total energy |
|---|---|---|---|---|---|---|
| ISOMER 1 | 1.2850 | 20.5806 | 7.6554 | 2.816 | 0.3775 | 31.8764 |
| ISOMER 2 | 1.2509 | 20.8476 | 9.5110 | 2.7762 | 0.4476 | 33.9975 |
| ISOMER 3 | 1.2348 | 18.9383 | 12.1239 | 4.2274 | 0.1631 | 35.9266 |
| ISOMER 4 | 1.0965 | 14.5242 | 12.4974 | 3.4427 | 0.1406 | 31.1520 |
The optimized geometries obtained in ChemBio3D were exported as .cml files and opened in Avogadro, where MMFF94s force field optimizations were performed for each compound. The results are shown below.
| Compound | Total bond stretching energy | Total angle bending energy | Total torsional energy | Total van der Waals energy | Total electrostatic energy | Total energy |
|---|---|---|---|---|---|---|
| ISOMER 1 | 3.54307 | 30.77307 | -2.73335 | 12.80342 | 13.01370 | 55.37349 |
| ISOMER 2 | 3.47132 | 33.17112 | -2.97214 | 12.38562 | 14.21187 | 58.20615 |
| ISOMER 3 | 3.31132 | 31.93650 | -1.47005 | 13.63738 | 5.11951 | 50.44567 |
| ISOMER 4 | 2.82536 | 24.68664 | -0.39107 | 10.65026 | 5.14689 | 41.25949 |
Notes:
- The calculated energies have units of kcal mol-1.
- The MM2 and MMFF94s are different models, therefore the energies obtained within each method should not be compared. However, it is possible to compare the energies within each table.
- As expected, the MMFF94s force field optimization produced the same total energy in both ChemBio3D and Avogadro.
Discussion
Both optimization fields produce the same qualitative result in the sense that they both reveal a higher energy for the 1&2 pair compared to the hydrogenated versions 4&5. It therefore follows that the hydrogenation process leads to compounds which are more stable than the starting dimer.
The energy of the endo form is higher than for the exo one, which makes it less stable. However, bearing in mind that the endo isomer is selectively produced, it results that the reaction is under kinetic control (and follows the endo rule). Even though the endo product is higher in energy, the transition state leading to it is lower in energy than the transition state leading to the exo adduct, thus it is accessed faster and leads to the kinetic product. The calculated energies therefore confirm the theoretical knowledge that the least stable dimer is formed under kinetic control.

The exo dimer is more stable than the endo version mainly due to its lower torsional strain as highlighted by the computed values. The angle bending energy is also lower for the exo form, confirming the better obey to the ideal bond angles in exo c.f. endo.
Upon hydrogenation, one of the isomers 3 or 4 is formed rather than the completely hydrogenated version. The energy of the tetrahydro derivative was found to be 35.2743 kcal mol-1 (MM2 minimization)/38.019 kcal mol-1(MMFF94s minimization), thus lower than the energies of the corresponding dihydro dimers. Since this low energy state is only achieved after prolonged hydrogenation, it follows that the hydrogenation reaction is also kinetically controlled, with lower transition state energies towards the dihydro derivatives.
It is easier to hydrogenate the double bond in the bridged cycle than the one in the unbridged cycle, as can be seen from the lower energy of isomer 4 compared to isomer 3. This effect is produced by the higher torsional energy in 3, which is a consequence of having a double bond "trapped" into a bridged structure. It is therefore expected that the dihydro product formed first will be 4.

Atropisomerism is a type of stereoisomerism whereby chirality arises due to restricted rotation about a single bond (thus no stereogenic center). Therefore there is a barrier of rotation and the isomers can be isolated.
The aim of this computational exercise is to determine which intermediate (9 or 10) from the synthesis of Taxol proposed by Paquette [2] is more stable. In these structures, rigidity arises due to the bridge structure, fused rings and carbonyl group, leading to atropisomerism. The stereochemistry of the carbonyl addition depends on the stability of the isomers.
| Compound | Total bond stretching energy | Total angle bending energy | Total torsional energy | Total van der Waals energy | Total electrostatic energy | Total energy |
|---|---|---|---|---|---|---|
| ISOMER 9 | 2.7847 | 16.5412 | 18.2513 | 11.5567 | -1.7248 | 47.8395 |
| ISOMER 10 | 2.6205 | 11.3393 | 19.6719 | 10.7152 | -2.0023 | 42.6828 |
The molecules were drawn in ChemBio3D and optimized by setting the 6 membered rings into a chair conformations and minimizing the strain around the double bond. MM2 force field optimizations were subsequently performed, leading to the energy values listed in this section's table.
By inspecting the calculated energies it follows that isomer 10 ("down") is more stable than isomer 9 (by about 5 kcal mol-1). In fact, even the initial optimization of structure 9 in ChemBio3D converted the structure into isomer 10, already suggesting the preferred configuration. The important contribution in this sense is that of angle bending strain, which is much higher for the "up" isomer.
In spite of the higher stability of isomer 10, isomer 9 was still obtained in the reported synthesis. This can be rationalized in terms of the nature of the transition state involved in the Cope rearrangement that occurs, which is endo for kinetic reasons.[2]
The above isomers are excellent examples of "hyperstable alkenes" [3]. To understand this concept, one needs to define the notion of "olefinic strain" (OS), which represents the difference between the strain energy of an alkene and that of its parent hydrocarbon. While it may be expected for an alkene to be less stable than its corresponding alkane, this is not the case for bridgehead olefins like 9 and 10, which show negative OS values, and therefore are more stable than their parent hydrocarbons ("hyperstable"). The location of the double bond at a bridgehead confers a remarkable thermodynamical stability to these alkenes, which makes them particularly unreactive. The underlying reason for this lack of reactivity is the stability afforded by the cage structure of these olefins (which is not encountered in their more strained alkane versions), as well as the steric bulk of the bridge and the strength of the π bond.
| Isomer | Torsional strain | Angle bending strain |
|---|---|---|
| 9 | 18.2513 | 16.5312 |
| Corresponding alkane for 9 | 19.6037 | 14.7105 |
| Energy difference (OS) | -1.3524 | 1.8307 |
| 10 | 19.6719 | 11.3393 |
| Corresponding alkane for 10 | 22.1163 | 14.2261 |
| Energy difference (OS) | -2.4444 | -2.8868 |
All these aspects are applicable to the olefins in discussion, 9 and 10. Inspection of the torsional and angle bending energies of their corresponding alkanes reveals lower torsional energies for both alkenes c.f. their hydrogenated versions. For olefin 10, the angle bending energy is also significantly lower. The values of the olefinic strains are negative, confirming the "hyperstability" of the alkenes in discussion. As expected, the stabilization is greater for isomer 10 than for 9.
In conclusion, atropisomers 9 and 10 were proven to be hyperstable alkenes; their stability / lack of reactivity was proved via computational methods.
Notes
- In the bridgehead alkenes, the strain energy comprises of the double bond strain and the C skeleton residual strain.[4]
- To compute the energy values of the corresponding alkanes, the olefin structures were opened in ChemBio3D, the bond order was set to "single" for the olefinic bond and an MM2 minimization was performed. Even though the preffered conformation of the parent alkane might not be the same as the olefin's, the OS obtained are still reliable, because they reflect changes in energy which would occur in real-life reactions such as hydrogenations.[3]
Spectroscopic Simulation using Quantum Mechanics
Molecule 18, which is a derivative of compound 10, was subjected to a spectroscopic simulation to predict the 13C NMR and 1H NMR chemical shifts.
Procedure
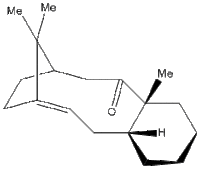
The structure was drawn into ChemBio3D and subjected to multiple MM2 force field optimization following various adjustments in the position of the atoms to minimize repulsions. After finding a low enough energy value (64.2207 kcal mol-1), the file was saved in a .cml format and opened in Avogadro. A MMFF94s force field minimization was performed. From the Extensions/Gaussian menu, the following parameters were implemented:
- Geometry optimisation (Opt + Freq)
- Theory: B3LYP
- Basis set: 6-31G(d,p)
- Solvation mode: CPCM, Chloroform
- Keywords: Freq NMR, Empirical Dispersion = GD3
The generated input file was submitted to the HPC system. When the job was indicated as finished, the formatted checkpoint file was downloaded and opened in Gaussview. The NMR spectra were accessed from Results/NMR, paying attention to select the corresponding basis set, the TMS reference and the benzene solvent. The .txt files containing the chemical shifts were used for comparison with the literature. The spectra were also exported as .svg files.
Notes:
- There are 8 possible isomers of the structures which arise from the possible conformations of the two ring structures. The lowest possible configuration was not identified, which is a source of error in the chemical shifts prediction.
- In the conformation used for the spectrum computations, the 6-membered ring adopts a boat configuration. The lowest possible conformation probably contains this ring in a chair conformation in combination with a low energy conformation for the sulfur containing ring.
13C NMR
The molecule contains 20 C atoms giving rise to 20 13C NMR signals (predicted and experimental[5]). While some of the predicted chemical shifts are in very close agreement with the actual values found experimentally, some predicted values show significant deviations from reality. One particular shift is significantly far from the actual value, with a 14.37 ppm difference. From the .txt output of the calculation if follows that this signal corresponds to the quaternary C atom at the junction of the rings (C16), which is therefore directly bonded to 2 sulfur atoms. There is also a quite significant deviation for C12, which is directly bonded to C16. Such deviations are produced by the proximity of the S atoms ("heavy element"). Spin-orbit coupling errors are present and a correction should be implemented to make the results more reliable.
| δ Predicted (ppm) | δ Literature [5] (ppm) | Difference (ppm) |
|---|---|---|
| 211.73 | 211.49 | -0.24 |
| 148.56 | 148.72 | 0.16 |
| 118.73 | 120.9 | 2.17 |
| 88.98 | 74.61 | -14.37 |
| 67.78 | 60.53 | -7.25 |
| 56.01 | 51.30 | -4.71 |
| 55.49 | 50.94 | -4.55 |
| 50.01 | 45.53 | -4.48 |
| 48.09 | 43.28 | -4.81 |
| 44.12 | 40.82 | -3.30 |
| 41.93 | 38.73 | -3.20 |
| 37.49 | 36.78 | -0.71 |
| 35.21 | 35.47 | 0.26 |
| 30.94 | 30.84 | -0.10 |
| 28.74 | 30.00 | 1.26 |
| 28.56 | 25.56 | -3.00 |
| 25.64 | 25.35 | -0.29 |
| 25.15 | 22.21 | -2.94 |
| 23.29 | 21.39 | -1.90 |
| 20.95 | 19.83 | -1.12 |
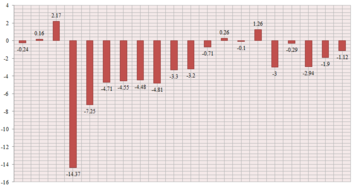
- Literature assignment: 75 MHz, C6D6.
- The output spectrum can be accessed here.
1H NMR
Literature signals (ppm): 5.21 (m, 1H), 3.00-2.70 (m, 6H), 2.70-2.35 (m, 4H), 2.20-1.70 (m, 6 H), 1.58 (t, J=5.4 Hz, 1H), 1.50-1.20 (m, 3H), 1.10 (s, 3H), 1.07 (s, 3H), 1.03 (s, 3H) .
Computed signals (ppm): 5.29, 3.32, 3.22, 3.12, 2.86, 2.46, 2.40, 2.28, 2.09, 1.97, 1.86, 1.68, 1.62, 1.50, 1.42, 1.36, 1.16, 1.07, 0.97.
As for the 13C NMR spectrum, most computed signals are very close to the experimental values. However, this method only allows for chemical shift comparisons, and a full spectrum simulation needs to be performed in order to properly compare a prediction to the actual spectrum.
- Literature assignment: 300 MHz, C6D6.
- The output spectrum can be accessed here.
PART 2
Analysis of the properties of the synthesised alkene epoxides
The two catalytic systems
The crystal structure of the two catalysts
Procedure
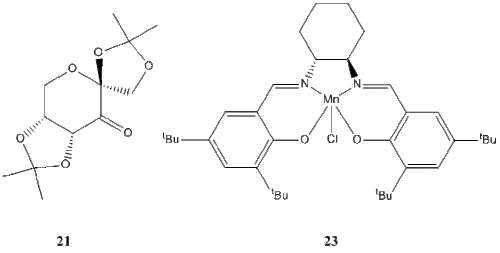
Pre-catalysts 21 and 23 (for Shi and Jacobsen epoxidations respectively) were searched in the Cambridge Crystal Database (CCDC) using the ConQuest program. A search hit for each compound was selected and opened in Mercury. The crystal structures found are included in the table below.
| The Shi-pre catalyst (21) | The Jacobsen pre-catalyst(23) | ||||||
|---|---|---|---|---|---|---|---|
|
|
Comments
Shi pre-catalyst (21)
There are two independent molecules in the asymmetric unit.[6]
The C-O-C bond distances were measured. 2 of these bond lengths are equal and longer (0.144 nm) compared to the other 2 (0.138 & 0.142 nm). All these values are, however, very close.
Jacobsen pre-catalyst (23)
Again, there are two independent molecules in the asymmetric unit. [7]
Structure particularities: the Mn atom is pentacoordinated in a distorted square pyramid, with N and O atoms at the slightly distorted (tetrahedral) base and a Cl atom at the apex. Although they are sterically demanding, the close tBu groups are far enough to avoid unfavourable interactions and do not distort the shape of the molecule.
The calculated NMR properties of 2-Phenyloxirane and trans-2,3-diphenyloxirane
Procedure
Each epoxide was drawn into ChemBio3D and saved in a .cml format after performing a MM2 force field optimization. The .cml files were opened in Avogadro and a MMFF94s force field minimization was performed. From the Extensions/Gaussian menu, the following parameters were implemented:
- Geometry optimisation (Opt + Freq)
- Theory: B3LYP
- Basis set: 6-31G(d,p)
- Solvation mode: CPCM, Chloroform
- Keywords: Freq NMR, Empirical Dispersion = GD3
The generated input file was submitted to the HPC system. When the job was indicated as finished, the formatted checkpoint file was downloaded and opened in Gaussview. The NMR spectra were accessed from Results/NMR, paying attention to select the corresponding basis set, the TMS reference and the chloroform solvent. The .txt files containing the chemical shifts were used for comparison with the literature. The spectra were also exported as .svg files. DOI:10042/25695
2-Phenyloxirane spectra
13C NMR
| δ Predicted (ppm) | δ Literature [8] (ppm) | Difference (ppm) |
|---|---|---|
| 135.1 | 137.5 | 2.4 |
| 124.1 | 128.4 | 4.3 |
| 123.4 | 128.1 | 4.7 |
| 122.9 | 125.4 | 2.5 |
| 118.3 | - | - |
| 54.0 | 52.2 | -1.8 |
| 53.5 | 51.1 | -2.4 |
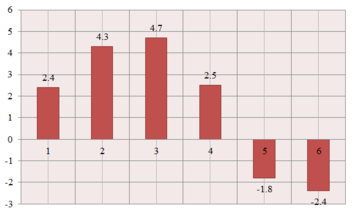
The molecule contains 8 carbon atoms (numbered structure). Though it is not symmetric (as can be seen in the 3D model, which shows C4-C6 and C1-C3 in slightly different environments compared to the epoxide structure), the literature assignment [8] recognizes only 6 carbon environments. This is most probably due to the rotation of the molecule and the resolution of the spectrometer (75 MHz, CDCl3); the C4-C6 and C1-C3 carbons are averaged and "seen" as equivalent.
The predicted chemical shifts are reasonably close to the experimental values (the differences are represented in the graph on the right). However, 7 carbon environments rather than 6 are expected to be seen in this case. According to the .txt output file, C2 and C6 are equivalent and there is an extra peak corresponding to C4. This result is quite surprising, because C2 and C6 are clearly in different environments; it would have been more understandable to have one of the C1-C3 or C4-C6 pairs seen as equivalent. It therefore follows that the degeneracy predicted by the calculation is accidental, and there should actually be 8 signals predicted, confirming the actual lack of symmetry of the structure.
A more accurate comparison of the predicted shifts with the experimental values involves averaging the chemical shifts for the C4-C6 and C1-C3 carbons to mimic the averaging observed in reality. The following correlation follows (1st number = predicted, 2nd number = literature; units = ppm):
- 135.1 -> 137.5; 120.55 -> 128.4; 123.75 -> 128.1; 122.9 -> 125.4; 54 -> 52.2; 53.5 -> 51.1.
While there are differences in the chemical shift values, the agreement with the literature is reasonable.
The spectrum clearly distinguishes between the aromatic region (135.1-118.3 ppm) and the aliphatic part corresponding to the epoxide part of the molecule (54.0-53.5 ppm).
- Note: The numbering of the carbon atoms was taken to be the same as in the .cml file loaded into Avogadro for producing the HPC input file; that .cml file was used to produce the jmol representation.
- The output spectrum can be accessed here.
1H NMR
| δ Predicted (ppm) | δ Literature [8] (ppm) |
|---|---|
| 7.51-7.29 (5 signals) | 7.33-7.28 (5H multiplet) |
| 3.66 | 3.86 |
| 3.12 | 3.15 |
| 2.54 | 2.81 |
The predicted 1H NMR spectrum is in good agreement with the literature[8] (300 MHz, CDCl3), with small differences between the predicted and actual chemical shift values. The spectrum is comprised of the aromatic region at ~7 ppm corresponding to the 5 aromatic protons and the aliphatic one with 3 epoxide signals at ~3 ppm (deshielded due to the oxygen atom proximity).
- The output spectrum can be accessed here.
2,3-diphenyloxirane spectra
13C NMR
| δ Predicted (ppm) | δ Literature [9] (ppm) | Difference (ppm) |
|---|---|---|
| 134.1 | 137.1 | 3 |
| 124.2 | 128.6 | 4.4 |
| 123.5 | 128.3 | 4.8 |
| 123.2 | 125.5 | 2.3 |
| 118.3 | - | - |
| 66.4 | 62.8 | -3.6 |

The molecule contains 14 carbon atoms (numbered structure). For symmetry reasons, only 5 chemical environments appear to be present, with the following groups of carbon atoms being equivalent: C7-C8, C4-C9, C3-C5-C10-C14, C2-C6-C11-C13, C1-C12. Indeed, there are 5 signals reported in the literature [9]. However, the prediction refers to 6 rather than 5 shifts, with an extra signal at 118.3 ppm. According to the NMR report, this signal corresponds to C5 and C14. Analysing the peak list it can be seen that the prediction takes the following couples of carbons as equivalent: C7-C8, C4-C9, C3-C10, C5-C14, C2-C11, C6-C13, C1-C12. This gives some insight into the extent of symmetry of the molecule in the sense that atom pairs such as C5 and C10 do not "see" the exact same environment, being at different difference compared to the epoxide part of the molecule. However, these subtle differences are not detected by the resolution of the spectrometer in the literature (125 MHz, CDCl3). It therefore follows that the prediction gives a more accurate insight into the symmetry of the molecule.
The predicted chemical shifts are reasonably close to the experimental values (the differences are represented in the graph on the right). The spectrum clearly distinguishes between the aromatic region (134.1-118.3 ppm) and the aliphatic part corresponding to the middle epoxide section (66.4 ppm).
- Note: The numbering of the carbon atoms was taken to be the same as in the .cml file loaded into Avogadro for producing the HPC input file; that .cml file was used to produce the jmol representation.
- The output spectrum can be accessed here.
1H NMR
| δ Predicted (ppm) | δ Literature [9] (ppm) |
|---|---|
| 7.57-7.47 (10 signals) | 7.40-7.32 (10H multiplet) |
| 3.54 | 3.87 |
The predicted 1H NMR spectrum is in good agreement with the literature [9](500 MHz, CDCl3), with small differences between the predicted and actual chemical shift values. The spectrum is comprised of the aromatic region at ~7.5 ppm corresponding to the 8 equivalent aromatic protons and the aliphatic one with an epoxide signal at 3.54 ppm corresponding to the two equivalent aliphatic protons (deshielded due to the oxygen atom proximity.
- The output spectrum can be accessed here.
Assigning the absolute configuration of the product
The reported literature for optical rotations (589 nm, CHCl3)
The values for the optical rotation were searched using Reaxys.
2-Phenyloxirane
(R) form: [α]20D = -19.5 deg[10]
(S) form: [α]20D = +20 deg[11]
2,3-diphenyloxirane
(2R, 3R) form: [α]22D = +250.8 deg[12]
(2S, 3S) form: [α]20D = -205.2 deg[9]
Optical rotation calculations
Procedure
The formatted checkpoint files for the previous NMR computations were downloaded and opened in Gaussview. They were saved as .gjf files, then opened in Notepad++ to implement the following parameters:
- cam-b3lyp/6-311++g(2df,p) polar(optrot) scrf(cpcm,solvent=chloroform) CPHF=RdFreq
- wavelengths: 589 nm 365 nm
The resulting log files were inspected to find the [alpha]D values for each molecule.
Results
2-Phenyloxirane (DOI:10042/25705 )
[α]D = - 30.36 deg. This is comparable to the literature [10] value of -19.5 deg, which suggests that the drawn isomer is (R). The closeness of the computed and actual values is accurate enough given the use of a non-tailored basis set.
The reliability of the computation was tested by drawing the other enantiomer (S) and computing, following the same procedure, its optical rotation. A value of +30.44 deg was obtained, which mirrors the -30.36 deg previously computed, validating the calculation. (DOI:10042/25715 )
2,3-diphenyloxirane (DOI:10042/25706 )
[α]D = + 299.42 deg. This is comparable to the literature [12] value of +250.8 deg, which suggests that the drawn isomer is (R,R). The closeness of the computed and actual values is accurate enough given the use of a non-tailored basis set.
The reliability of the computation was tested by drawing the other enantiomer (S, S) and computing, following the same procedure, its optical rotation. A value of - 297.98 deg was obtained, which mirrors the +299.98 deg previously computed, validating the calculation. (DOI:10042/25731 )
Electronic circular dichroism (ECD) spectrum calculation
- Note: Due to the absence of a chromophore, 2-Phenyloxirane was not modeled for this part. 2,3-diphenyloxirane does not seem to have a strong chromophore either, but was nevertheless attempted to be studied.
Procedure
The formatted checkpoint file for the previous NMR computation for 2,3-diphenyloxirane was downloaded and opened in Gaussview. It was saved as .gjf files, then opened in Notepad++ to invoke the following keywords:
- CAM-B3LYP/6-311+G(d,p) td(NStates=20) scrf(cpcm,solvent=chloroform)
The file was submitted on the HPC system and the output log file was opened in Gaussview. The predicted UV-Vis and ECD spectra were accessed from Results/UV-Vis. The axes were inverted to allow for literature comparisons.
ECD spectrum:

UV-Vis spectrum:

Discussion
As the above image shows, the maximum absorption in the ECD spectrum is between 200 and 220 nm, which is too low to be measured in practice. Therefore no comparison with the literature is possible and this calculation does not give any useful insight into the properties of the epoxide. If, however, the molecule also contained groups such as -NO2, a chromophore would have definitely been present and a comparison with the literature would have probably been possible.
Predicting the stereochemical outcome of the β-methyl styrene epoxidation
Shi epoxidation of trans β-methyl styrene
The transition states for the R,R and S,S series for the Shi epoxidation of trans β-methyl styrene available in the script were inspected and the minimum free energy values for each series were selected after accessing the log files linked in the tables (the energies provided by the log files are corrected for entropy, zero-point thermal energies and solvation).
To work out the enantiomeric excess, the following transformation was imagined:
(R,R) TS -> (S,S) TS
The energy difference between the two states was then converted into units of kJ mol-1. To work out the equilibrium constant, the following equation was used: ΔG = -RT ln K (therefore K = exp (ΔG/(-RT)), R = 0.008314 kJ mol-1, T = 298.15 K). The table below summarizes the results of these calculations:
| R,R series min (Hartree) | S,S series min(Hartree) | Difference (Hatree) | Difference (kJ mol-1) | Equilibrium constant (K) |
|---|---|---|---|---|
| -1343.03244 | -1343.024742 | 0.007701 | 20.2189755 | 0.000287 |
| R,R |
S,S | |
|---|---|---|
| Initial | 1 | 0 |
| Consumed | x | 0 |
| Final | 1-x | x |
Using the rationale on the left, the equilibrium constant is equal to x/1-x. Simple maths reveal that the value of x is 0.000286918, which make the final concentration of (R,R) 0.999713082 and that of (S,S), 0.000286918. Therefore the enantiomeric excess of (R,R) is over 99.97%, which means that this product is enantioselectively produced in the reaction. It was actually obvious from the very low value of K that the "reaction" imagined here is driven to the left, hence towards the (R,R) form.
In conclusion, the (R,R) enantiomer is expected to be enantioselectively produced in the epoxidation of trans β-methyl styrene using the Shi catalyst. This theoretical prediction is in agreement with the literature [13], where it is shown that the (R,R) form was obtained in 90% ee.
Jacobsen epoxidation of cis β-methyl styrene
Similar to the previous computation for the epoxidation of the trans isomer, the transition states for the S,R and R,S series for the Jacobsen epoxidation of cis β-methyl styrene available in the script were inspected and the minimum free energy values for each series were selected after accessing the log files linked in the tables. The free energy difference was found in the same way as before, imagining the transformation (S,R) TS -> (R,S) TS.
The following table shows the values that were used in the calculation:
| S,R series min (Hartree) | R,S series min(Hartree) | Difference (Hatree) | Difference (kJ mol-1) | Equilibrium constant (K) |
|---|---|---|---|---|
| -3383.259559 | -3383.25106 | 0.008499 | 22.3141245 | 0.000123 |
Following the same calculation procedure as before, the final concentration of (S,R) is found 0.999877015 and that of (R,S), 0.000122985. Therefore the enantiomeric excess of (S,R) is over 99.98%, which means that this product is enantioselectively produced in the reaction. Again, this is also obvious from the very low K value found above, which favours the left side of the reaction.
In conclusion, the (S,R) enantiomer is expected to be enantioselectively produced in the epoxidation of cis β-methyl styrene using the Jacobsen catalyst. This theoretical prediction is in agreement with the literature [14], where it is shown that the (S,R) form was obtained in 92% ee.
Investigating the non-covalent interactions in the active-site of a reaction transition state ( β-methyl styrene epoxidation)
Procedure
The .fchk file of the first transition state in the R,R series for the Shi epoxidation of β-methyl styrene (DOI:10.6084/m9.figshare.738028 ) was downloaded and opened in Gaussview.
- Results - Surfaces - Contour - Cube Actions - New Cube.
- Options: Total density, Grid = Medium.
- When the cube was shown available, it was saved into the temp directory on the C drive.
- This pagewas accessed to convert the density cube into an NCI surface.
- The .xyz and .jvxl files generated were saved.
Results
| NCI surface | |||
|---|---|---|---|
|
Analysing the NCI surface allows the modelling of hydrogen bonds, electrostatic attractions and dispersion-like approaches of atoms. There is a colour code associated with this method: strong attractive interactions are blue, weak interactions are green, yellow means mildly repulsive and red, strongly repulsive.
The surface above has extended green regions representing weak attractive interactions between the Shi catalyst and the substrate, which is favorable for the reaction occurrence. The small circular region on the dioxygen structure indicates the bond forming in the transition state. The green regions can be rationalized in terms of hydrogen bonding: the electronegative atoms on the catalyst are favorably interacting with the H atoms on the substrate.
Investigating the Electronic topology (QTAIM) in the active-site of the reaction transition state
QTAIM focuses on the electron density (and its curvature) in the covalent regions of the molecule.
Procedure
The .wfn file of the fourth transition state (lowest in energy) in the R,R series for the Shi epoxidation of trans β-methyl styrene (DOI:10.6084/m9.figshare.738037 ) was downloaded and opened in Avogadro (Extensions/QTAIM/Molecular graph). The computation took ~15 minutes to complete.
- The display icon was selected.
- From Display Settings, ball & stick was turned off.
- QTAIM was viewed in Display Types.
- The structure was screen shot.
- The bond topological critical points (BCPs) are shown as small yellow spheres. Therefore the yellow dots represent regions of high electron density whereas the purple dots are the atoms in the molecule.
Results
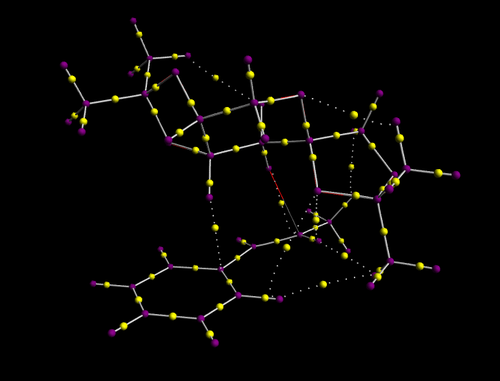
The QTAIM representation shows the regions of high electron density as the catalyst approaches the substrate.
Suggesting new candidates for investigations
Procedure
Reaxys was searched for epoxides (as a substructure). The following advanced property was implemented: ORP.ORP<'-500' or ORP.ORP>'500'. The query returned 123 hits.

Proposal
Most of the molecules returned by the query involved a very high level of complexity and were seldom prepared in the literature. They contained multiple asymmetric centers difficult to access.
The most realistic potential candidate for next year's computational tasks is probably cis R-(+)-pulegone oxide. Its optical rotatory power at 589 nm has been reported in the literature in multiple papers. The corresponding alkene is also conveniently available on Sigma Aldrich.
References
- ↑ P. Caramella, P. Quadrelli, L. Toma, J. Am. Chem. Soc., 2002, 124, 1130-1131. DOI:10.1021/ja016622h
- ↑ 2.0 2.1 S. W. Elmore, L. Paquette, Tetrahedron Letters, 1991, 319, 483 - 488. DOI:10.1016/S0040-4039(00)92617-0 10.1016/S0040-4039(00)92617-0 10.1016/S0040-4039(00)92617-0 10.1016/S0040-4039(00)92617-0 10.1016/S0040-4039(00)92617-0
- ↑ 3.0 3.1 W. F. Maier, P. Von Rague Schleyer, J. Am. Chem. Soc., 1981, 103, 1891. DOI:10.1021/ja00398a003
- ↑ P. M. Lesko, R. B. Turner, J. Am. Chem. Soc., 1968, 90, 6888. DOI:10.1021/ja01026a084
- ↑ 5.0 5.1 L. Paquette, N. A. Pegg, D. Toops, G. D. Maynard, R. D. Rogers, J. Am. Chem. Soc., 1990, 112, 277-283. DOI:10.1021/ja00157a043
- ↑ M. Durík, V. Langer, D. Gyepesová, J. Micová, B. Steiner, M. KoósActa Cryst., 2001, E57, o672-o674. DOI:10.1107/S160053680101073X
- ↑ J. W. YOON, T.S. YOON,S. W. Lee, W.Shin, Acta Cryst., 1999, C55, 1766-1769. DOI:10.1107/S0108270199009397
- ↑ 8.0 8.1 8.2 8.3 D. Forbes, S. Bettigeri, S. Patrawala, S. Pischek, M. Standen, Tetrahedron, 2009, 65, 70–76. DOI:10.1016/j.tet.2008.10.019
- ↑ 9.0 9.1 9.2 9.3 9.4 T. Niwa, M. Nakada, J. Am. Chem. Soc, 2012, 134 , 13538–13541. DOI:10.1021/ja304219s
- ↑ 10.0 10.1 J. Schrittwieser, W. Kroutil, I. Lavandera, B. Seisser, B. Mautner, J. Lutje Spelberg, Tetrahedron: Asymmetry, 2009, 20 , 483 - 488. DOI:10.1016/j.tetasy.2009.02.035
- ↑ A. Piccinini, S. Kavanagh, S. Connon, Chemical Communications (Cambridge, United Kingdom), 2012, 48 , 7814 - 7816. DOI:10.1039/C2CC32101G
- ↑ 12.0 12.1 D. Fox, D.S. Pedersen, S. Warren, Org. Biomol. Chem., 2006, 4 , 3117-3119. DOI:10.1039/b606881b
- ↑ A. Wong, B. Wang, M-X Zhao, Y. Shi,J. Org. Chem., 2009, 74 , 335–6338. DOI:10.1021/jo900739q
- ↑ E. N. Jacobsen, W. Zhang, A. R. Muci, J. R. Ecker, L. Deng, J. Am. Chem. Soc., 1991, 113, 7063–7064. DOI:10.1021/ja00018a068
