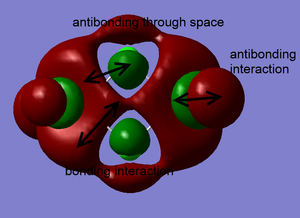
Rep:Mod:annyinorganic
Week One
Optimization Analysis of BH3
3-21G optimized BH3
A BH3 molecule has been created by Gaussview program; before optimization, the bond length of three B-H bonds have been changed to be 1.55Å, 1.54Å, 1.53Å in order to break the symmetry of the molecule. Then the molecule was optimized using B3LYP method and 3-21G basis set.
The out-put log file:BH3 3-21G
| Compound | File Type | Calculation Type | Calculation Method | Basis Set | Charge | Spin | Final Energy in au | Gradient | Dipole Moment | Point Group | Job cpu Time |
|---|---|---|---|---|---|---|---|---|---|---|---|
| BH3 | .log | FOPT | RB3LYP | 3-21G | 0 | Singlet | -26.46226433 | 0.00004507 | 0.0000 | D3H | 0 days 0 hours 0 minutes 5.0 seconds |
To check if the job has been successfully converged, an 'Item' table is shown below. It tells what forces have been converged. Also, according to the table, all gradient values were quite close to zero, ie less than 0.001; hence, the optimization job was complete.
        Item               Value     Threshold  Converged?
 Maximum Force            0.000220     0.000450     YES
 RMS     Force            0.000106     0.000300     YES
 Maximum Displacement     0.000940     0.001800     YES
 RMS     Displacement     0.000447     0.001200     YES
 Predicted change in Energy=-1.672479D-07
 Optimization completed.
    -- Stationary point found.
                           ----------------------------
                           !   Optimized Parameters   !
                           ! (Angstroms and Degrees)  !
 --------------------------                            --------------------------
 ! Name  Definition              Value          Derivative Info.                !
 --------------------------------------------------------------------------------
 ! R1    R(1,2)                  1.1948         -DE/DX =   -0.0002              !
 ! R2    R(1,3)                  1.1944         -DE/DX =   -0.0001              !
 ! R3    R(1,4)                  1.1947         -DE/DX =   -0.0002              !
 ! A1    A(2,1,3)              119.986          -DE/DX =    0.0                 !
 ! A2    A(2,1,4)              120.0157         -DE/DX =    0.0                 !
 ! A3    A(3,1,4)              119.9983         -DE/DX =    0.0                 !
 ! D1    D(2,1,4,3)            180.0            -DE/DX =    0.0                 !
 --------------------------------------------------------------------------------
 GradGradGradGradGradGradGradGradGradGradGradGradGradGradGradGradGradGrad
Optimized B-H bond length and H-B-H bond angle have summarized in the following table. Bond length was accurate to 0.01Å, and bond angle was accurate to 0.1o. By comparing to literature, both bond distance and angle were the quite close to the theoretical values; the molecule also had a point group of D3H.
| Basis Set | B-H Bond Length(Å) | H-B-H Bond Angle(°) |
| 1.19 | 120.0 | |
| 1.19 | 120.0 | |
| 1.19 | 120.0 | |
| Average | 1.19 | 120.0 |
| Literature[1] | 1.19 | 120 |
6-31G(d,p) optimized BH3
A new optimization of BH3 was done using a higher level basis: 6-31G(d,p).
The out-put log file:BH3 6-31G(d,p)
| Compound | File Type | Calculation Type | Calculation Method | Basis Set | Charge | Spin | Final Energy in au | Gradient | Dipole Moment | Point Group | Job cpu Time |
|---|---|---|---|---|---|---|---|---|---|---|---|
| BH3 | .log | FOPT | RB3LYP | 6-31G(d,p) | 0 | Singlet | -26.61532363 | 0.00000296 | 0.00 | D3H | 0 days 0 hours 0 minutes 6.0 seconds |
Again, the optimization job was checked by the item table. Since all gradient terms were close to zero and forces were all converged, it can be concluded that the optimization job was successful.
        Item               Value     Threshold  Converged?
 Maximum Force            0.000006     0.000450     YES
 RMS     Force            0.000004     0.000300     YES
 Maximum Displacement     0.000023     0.001800     YES
 RMS     Displacement     0.000015     0.001200     YES
 Predicted change in Energy=-2.008834D-10
 Optimization completed.
    -- Stationary point found.
                           ----------------------------
                           !   Optimized Parameters   !
                           ! (Angstroms and Degrees)  !
 --------------------------                            --------------------------
 ! Name  Definition              Value          Derivative Info.                !
 --------------------------------------------------------------------------------
 ! R1    R(1,2)                  1.1923         -DE/DX =    0.0                 !
 ! R2    R(1,3)                  1.1923         -DE/DX =    0.0                 !
 ! R3    R(1,4)                  1.1923         -DE/DX =    0.0                 !
 ! A1    A(2,1,3)              120.0            -DE/DX =    0.0                 !
 ! A2    A(2,1,4)              120.0            -DE/DX =    0.0                 !
 ! A3    A(3,1,4)              120.0            -DE/DX =    0.0                 !
 ! D1    D(2,1,4,3)            180.0            -DE/DX =    0.0                 !
 --------------------------------------------------------------------------------
 GradGradGradGradGradGradGradGradGradGradGradGradGradGradGradGradGradGrad
| Basis Set | B-H Bond Length(Å) | H-B-H Bond Angle(°) |
| 1.19 | 120.0 | |
| 1.19 | 120.0 | |
| 1.19 | 120.0 | |
| Average | 1.19 | 120.0 |
| Literature[1] | 1.19 | 120 |
The total energies of the molecule BH3 using different basis set were compared in the following table. It could be seen that the higher basis set had a lower energy (about 400 kJ/mol).
| 3-21G | 6-31G(d,p) |
|---|---|
| -26.46226433 au | -26.61532363 au |
Optimization Analysis of GaBr3
In order to investigate pseudo-potentials and larger basis sets, GaBr3 has been created by Gaussview followed by optimization using B3LYP method and LANL2DZ basis set. Its point group was restricted to D3h.
The out-put file: DOI:10042/26238
| Compound | File Type | Calculation Type | Calculation Method | Basis Set | Charge | Spin | Final Energy in au | Gradient | Dipole Moment | Point Group | Job cpu Time |
|---|---|---|---|---|---|---|---|---|---|---|---|
| GaBr3 | .log | FOPT | RB3LYP | LANL2DZ | 0 | Singlet | -41.70082783 | 0.00000016 | 0.00 | D3H | 0 days 0 hours 0 minutes 8.0 seconds |
Item table was used to check the optimization job was successfully converged.
         Item               Value     Threshold  Converged?
 Maximum Force            0.000000     0.000450     YES
 RMS     Force            0.000000     0.000300     YES
 Maximum Displacement     0.000003     0.001800     YES
 RMS     Displacement     0.000002     0.001200     YES
 Predicted change in Energy=-1.282693D-12
 Optimization completed.
    -- Stationary point found.
                           ----------------------------
                           !   Optimized Parameters   !
                           ! (Angstroms and Degrees)  !
 --------------------------                            --------------------------
 ! Name  Definition              Value          Derivative Info.                !
 --------------------------------------------------------------------------------
 ! R1    R(1,2)                  2.3502         -DE/DX =    0.0                 !
 ! R2    R(1,3)                  2.3502         -DE/DX =    0.0                 !
 ! R3    R(1,4)                  2.3502         -DE/DX =    0.0                 !
 ! A1    A(2,1,3)              120.0            -DE/DX =    0.0                 !
 ! A2    A(2,1,4)              120.0            -DE/DX =    0.0                 !
 ! A3    A(3,1,4)              120.0            -DE/DX =    0.0                 !
 ! D1    D(2,1,4,3)            180.0            -DE/DX =    0.0                 !
 --------------------------------------------------------------------------------
 GradGradGradGradGradGradGradGradGradGradGradGradGradGradGradGradGradGrad
By comparing the bond length and angles with literature, it could be seen that the optimized bond length was longer than the theoretical value and the Br-Ga-Br bond angles were smaller than the literature. This could be caused by the ignorance of crystal packing in the computational calculation. The literature gives a bond length of the solid form of the molecule whereas the computational calculation treated the molecule in the gas form; therefore, the bond length of our optimization could be much longer.
| Basis Set | Bond length(Å) | Angle(°) |
| LANL2DZ | 2.35 | 120.0 |
| 2.35 | 120.0 | |
| 2.35 | 120.0 | |
| Average | 2.35 | 120.0 |
| Literature[2] | 2.24 | 123.1 |
Optimization Analysis of BBr3
In order to investigate a mixture of basis-sets and pseudo-potentials, BBr3 was created by Gaussview on the basis of 6-31(d,p) optimized BH3, followed by optimization using B3LYP method and Gen basis set (LANL2DZ on Br and6-31G(d,p) on B).
BBr3 out-put file: DOI:10042/26243
| Compound | File Type | Calculation Type | Calculation Method | Basis Set | Charge | Spin | Final Energy in au | Gradient | Dipole Moment | Point Group | Job cpu Time |
|---|---|---|---|---|---|---|---|---|---|---|---|
| BBr3 | .log | FOPT | RB3LYP | GEN | 0 | Singlet | -64.43645296 | 0.00000382 | 0.00 | D3H | 0 days 0 hours 0 minutes 16.4 seconds |
The optimization job was checked by the item table. Since all gradient terms were close to zero and forces were all converged, it can be concluded that the optimization job was successful.
     Item                  Value     Threshold  Converged?
 Maximum Force            0.000008     0.000450     YES
 RMS     Force            0.000005     0.000300     YES
 Maximum Displacement     0.000036     0.001800     YES
 RMS     Displacement     0.000023     0.001200     YES
 Predicted change in Energy=-4.027688D-10
 Optimization completed.
    -- Stationary point found.
                           ----------------------------
                           !   Optimized Parameters   !
                           ! (Angstroms and Degrees)  !
 --------------------------                            --------------------------
 ! Name  Definition              Value          Derivative Info.                !
 --------------------------------------------------------------------------------
 ! R1    R(1,2)                  1.934          -DE/DX =    0.0                 !
 ! R2    R(1,3)                  1.934          -DE/DX =    0.0                 !
 ! R3    R(1,4)                  1.934          -DE/DX =    0.0                 !
 ! A1    A(2,1,3)              120.0            -DE/DX =    0.0                 !
 ! A2    A(2,1,4)              120.0            -DE/DX =    0.0                 !
 ! A3    A(3,1,4)              120.0            -DE/DX =    0.0                 !
 ! D1    D(2,1,4,3)            180.0            -DE/DX =    0.0                 !
 --------------------------------------------------------------------------------
 GradGradGradGradGradGradGradGradGradGradGradGradGradGradGradGradGradGrad
Optimized Ga-Br bond length and Br-Ga-Br bond angle have summarized in the following table. By comparing to literature, both bond distance and angle were the quite close to the theoretical values; the difference could be explained by the same way as before.
| Basis Set | Bond length(Å) | Angle(°) |
| GEN | 1.93 | 120.0 |
| 1.93 | 120.0 | |
| 1.93 | 120.0 | |
| Average | 1.93 | 120.0 |
| Literature[3] | 1.89 | 120.0 |
Structure Comparison
| Molecule | BH3 | GaBr3 | BBr3 |
| Average Bond length(Å) | 1.19 | 2.35 | 1.93 |
| Avergar Angle(°) | 120.0 | 120.0 | 120.0 |
By comparing the bond length between BH3 and BBr3, it could be concluded that changing the ligand from hydride to bromide would result in a longer bond. H and Br are both one electron donor ligands and form the 2c-2e bond with boron. However, bromine is more electronegative than hydrogen; so the difference in electronegativity between Br and B is larger than the difference between H and B resulting in a more polar and longer B-Br bond. Moreover, B-Br bond is longer than B-H because bromine has larger atomic radius and more diffuse orbital than hydrogen leading to a poor orbital overlap between Br and B. Hydrogen, on the other hand has a better orbital overlap with boron due to closer electronic configuration. (H: 1s; B: 1s22s22p1; Br:[Ar]3d104s24p5))
By comparing the bond length between BBr3 and GaBr3, it could be concluded that changing the central atom from boron to gallium would result in a longer bond length. Both Br and Ga are group 13 elements and form the 2c-2e bonds. However, Ga has larger atomic radius than Br and poorer orbital overlap with boron due to mismatch of orbital size. (B: 1s22s22p1; Ga:[Ar]3d104s24p1; B: 1s22s22p1)2p-4p orbital overlap between B and Br is better than 4p-4p overlap between Ga and Br resulting in a longer Ga-Br bond. In addition, gallium is highly polarizing element, and it is less electronegative than boron and has a more polarized and longer Ga-Br bond.
In Gaussview, there was a bond distance limit which meant that the bond would be invisible if its length exceeded the limit. In the optimization analysis of BH3 using basis set of 3-21G, the bond length was changed to be longer than the limit before optimization; thus all B-H bonds were invisible. However, they still existed, and the molecule remained the same symmetry. After the optimization, the bonds became visible again when the bond length had decreased to be lower than the limit.
Bond is the electrostatic attraction between two atoms due to electron-sharing or electron-transfer.
Frequency Analysis for BH3
Frequency Analysis
In order to study the frequency of BH3, the point group of the optimized molecule was firstly restricted to be D3H followed by frequency analysis using the same procedure as optimization. The frequency result was listed below.
The out-put log file:BH3 6-21G(d,p)
| Compound | File Type | Calculation Type | Calculation Method | Basis Set | Charge | Spin | Final Energy in au | Gradient | Dipole Moment | Point Group | Job cpu Time |
|---|---|---|---|---|---|---|---|---|---|---|---|
| BH3 | .log | FREQ | RB3LYP | 6-31G(d,p) | 0 | Singlet | -26.61532363 | 0.00000291 | 0.00 | D3H | 0 days 0 hours 0 minutes 7.0 seconds |
Again, item table was used to check if the frequency job was complete. All forces were converged and gradient terms were close to zero, so the frequency was successful.
      Item                  Value     Threshold  Converged?
 Maximum Force            0.000006     0.000450     YES
 RMS     Force            0.000003     0.000300     YES
 Maximum Displacement     0.000023     0.001800     YES
 RMS     Displacement     0.000011     0.001200     YES
 Predicted change in Energy=-1.996524D-10
 Optimization completed.
    -- Stationary point found.
 GradGradGradGradGradGradGradGradGradGradGradGradGradGradGradGradGradGrad
The low frequencies were also listed below and the values had a range of ± 15 cm-1 .
Low frequencies ---   -0.9432   -0.8611   -0.0056    5.7455   11.7246   11.7625
Low frequencies --- 1162.9963 1213.1826 1213.1853
Animating The Vibrations

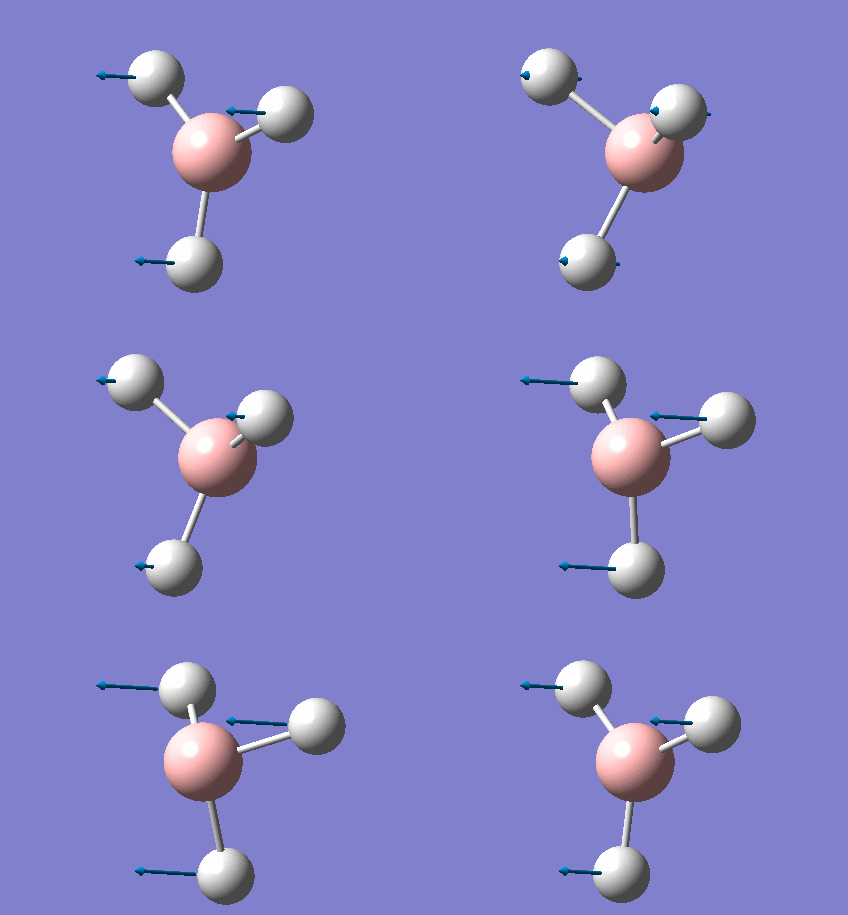
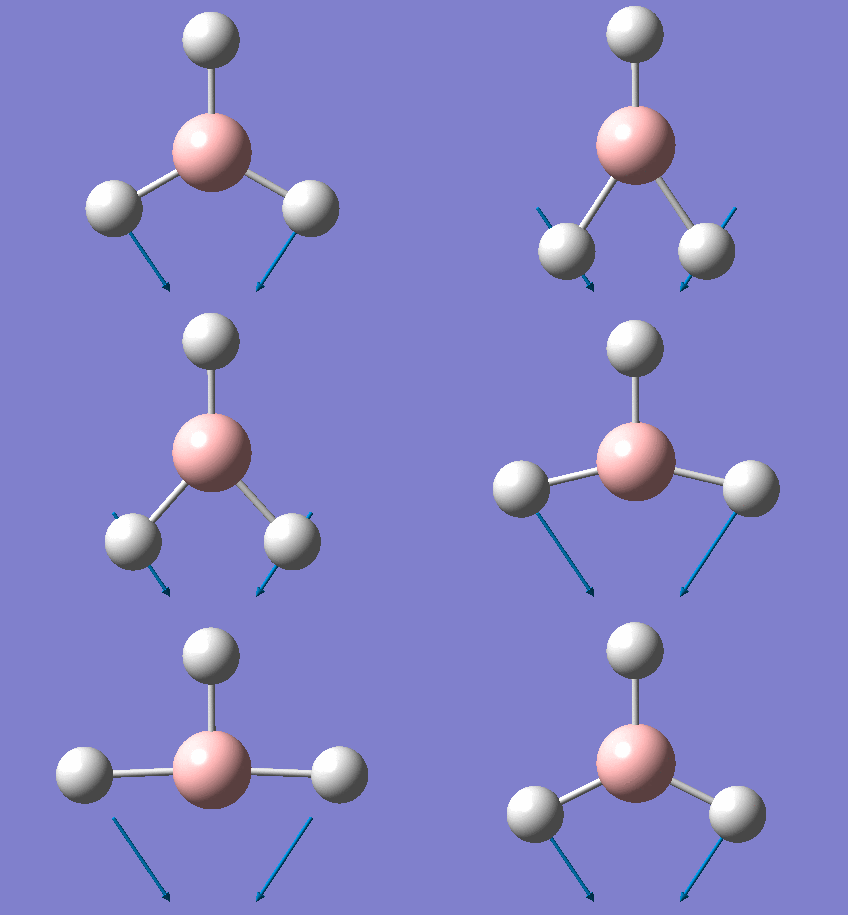
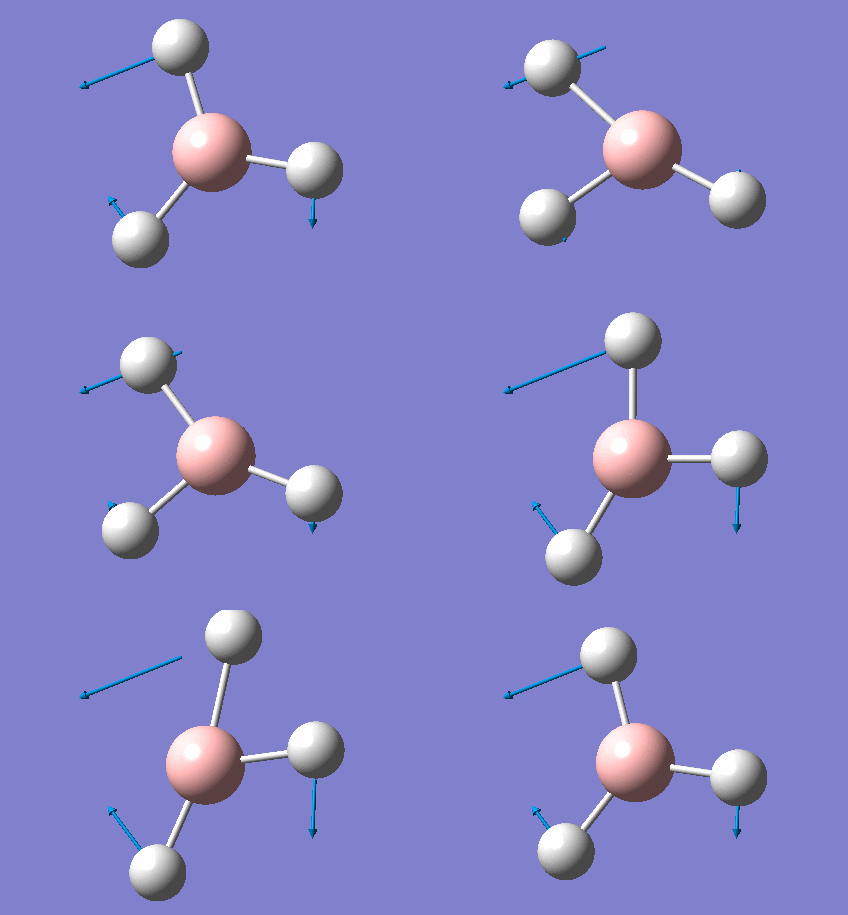
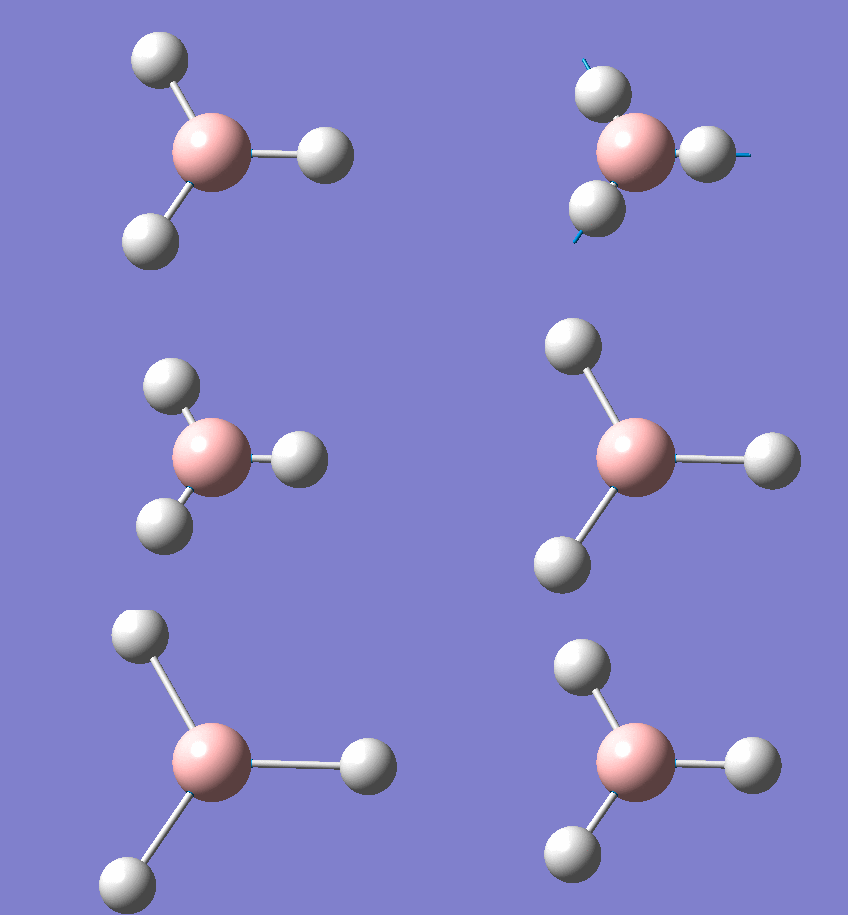
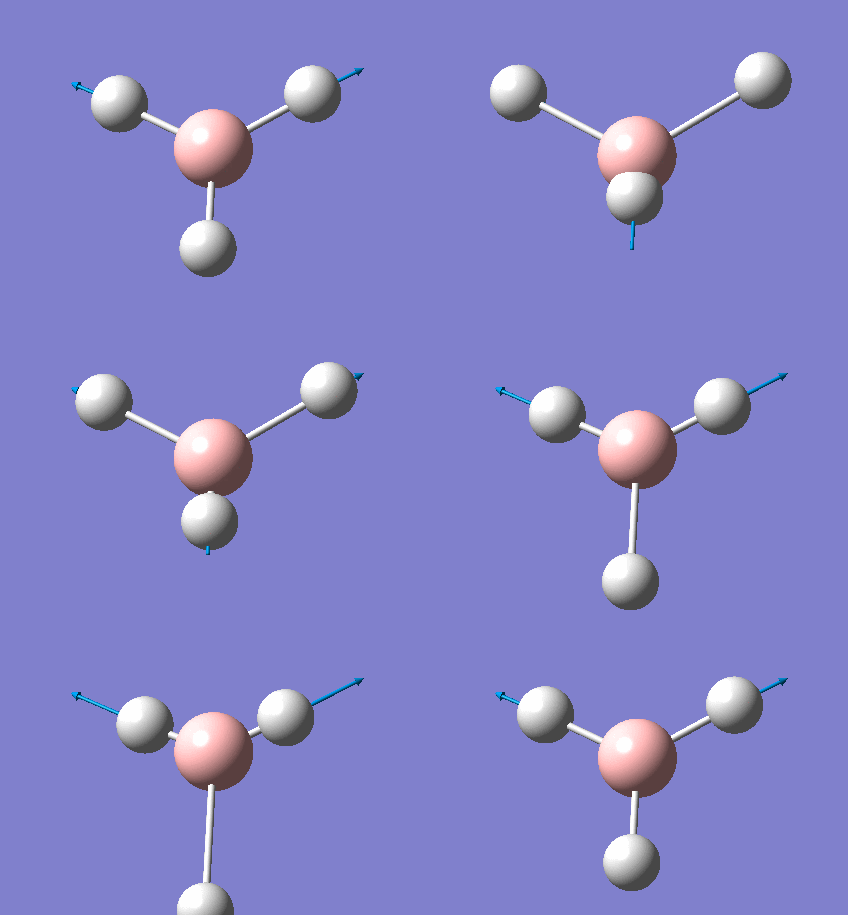
There are only three peaks shown in the IR spectrum although six different vibrations exist because vibration No.2 and 3 as well as No. 5 and 6 are degenerate and they have the same the frequencies which would only show a single peak on the spectrum. Also, No. 4 vibration has zero intensity and would not have a peak neither because the H-B-H angles are all 120° and all dipole moments are cancelled out resulting in a zero intensity on IR spectrum.
Frequency Analysis of GaBr3
To compare GaBr3 and BH3, frequency analysis of GaBr3 using the same method and basis set has been done and the results were listed below.
GaBr3 out-put file: DOI:10042/26269
| Compound | File Type | Calculation Type | Calculation Method | Basis Set | Charge | Spin | Final Energy in au | Gradient | Dipole Moment | Point Group | Job cpu Time |
|---|---|---|---|---|---|---|---|---|---|---|---|
| GaBr3 | .log | FREQ | RB3LYP | LANL2DZ | 0 | Singlet | -41.70082783 | 0.00000011 | 0.00 | D3H | 0 days 0 hours 0 minutes 11.1 seconds |
Item table was used to check the completion of frequency job.
       Item               Value     Threshold  Converged?
 Maximum Force            0.000000     0.000450     YES
 RMS     Force            0.000000     0.000300     YES
 Maximum Displacement     0.000002     0.001800     YES
 RMS     Displacement     0.000001     0.001200     YES
 Predicted change in Energy=-6.142796D-13
 Optimization completed.
    -- Stationary point found.
 GradGradGradGradGradGradGradGradGradGradGradGradGradGradGradGradGradGrad
Low frequencies result:
Low frequencies ---   -0.5252   -0.5247   -0.0024   -0.0010    0.0235    1.2011
Low frequencies ---   76.3744   76.3753   99.6982
The lowest real normal mode was 76 cm-1 .
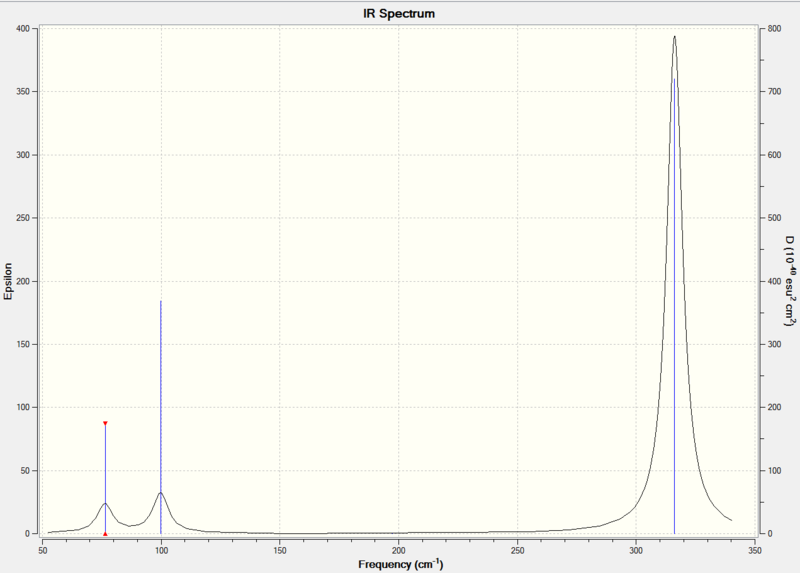
Compare and Contrast the Frequencies for BH3, and GaBr3
| No. | BH3 Frequency (cm-1) | BH3 Intensity | BH3 Symmetry D3h point group | No. | GaBr3 Frequency (cm-1) | GaBr3 Intensity | GaBr3 Symmetry D3h point group |
|---|---|---|---|---|---|---|---|
| 1 | 1163 | 93 | A2" | 1 | 76 | 3 | E' (degenerate) |
| 2 | 1213 | 14 | E' (degenerate) | 2 | 76 | 3 | E' (degenerate) |
| 3 | 1213 | 14 | E' (degenerate) | 3 | 100 | 9 | A2" |
| 4 | 2582 | 0 | A1' (totally symmetric) | 4 | 197 | 0 | A1' (totally symmetric) |
| 5 | 2715 | 126 | E' (degenerate) | 5 | 316 | 57 | E' (degenerate) |
| 6 | 2715 | 126 | E' (degenerate) | 6 | 316 | 57 | E' (degenerate) |
Both BH3 and GaBr3 have the point group of D3h, so they have similar vibraional environments; and it was expected to have 6 different vibrations for each molecule. However, there were only three peaks in each IR spectrum.
By comparing the frequencies of the two molecules, GaBr3 clearly had much lower frequencies than BH3. This could be explained first by the stronger B-H bond as frequency is proportional to the force constant. Moreover, gallium has larger atomic radius than boron; therefore, GaBr3 has a poorer orbital overlap and vibrates slower as well.
In addition, although the two molecules have the same symmetry labels, the vibration mode a"2in molecule BH3 has the lowest frequencies and e' is numbered third; however, the order of these two vibrations is switched in the mole GaBr3. This is because a"2 vibration involves one gallium atom whereas e' involves all atoms, a"2would then vibrates quicker than e' and has a higher frequency in the molecule GaBr3.
Why must you use the same method and basis set for both the optimisation and frequency analysis calculations?
The key to the optimization and frequency analysis is to make sure that the minimum energy has been reached. The total energy for both analysis is highly dependent on the level of the basis set. As before when we did the optimization for BH3 molecule using two different basis set, the total energy had about 400 kJ/mol difference. What this means is that we should never compare the energy with different basis set, it would have no significance. Therefore, we must use the same method and basis set for any calculations, then we will be able to analyze the result and compare the difference.
What is the purpose of carrying out a frequency analysis?
The purpose of carrying out a frequency analysis is to find the structure of the molecule with a minimum total energy and then to find out the vibration modes which could generate the IR spectrum.
What do the "Low frequencies" represent?
Low frequency is the vibrational motion which is the center of the molecule mass; therefore, it is lower than the real frequency. The formula of number of the vibration modes is 3N-6. N is the total number of atoms and -6 is the low frequency.
Molecular Orbitals Analysis of BH3
BH3 out-put file: DOI:10042/26258
| Compound | File Type | Calculation Type | Calculation Method | Basis Set | Charge | Spin | Final Energy in au | Gradient | Dipole Moment | Point Group | Job cpu Time |
|---|---|---|---|---|---|---|---|---|---|---|---|
| BH3 | .log | SP | RB3LYP | 6-31G(d,p) | 0 | Singlet | -26.61532363 | 0.0000 | D3H | 0 days 0 hours 0 minutes 6.5 seconds |
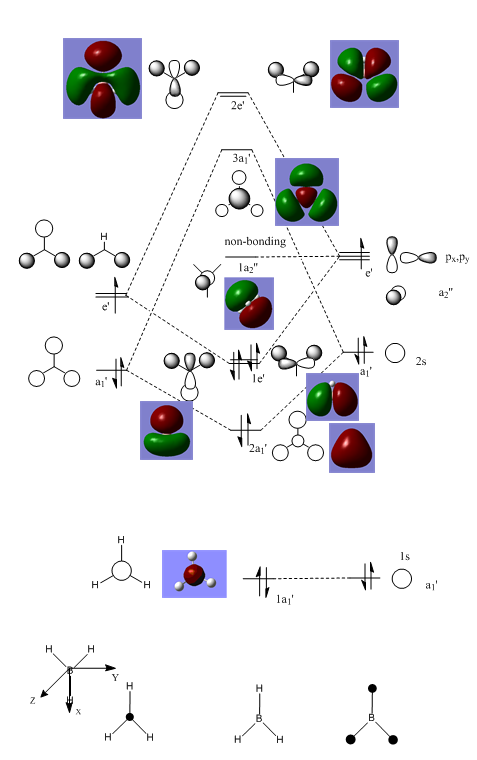
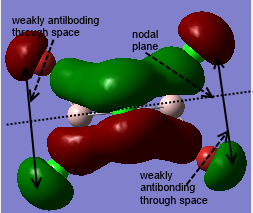
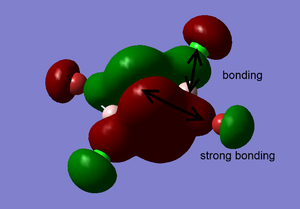
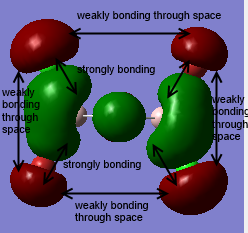
Clearly, LCAO molecular orbitals are not the same as the real MOs because in LCAO MOs, the electron density is localized on individual atoms; however, the real MOs are more diffuse and have the electron density that are delocalized on the entire molecular orbitals. Despite this, LCAO still gives accurate information about nodal planes and nodes. Therefore, we could use LCAO to predict how the orbitals are combined as well as the positions of nodal planes and use the real MOs to tell the electron density.
NBO Analysis
NH3 Optimisation out-put file:NH3 Optimisation
| Compound | File Type | Calculation Type | Calculation Method | Basis Set | Charge | Spin | Final Energy in au | Gradient | Dipole Moment | Point Group | Job cpu Time |
|---|---|---|---|---|---|---|---|---|---|---|---|
| NH3 | .log | FOPT | RB3LYP | 6-31G(d,p) | 0 | Singlet | -56.55776856 | 0.00000367 | 1.85 | CS | 0 days 0 hours 0 minutes 6.0 seconds |
      Item                 Value     Threshold  Converged?
 Maximum Force            0.000008     0.000450     YES
 RMS     Force            0.000004     0.000300     YES
 Maximum Displacement     0.000023     0.001800     YES
 RMS     Displacement     0.000018     0.001200     YES
 Predicted change in Energy=-2.074950D-10
 Optimization completed.
    -- Stationary point found.
                           ----------------------------
                           !   Optimized Parameters   !
                           ! (Angstroms and Degrees)  !
 --------------------------                            --------------------------
 ! Name  Definition              Value          Derivative Info.                !
 --------------------------------------------------------------------------------
 ! R1    R(1,2)                  1.018          -DE/DX =    0.0                 !
 ! R2    R(1,3)                  1.018          -DE/DX =    0.0                 !
 ! R3    R(1,4)                  1.018          -DE/DX =    0.0                 !
 ! A1    A(2,1,3)              105.7463         -DE/DX =    0.0                 !
 ! A2    A(2,1,4)              105.7463         -DE/DX =    0.0                 !
 ! A3    A(3,1,4)              105.7462         -DE/DX =    0.0                 !
 ! D1    D(2,1,4,3)           -111.867          -DE/DX =    0.0                 !
 --------------------------------------------------------------------------------
 GradGradGradGradGradGradGradGradGradGradGradGradGradGradGradGradGradGrad
NH3 Frequency out-put file:NH3 Frequency
| Compound | File Type | Calculation Type | Calculation Method | Basis Set | Charge | Spin | Final Energy in au | Gradient | Dipole Moment | Point Group | Job cpu Time |
|---|---|---|---|---|---|---|---|---|---|---|---|
| NH3 | .log | FREQ | RB3LYP | 6-31G(d,p) | 0 | Singlet | -56.55776863 | 0.00000281 | 1.85 | C3V | 0 days 0 hours 0 minutes 7.0 seconds |
     Item                  Value     Threshold  Converged?
 Maximum Force            0.000005     0.000450     YES
 RMS     Force            0.000003     0.000300     YES
 Maximum Displacement     0.000011     0.001800     YES
 RMS     Displacement     0.000006     0.001200     YES
 Predicted change in Energy=-8.415874D-11
 Optimization completed.
    -- Stationary point found.
 GradGradGradGradGradGradGradGradGradGradGradGradGradGradGradGradGradGrad
 Low frequencies ---  -11.6206  -11.5851   -0.0030    0.0244    0.1403   25.5610
 Low frequencies --- 1089.6630 1694.1734 1694.1737
NH3 MO Analysis out-put file:NH3 MO
| Compound | File Type | Calculation Type | Calculation Method | Basis Set | Charge | Spin | Final Energy in au | Gradient | Dipole Moment | Point Group | Job cpu Time |
|---|---|---|---|---|---|---|---|---|---|---|---|
| NH3 | .chk | SP | RB3LYP | 6-31G(d,p) | 0 | Singlet | -56.55776856 | 1.85 | C3 | 0 days 0 hours 0 minutes 5.0 seconds |
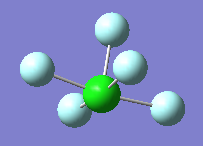
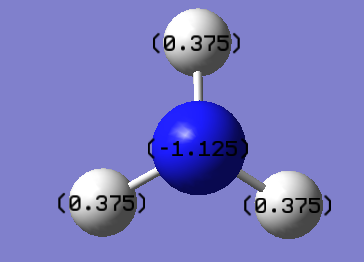
The charge range is -1.000 to +1.000 and the green color indicates the highly positive charge whereas the red color indicates the highly negative charge. Nitrogen is bright red and the specific NBO charge of nitrogen is -1.125 while hydrogen is 0.375.
Association energies: Ammonia-Borane
NH3BH3 Optimisation out-put file:NH3BH3 Optimisation
| Compound | File Type | Calculation Type | Calculation Method | Basis Set | Charge | Spin | Final Energy in au | Gradient | Dipole Moment | Point Group | Job cpu Time |
|---|---|---|---|---|---|---|---|---|---|---|---|
| NH3BH3 | .log | FOPT | RB3LYP | 6-31G(d,p) | 0 | Singlet | -83.22468999 | 0.00006054 | 5.57 | C1 | 0 days 0 hours 0 minutes 4.0 seconds |
        Item               Value     Threshold  Converged?
 Maximum Force            0.000128     0.000450     YES
 RMS     Force            0.000057     0.000300     YES
 Maximum Displacement     0.000630     0.001800     YES
 RMS     Displacement     0.000363     0.001200     YES
 Predicted change in Energy=-1.665405D-07
 Optimization completed.
    -- Stationary point found.
NH3BH3 Frequency out-put file:NH3BH3 Frequency
| Compound | File Type | Calculation Type | Calculation Method | Basis Set | Charge | Spin | Final Energy in au | Gradient | Dipole Moment | Point Group | Job cpu Time |
|---|---|---|---|---|---|---|---|---|---|---|---|
| NH3BH3 | .log | FREQ | RB3LYP | 6-31G(d,p) | 0 | Singlet | -83.22468999 | 0.00006054 | 5.57 | C1 | 0 days 0 hours 0 minutes 15.0 seconds |
        Item               Value     Threshold  Converged?
 Maximum Force            0.000119     0.000450     YES
 RMS     Force            0.000061     0.000300     YES
 Maximum Displacement     0.000777     0.001800     YES
 RMS     Displacement     0.000452     0.001200     YES
 Predicted change in Energy=-1.750924D-07
 Optimization completed.
    -- Stationary point found.
 GradGradGradGradGradGradGradGradGradGradGradGradGradGradGradGradGradGrad
Low frequencies ---   -0.0009    0.0008    0.0010   18.2527   22.7948   41.2547
 Low frequencies ---  266.2766  632.3264  639.2582
| Energy | |
| NH3BH3 | -83.22468999 |
| NH3 | -56.55776856 |
| BH3 | -26.61532363 |
| Energy Difference (au) ΔE=E(NH3BH3)-[E(NH3)+E(BH3)] | -0.0515978 |
| Energy Difference (kJ/mol) | -136 |
Combining a NH3 molecule with a BH3 molecule would have an association energy of -136 kJ/mol; this energy is also the dissociation/bond energy of the newly formed dative covalent bond. The product NH3BH3 has a more negative energy than either the reactants; therefore, the product is more stable. The covalent bond is formed by the sigma-donation from lone pair of nitrogen to the empty p orbital of borane.
Reference
- ↑ 1.0 1.1 "Physical Constants of Organic Compounds", in CRC Handbook of Chemistry and Physics, Internet Version 2005, David R. Lide, ed., <http://www.hbcpnetbase.com>, CRC Press, Boca Raton, FL, 2005.
- ↑ "Gallium tribromide: molecular geometry of monomer and dimer from gas-phase electron diffraction", Reffy, Balazs; Kolonits, Maria; Hargittai, Magdolna Journal of Molecular Structure, 1998, 445, 139–148.
- ↑ W. M. Haynes, D. R. Lide and T. J. Bruno, CRC handbook of chemistry and physics : a ready-reference book of chemical and physical data, 2012.
Week Two
Optimization
| Optimization | A | B | C | D | ||||||||||||
|
|
|
| |||||||||||||
| Dspace | DOI:10042/26314 | DOI:10042/26363 | DOI:10042/26368 | DOI:10042/26367 | ||||||||||||
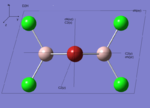
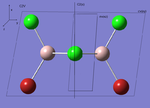
| Real Point Group | D2H | C2V | C2H | C1 | ||||||||||||
 |
 |
 |

|
| Compound | File Type | Calculation Type | Calculation Method | Basis Set | Charge | Spin | Final Energy in au | Gradient | Dipole Moment | Point Group | Job cpu Time |
|---|---|---|---|---|---|---|---|---|---|---|---|
| Isomer A | .log | FOPT | RB3LYP | Gen | 0 | Singlet | -2352.40630798 | 0.00000079 | 0.0006 | C2V | 0 days 0 hours 2 minutes 38.1 seconds |
| Isomer B | .log | FOPT | RB3LYP | Gen | 0 | Singlet | -2352.41626667 | 0.00003572 | 0.1673 | C1 | 0 days 0 hours 3 minutes 31.2 seconds |
| Isomer C | .log | FOPT | RB3LYP | Gen | 0 | Singlet | -2352.41631610 | 0.00001372 | 0.0013 | CS | 0 days 0 hours 4 minutes 21.4 seconds |
| Isomer D | .log | FOPT | RB3LYP | Gen | 0 | Singlet | -2352.41109947 | 0.00001120 | 0.1386 | C1 | 0 days 0 hours 1 minutes 23.0 seconds |
Optimisation Item Table
Isomer A
        Item               Value     Threshold  Converged?
 Maximum Force            0.000002     0.000450     YES
 RMS     Force            0.000001     0.000300     YES
 Maximum Displacement     0.000578     0.001800     YES
 RMS     Displacement     0.000255     0.001200     YES
 Predicted change in Energy=-6.076901D-10
 Optimization completed.
    -- Stationary point found.
Isomer B
     Item                   Value     Threshold  Converged?
 Maximum Force            0.000078     0.000450     YES
 RMS     Force            0.000022     0.000300     YES
 Maximum Displacement     0.000877     0.001800     YES
 RMS     Displacement     0.000223     0.001200     YES
 Predicted change in Energy=-5.660144D-08
 Optimization completed.
    -- Stationary point found.
Isomer C
         Item               Value     Threshold  Converged?
 Maximum Force            0.000022     0.000450     YES
 RMS     Force            0.000008     0.000300     YES
 Maximum Displacement     0.001107     0.001800     YES
 RMS     Displacement     0.000483     0.001200     YES
 Predicted change in Energy=-1.142041D-08
 Optimization completed.
    -- Stationary point found.
Isomer D
         Item               Value     Threshold  Converged?
 Maximum Force            0.000020     0.000450     YES
 RMS     Force            0.000011     0.000300     YES
 Maximum Displacement     0.000806     0.001800     YES
 RMS     Displacement     0.000250     0.001200     YES
 Predicted change in Energy=-1.518942D-08
 Optimization completed.
    -- Stationary point found.
Comparison of Energy
| Energy (au) | Energy (kJ/mol) | Relative Energy(kJ/mol)to the Lowest Energy Conformer | ||
| A | -2352.4063 | -6176243 | 26 | Highest Energy |
| B | -2352.4163 | -6176269 | 0.13 | |
| C | -2352.4163 | -6176269 | Lowest Energy | |
| D | -2352.4111 | -6176256 | 13 |
Discussion
Conformer B and C have quite close total energies and they are relatively lower energies than the other two. The common feature between B and C is that bromine atoms are at the terminal positions, where bromine atoms are at bridging position in conformer A and D. In addition, conformer A has the highest energy, and has two bridging bromine atoms and conformer D has the second highest energy and has only one bridging bromine; hence, the conclusion is that terminal bromine would result in a more stable conformer than bridging bromine.
Optimization of Monomer AlCl2Br
ah_test |
The out-put file is DOI:10042/26369
| Compound | File Type | Calculation Type | Calculation Method | Basis Set | Charge | Spin | Final Energy in au | Gradient | Dipole Moment | Point Group | Job cpu Time |
|---|---|---|---|---|---|---|---|---|---|---|---|
| AlCl2Br | .log | FOPT | RB3LYP | Gen | 0 | Singlet | -1176.19013679 | 0.00004196 | 0.1075 | C2V | 0 days 0 hours 0 minutes 37.9 seconds |
         Item               Value     Threshold  Converged?
 Maximum Force            0.000136     0.000450     YES
 RMS     Force            0.000073     0.000300     YES
 Maximum Displacement     0.000681     0.001800     YES
 RMS     Displacement     0.000497     0.001200     YES
 Predicted change in Energy=-7.984418D-08
 Optimization completed.
    -- Stationary point found.
| Term | Energy |
| Al2Cl4Br2 | -2352.4163 |
| AlCl2Br | -1176.1901 |
| Energy Difference (au) ΔE=E(Al2Cl4Br2)-[E(AlCl2Br)*2] | -0.03603 |
| Energy Difference (kJ/mol) | -94.5874 |
Combining two isolated monomers together would have an association energy of -95 kJ/mol which is also the dissociation energy of the product. The product (isomer C) is more stable than the isolated monomers because it has a much lower energy.
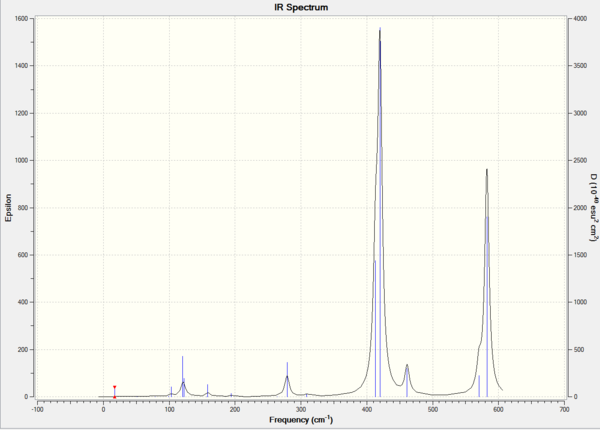
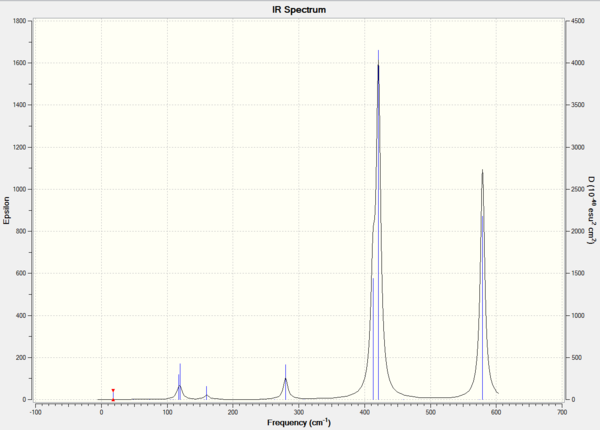
Frequency Analysis
| Frequency | A | B | C | D |
| Dspace | DOI:10042/26337 | DOI:10042/26364 | DOI:10042/26366 | DOI:10042/26365 |
| Compound | File Type | Calculation Type | Calculation Method | Basis Set | Charge | Spin | Final Energy in au | Gradient | Dipole Moment | Point Group | Job cpu Time |
|---|---|---|---|---|---|---|---|---|---|---|---|
| Isomer A | .log | FREQ | RB3LYP | Gen | 0 | Singlet | -2352.40630798 | 0.00000076 | 0.0005 | C2V | 0 days 0 hours 1 minutes 28 seconds |
| Isomer B | .log | FREQ | RB3LYP | Gen | 0 | Singlet | -2352.41626679 | 0.00001074 | 0.1672 | C2V | 0 days 0 hours 1 minutes 19.5 seconds |
| Isomer C | .log | FREQ | RB3LYP | Gen | 0 | Singlet | -2352.41631610 | 0.00001368 | 0.0013 | CS | 0 days 0 hours 2 minutes 0.2 seconds |
| Isomer D | .log | FREQ | RB3LYP | Gen | 0 | Singlet | -2352.41109946 | 0.00001128 | 0.1386 | C1 | 0 days 0 hours 2 minutes 50.8 seconds |
Isomer A
Low frequencies ---   -5.1634   -5.0501   -3.1849    0.0037    0.0039    0.0039
Low frequencies ---   14.8310   63.2729   86.0759
         Item               Value     Threshold  Converged?
 Maximum Force            0.000002     0.000450     YES
 RMS     Force            0.000001     0.000300     YES
 Maximum Displacement     0.000686     0.001800     YES
 RMS     Displacement     0.000361     0.001200     YES
 Predicted change in Energy=-6.383446D-10
 Optimization completed.
    -- Stationary point found.
 GradGradGradGradGradGradGradGradGradGradGradGradGradGradGradGradGradGrad
Isomer B
Low frequencies ---   -4.3668   -2.6848   -0.0044   -0.0037   -0.0032    0.8441
Low frequencies ---   17.1260   50.9136   78.5359
         Item               Value     Threshold  Converged?
 Maximum Force            0.000020     0.000450     YES
 RMS     Force            0.000011     0.000300     YES
 Maximum Displacement     0.001003     0.001800     YES
 RMS     Displacement     0.000378     0.001200     YES
 Predicted change in Energy=-2.220935D-08
 Optimization completed.
    -- Stationary point found.
 GradGradGradGradGradGradGradGradGradGradGradGradGradGradGradGradGradGrad
Isomer C
Low frequencies ---    0.0011    0.0023    0.0034    1.8920    1.9704    3.9624
Low frequencies ---   18.0988   49.0858   72.9223
         Item               Value     Threshold  Converged?
 Maximum Force            0.000040     0.000450     YES
 RMS     Force            0.000014     0.000300     YES
 Maximum Displacement     0.001356     0.001800     YES
 RMS     Displacement     0.000593     0.001200     YES
 Predicted change in Energy=-1.805358D-08
 Optimization completed.
    -- Stationary point found.
 GradGradGradGradGradGradGradGradGradGradGradGradGradGradGradGradGradGrad
Isomer D
Low frequencies ---   -2.2705   -0.0027    0.0017    0.0028    1.2791    3.3179
Low frequencies ---   17.1478   55.9562   80.0556
         Item               Value     Threshold  Converged?
 Maximum Force            0.000034     0.000450     YES
 RMS     Force            0.000011     0.000300     YES
 Maximum Displacement     0.000897     0.001800     YES
 RMS     Displacement     0.000373     0.001200     YES
 Predicted change in Energy=-2.934869D-08
 Optimization completed.
    -- Stationary point found.
 GradGradGradGradGradGradGradGradGradGradGradGradGradGradGradGradGradGrad
IR Spectrum

Molecular Orbital Analysis
The out-put log file:DOI:10042/26462
| Compound | File Type | Calculation Type | Calculation Method | Basis Set | Charge | Spin | Final Energy in au | Gradient | Dipole Moment | Point Group | Job cpu Time |
|---|---|---|---|---|---|---|---|---|---|---|---|
| Isomer C | .chk | SP | RB3LYP | Gen | 0 | Singlet | -2352.41631610 | 0.0013 | CS | 0 days 0 hours 0 minutes 18.4 seconds |
Further Study
The out-put file: DOI:10042/26465
Pentahelicene |
| Calculation Type | FOPT |
|---|---|
| Calculation Method | RB3LYP |
| Basis Set | Gen |
| Charge | 0 |
| Spin | Singlet |
| Final Energy in Atomic Units / ±0.003808780 a.u. | -2352.41632893 |
| Gradient / a.u. | 0.00000939 |
| Imaginary Frequency | |
| Dipole Moment | 0.19 |
| Point Group | CS |
| Job cpu Time | 0 days 0 hours 3 minutes 7.6 seconds |
        Item               Value     Threshold  Converged?
 Maximum Force            0.000021     0.000450     YES
 RMS     Force            0.000009     0.000300     YES
 Maximum Displacement     0.000285     0.001800     YES
 RMS     Displacement     0.000115     0.001200     YES
 Predicted change in Energy=-7.918666D-09
 Optimization completed.
    -- Stationary point found.

