Rep:Mod:altura
Sam's Computational Chemistry Wiki Page Week 1
First Optimisation
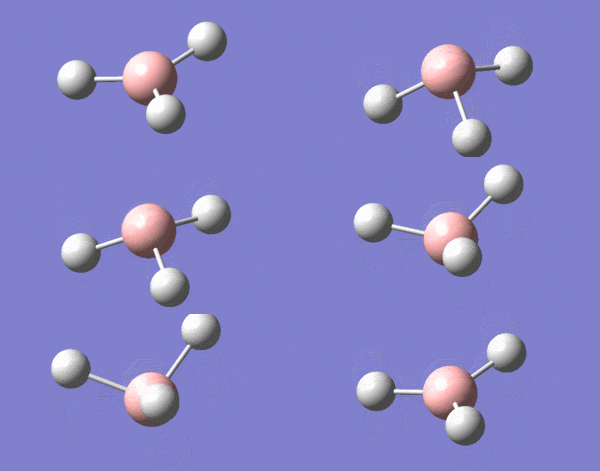
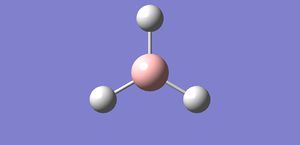
The beginning of this project starts with the optimisation of a borane molecule, see image right. A conventional molecule of BH3 was created and the bond lengths increased to 1.5 angstroms. An optimisation calculation was then performed using Gaussian to identify the optimum bond lengths and angles for the BH3 molecule along with other information regarding the nature of the molecule.
Information Regarding BH3 optimisation
| File Type | .log |
| Calculation Type | FOPT |
| Calculation Method | RB3LYP |
| Basis Set | 3-21g |
| Final Energy | -26.46226338 a.u. |
| Gradient | 0.00020672 a.u. |
| Dipole moment | 0.00 |
| Point Group | D3h |
| Calculation Time | 00:00:17:0 |
Time format hh:mm:ss:
Link to .log file for BH3 optimisation
The following extract from the log file shows successful convergence of the optimisation
        Item               Value     Threshold  Converged?
Maximum Force            0.000413     0.000450     YES
RMS     Force            0.000271     0.000300     YES
Maximum Displacement     0.001610     0.001800     YES
RMS     Displacement     0.001054     0.001200     YES
"Bonds" in gausview are a structural convenience. What definition would you choose for the existence of a bond?
By solving the Schrodinger equation for the system we have we can determine its energy. If the atoms in the system have a lower energy than the same number of free atoms that have no interactions with each other, then there must be some bonding that is present. As bonding occurs to lower the total energy of atoms/molecules.
The optimisation is calculated for the desired molecule in the gas phase. The results obtained for this optimisation might differ for a molecule in a solid phase due to packing forces distorting the molecule.
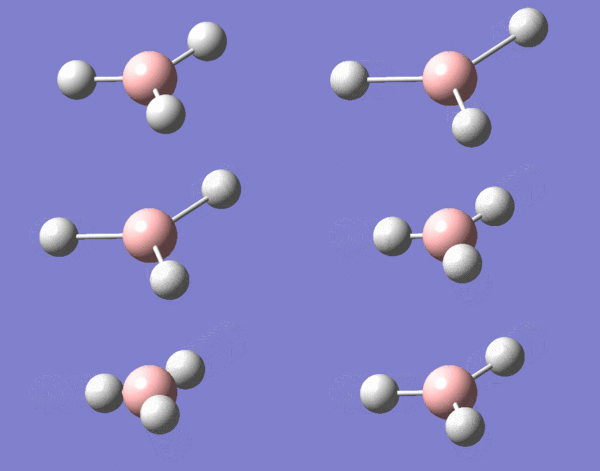
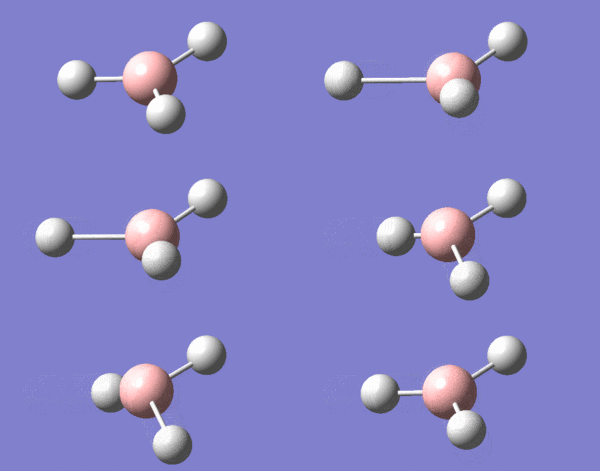
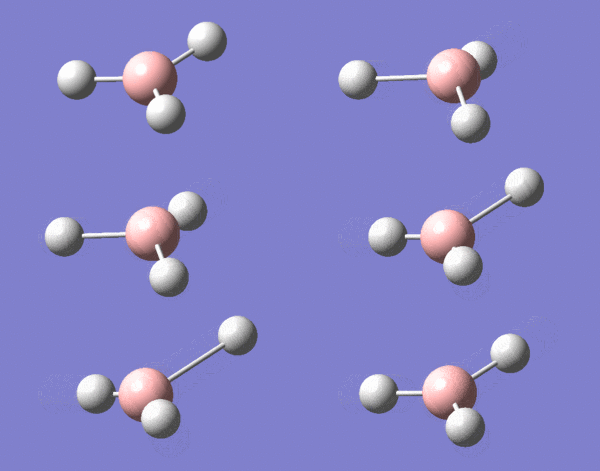
Below are two images showing the how the bond length is altered to find an energy minima.


Optimisation with improved basis set
The accuracy of the results obtained from the calculations run in gaussian is highly dependent on the choice of basis set of orbitals. A higher level basis set will entail longer equations that better describe the orbitals in question but will ultimately lead to longer calculation times. However with simple molecules such as BH3 the calculation time is increased by a matter of seconds and not hours or days.
The energy determined from the 6-31G optimisation was slightly lower than expected by a significant amount. The energy reported was 26.61641998 a.u., compared with the reported -26.61532363 a.u. It was noticed that the optimisation had not been performed using the 3-21G optimised structure. Instead it had been performed using a structure selected from the optimisation plot that was slightly higher in energy. Repeating the optimisation using the correct structure from the first optimisation an energy value of -26.61532363 a.u., the same as the expected value. The results summary for the first erroneous 6-31G basis set optimisation have not be included.
| File Type | .log |
| Calculation Type | FOPT |
| Calculation Method | RB3LYP |
| Basis Set | 6-31G d,p |
| Energy | -26.61532181v a.u. |
| Gradient | 0.00027724 a.u. |
| Dipole Moment | 0.00 |
| Point Group | C3h |
| Calculation Time | 00:00:09:0 |
Time format hh:mm:ss:
Below is a link to the .log file for the 6-31G d,p optimisation of BH3
File:Corrected 6-31G optimisation.log
It was noticed that a change in point group had occurred in this second optimisation, this would have been because symmetry was not restricted to the D3h point group, but it is not critical to have the true symmetry at this stage.
Enhanced Basis Sets
Analysis of TlBr3
This stage in the project involved studying a molecule of TlBr3, which in ways is comparible to borane. Thallium is in the same group as boron and in this molecule its valency is the same. Although the existance of this molecule is questionable, as is the existance of BH3, due to the inert pair effect and lower oxidation states becoming preferred by lower group elements. In order perform accurate calculations for these heavier atoms pseudo potentials must be used to account for the large number of core electrons present. The complexity of these calculations demanded the use High Performance Computing(HPC) in order to run them successfully and quickly.
A larger basis set optimisation was performed for a molecule of TlBl3 using (HPC) with the LanL2DZ basis set that includes a pseudopotential(Los Alamos ECP) to account for the core electrons(non-valence) in these heavy atoms. Before running the calculation it was specified in the input file that TlBr3 was restricted to D3h symmetry and the tolerances were set to 'very tight'. Below is the ouput log file from the optimisation and results summary.
Link to D-space published file DOI:10042/22473

| File Type | .log |
| Calculation Type | FOPT |
| Calculation Method | RCCSD-FC |
| Basis Set | LANL2DZ |
| Total Energy | -89.23013903 a.u. |
| RMS Gradient | 0.00653397 a.u. |
| Dipole Moment | 0.000 Debye |
| Point Group | D3h |
| Calculation Time | 0:04:33:1 |
The following table shows the successful convergence of the optimisation of TlBr3
       Item               Value     Threshold  Converged?
Maximum Force            0.000015     0.000450     YES
RMS     Force            0.000010     0.000300     YES
Maximum Displacement     0.000154     0.001800     YES
RMS     Displacement     0.000101     0.001200     YES
Predicted change in Energy=-3.591615D-09
The optimised bond length determined by the calculation was 2.601 angstroms and an optimised bond angle of 120 degrees. Comparing this with the reported 2.618 for the gas phase[1].
Analysis of BBr3
Following on from the TlBr3 optimisation, a second optimisation of a different molecule, BBr3, was performed using the HPC. A difference between this optimisation and the previous was that the GEN basis set was used. This allowed for the basis sets of the individual atoms to be specified which was necessary as the bromine atoms, being a heavy element, required a pseudo potential which boron did not. The boron atom was given a B-31G d,p basis set and the bromine atoms were given LanL2DZ basis sets. Below is a table summarising the results of the optimisation and a second table showing the successful convergence of the calculation.
| File Type | .log |
| Calculation Type | FOPT |
| Calculation Method | RB3LYP |
| Basis Set | Gen |
| Energy | -64.42903742 |
| Gradient | 0.01418126 |
| Dipole Moment | 0.00 Debye |
| Point Group | D3h |
| Calculation Time | 00:00:28:0 |
Time format hh:mm:ss:
        Item               Value     Threshold  Converged?
Maximum Force            0.000008     0.000450     YES
RMS     Force            0.000005     0.000300     YES
Maximum Displacement     0.000036     0.001800     YES
RMS     Displacement     0.000023     0.001200     YES
Link to BBr3 file published on D-space DOI:10042/22852
Comparison of Bond Lengths from Optimised Geometries
The bond lengths of the optimised structures for the three compounds that have been investigated so far have been tabulated, see table right.
| Bond | Bond Length/ angstroms |
|---|---|
| B-H | 1.193 |
| B-Br | 1.934 |
| Tl-Br | 2.601 |
It can be noticed that there is an increase in bond length of 0.741 angstroms when changing the ligands from hydrogen to bromine. This would likely be due bromine's valence electrons being located in very diffuse orbitals and they considerably different in energy. As such would there woukld be poor overlap with the orbitals of boron as they are 2 periods apart in the periodic table. In contrast, hydrogen has considerably smaller orbitals that are much closer in size and energy to boron and so overlap is much greater and as a result the bond is shorter and most likely stronger than the B-Br bond. Bromine and hydrogen, despite being significantly different in size and mass, share the same common valency of 1, whilst bromine can adopt higher valencies it is typically observed forming only a single bond.
Changing the central atom from boron to thallium also had a significant impact on the bond length, increasing by 0.667 angstroms. This is likely for the same reason that changing from a small ligand to a larger ligand increased the bond length, poorer orbital overlap. Thallium is 4 periods below boron in the periodic table so it would be expected to have similar chemistry, although the inert pair would likely give rise to some differences. Its significantly larger size and electron count means that its valence electrons are in very diffuse orbitals. Coupled with the large valence orbitals of bromine gives an even poor orbital overlap than observed in BBr3. This gives rise to a much longer bond which is evident from the optimised structure.
Frequency Analysis
BH3
In this part of the project, the previously generated optimised structure of BH3 will be reused by performing a frequency analysis to determine its molecular vibrations.
Low frequencies --- -0.9033 -0.7343 -0.0054 6.7375 12.2491 12.2824
Low frequencies --- 1163.0003 1213.1853 1213.1880
Harmonic frequencies (cm**-1), IR intensities (KM/Mole), Raman scattering
activities (A**4/AMU), depolarization ratios for plane and unpolarized
incident light, reduced masses (AMU), force constants (mDyne/A),
and normal coordinates:
                    1                      2                      3
                   A2"                    E'                     E'
Frequencies --  1163.0003              1213.1853              1213.1880
Red. masses --     1.2531                 1.1072                 1.1072
Frc consts  --     0.9986                 0.9601                 0.9601
IR Inten    --    92.5478                14.0553                14.0589
 Atom  AN      X      Y      Z        X      Y      Z        X      Y      Z
    1   5     0.00   0.00   0.16     0.00   0.10   0.00    -0.10   0.00   0.00
    2   1     0.00   0.00  -0.57     0.00   0.08   0.00     0.81   0.00   0.00
    3   1     0.00   0.00  -0.57    -0.39  -0.59   0.00     0.14   0.39   0.00
    4   1     0.00   0.00  -0.57     0.39  -0.59   0.00     0.14  -0.39   0.00
        Item               Value     Threshold  Converged?
Maximum Force            0.000005     0.000450     YES
RMS     Force            0.000002     0.000300     YES
Maximum Displacement     0.000019     0.001800     YES
RMS     Displacement     0.000009     0.001200     YES
| File Type | .chk |
| Calculation Type | FREQ |
| Calculation Method | RB3LYP |
| Basis Set | RB3LYP |
| Total Energy | -26.1532363 a.u. |
| RMS Gradient | 0.00000237 a.u. |
| Dipole Moment | 0.0000 D |
| Point Group | D3h |
| Calculation Time | 0:00:10 |
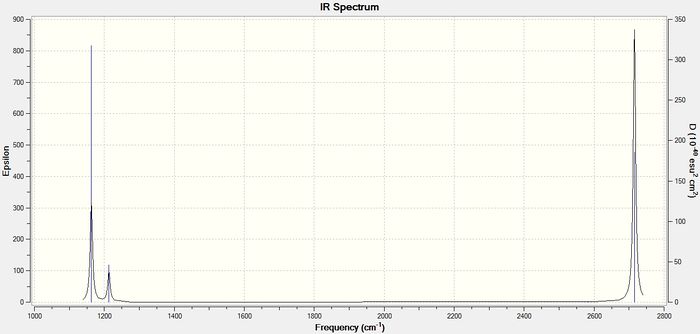
Below is the predicted vibrational spectrum for the optimised BH3 molecule.
TlBr3
After completing the BH3 frequency analysis, a frequency analysis was performed for the optimised TlBr3 structure for comparison.
Link to File for TlBr3 frequency analysis published on the D-space DOI:10042/22892
| File Type | .log |
| Calculation Type | FREQ |
| Calculation Method | RCCSD-FC |
| Basis Set | LANL2DZ |
| Energy | -89.23366292 a.u. |
| Gradient | 0.00000735 a.u. |
| Dipole Moment | 0.00 Debye |
| Point Group | D3h |
| Calculation Time | 00:50:59:8 |
Table showing successful convergence
        Item               Value     Threshold  Converged?
Maximum Force            0.000015     0.000450     YES
RMS     Force            0.000007     0.000300     YES
Maximum Displacement     0.000153     0.001800     YES
RMS     Displacement     0.000076     0.001200     YES
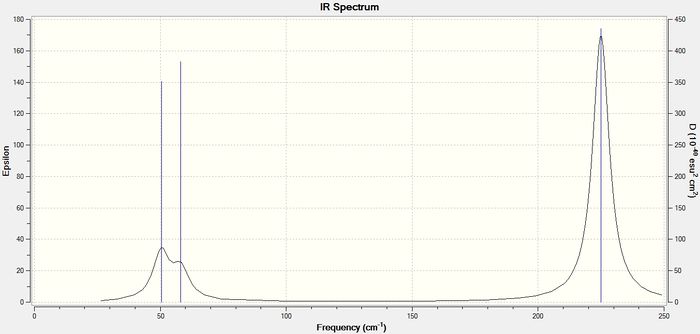
Below is the predicted Vibrational spectrum for TlBr<su8b>3
As can be seen, the vibrations of significant intensity for both molecules have some key differences. The peaks in the TlBr3 spectrum are of significantly lower intensity and occur at lower frequencies than the equivalent vibrations for BH3. Also the peaks in the TlBr3 spectrum are noticeably broader.
| BH3 | TlBr3 | ||
|---|---|---|---|
| Frequency/cm-1 | Intensity | Frequency/cm-1 | Intensity |
| 1163.00 | 92.55 | 50.39 | 4.44 |
| 1213.19 | 14.06 | 50.39 | 4.44 |
| 1213.19 | 14.06 | 58.18 | 5.5815 |
| 2582.26 | 0.00 | 179.41 | 0.00 |
| 2715.43 | 126.33 | 224.96 | 24.53 |
| 2715.43 | 126.32 | 224.96 | 24.53 |
Population Analysis
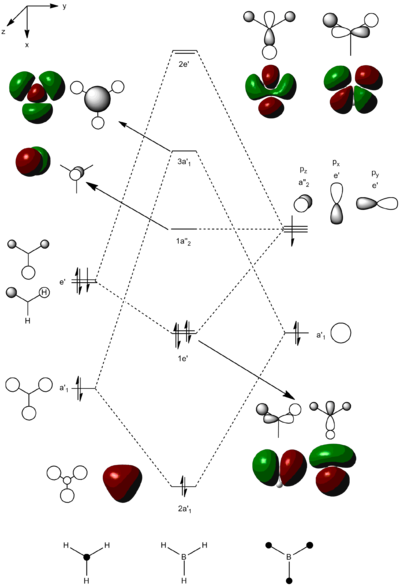
After confirming that an energy minima had been reached, a population analysis of BH3 was run with the aim of computing the molecular orbitals of BH3. Below is the .log file from the population analysis
A molecular orbital diagram was constructed for BH3 and images of the computed molecular orbitals were put alongside the corresponding orbitals created by LCAO.
NH3 Analysis
.log file for optimised NH3
.log file for frequency analysis of NH3
.log file for NH3 population analysis
File:NH3 pop analysis 631G.log
Optimised NH3 molecule |
Successful Convergence for NH3 optimisation
        Item               Value     Threshold  Converged?
Maximum Force            0.000024     0.000450     YES
RMS     Force            0.000012     0.000300     YES
Maximum Displacement     0.000079     0.001800     YES
RMS     Displacement     0.000053     0.001200     YES
| File Type | .log |
| Calculation | FOPT |
| Calculation Method | RB3LYP |
| Basis Set | 6-31G(d,p) |
| Energy | - 56.55776856 a.u. |
| Gradient | 0.00000885 a.u. |
| Dipole Moment | 1.846 Debye |
| Point Group | C1 |
After reading through the log file for the NH3 frequency analysis it was noted that the low frequencies varied from -30.70 to 28.30 cm-1 which is considered outside of acceptable limits. The frequency analysis was then repeated with the keyword "int=grid=ultrafine" to and C3v restricted symmetry.
Low frequencies ---  -10.7082   -8.7207   -7.6506   -0.0017   -0.0014   -0.0006
Low frequencies --- 1089.2623 1693.9134 1693.9171
Harmonic frequencies (cm**-1), IR intensities (KM/Mole), Raman scattering
activities (A**4/AMU), depolarization ratios for plane and unpolarized
incident light, reduced masses (AMU), force constants (mDyne/A),
and normal coordinates:
Item Value Threshold Converged?
Maximum Force            0.000007     0.000450     YES
RMS     Force            0.000003     0.000300     YES
Maximum Displacement     0.000033     0.001800     YES
RMS     Displacement     0.000012     0.001200     YES
Association Energies
A molecule of NH3BH3 was contrsucted in Gaussview from an ethyl fragment, an additional valence had to be added to both the nitrogen and boron atoms as this was somewhat of an unconventional molecule, with the objective of determining the energy of the dative bond formed between the nitrogen and boron atoms. The molecule was optimised using a 6-31G(d,p) basis set at B3LYP level [the keyword nosymm was used] as it was found through earlier runs that when this keyword wasn't included for the optimisation, the low frequencies determined in the subsequent frequency analysis would be outside of acceptable limits at -28.48.
After performing the optimisation, a frequency analysis was performed to determine whether an energy minima had been found. The symmetry of the molecule was set to very tight and the keyword "int=grid=ultrafine" was used. The most outlying low frequency was -19.79
Optimisation Convergence
    Item               Value     Threshold  Converged?
Maximum Force            0.000165     0.000450     YES
RMS     Force            0.000035     0.000300     YES
Maximum Displacement     0.000912     0.001800     YES
RMS     Displacement     0.000385     0.001200     YES
Predicted change in Energy=-1.139026D-07
Optimization completed.
| File Type | .log |
| Calculation Type | FOPT |
| Calculation Method | RB3LYP |
| Basis Set | 6-31G(d,p) |
| Energy | -83.22468957 a.u. |
| Gradient | 0.00005572 a.u. |
| Dipole Moment | 5.56 Debye |
| Point Group | C1 |
| Calculation Time | 00:01:08 |
| File Type | .log |
| Calculation Type | FREQ |
| Calculation Method | RB3LYP |
| Basis Set | 6-31G(d,p) |
| Energy | -83.22468891 a.u. |
| Gradient | 0.00005350 a.u. |
| Dipole Moment | 5.5629 Debye |
| Point Group | C1 |
| Calculation Time | 00:01:59 |
Frequency Analysis Convergence
        Item               Value     Threshold  Converged?
Maximum Force            0.000195     0.000450     YES
RMS     Force            0.000054     0.000300     YES
Maximum Displacement     0.001003     0.001800     YES
RMS     Displacement     0.000418     0.001200     YES
Predicted change in Energy=-1.446886D-07
Optimization completed.
Low Frequencies from frequency analysis.
Low frequencies ---  -19.7874   -0.0003    0.0007    0.0009    8.3509    8.9871
Low frequencies ---  262.3874  631.2874  637.7886
| File Type | .log |
| Calculation Type | FREQ |
| Calculation Method | RB3LYP |
| Basis Set | 6-31G d,p |
| Energy | -56.55776872 a.u. |
| Gradient | 0.00000262 a.u. |
| Dipole Moement | 1.84 Debye |
| Point Group | C3v |
| Calculation Time | 00:00:22:0 |
Optimisation of NH3
.log file for optimisation of NH3 File:SAMBROOKES NH3BH3 OPT.LOG
        Item               Value     Threshold  Converged?
Maximum Force            0.000166     0.000450     YES
RMS     Force            0.000035     0.000300     YES
Maximum Displacement     0.000908     0.001800     YES
RMS     Displacement     0.000321     0.001200     YES
Predicted change in Energy=-1.131674D-07
Optimization completed.
   -- Stationary point found.
| File Type | .log |
| Calculation Type | FOPT |
| Calculation Method | RB3LYP |
| Basis Set | 6-31G d,p |
| Energy | -83.21699260 a.u. |
| Gradient | 0.00977410 a.u. |
| Dipole Moment | 5.75 Debye |
| Point Group | C3 |
| Calculation Time | 00:00:40:0 |
.log file for NH3BH3 frequency analysis File:SAMBROOKES NH3BH3 FREQ 4THREPEAT.LOG
Item Value Threshold Converged?
Maximum Force            0.000195     0.000450     YES
RMS     Force            0.000054     0.000300     YES
Maximum Displacement     0.001003     0.001800     YES
RMS     Displacement     0.000418     0.001200     YES
Predicted change in Energy=-1.446886D-07
Optimization completed.
   -- Stationary point found.
Low frequencies ---  -19.7874   -0.0003    0.0007    0.0009    8.3509    8.9871
Low frequencies ---  262.3874  631.2874  637.7886
Harmonic frequencies (cm**-1), IR intensities (KM/Mole), Raman scattering
activities (A**4/AMU), depolarization ratios for plane and unpolarized
incident light, reduced masses (AMU), force constants (mDyne/A),
and normal coordinates:
                    1                      2                      3
                    A                      A                      A
Frequencies --   262.3873               631.2874               637.7886
Red. masses --     1.0078                 5.0083                 1.0452
Frc consts  --     0.0409                 1.1760                 0.2505
IR Inten    --     0.0000                14.1381                 3.5619
| File Type | .log |
| Calculation Type | FREQ |
| Basis Set | 6-31G d,p |
| Energy | -83.22468891 a.u. |
| Gradient | 0.00005350 a.u. |
| Dipole Moment | 5.56 Debye |
| Point Group | C3 |
| Calculation Time | 00:01:59 |
Association Energy Value
Using the energies calculated from the optimisation of BH3 and values from the optimisations performed previously for NH3 and NH3BH3 the association energy for the formation of the nitrogen-boron bond was determined. All of the energies used were calculated using the 6-31G d,p basis set and the B3LYP method as the choice of basis set will influence the energies calculated for a particular therefore having a direct influence on subsequent calculations that use these results.
Association Energy = E(NH3BH3) - (E(NH3) + E(BH3)) = -83.22468957 - ( -56.55776856 + -26.61641998) = - 0.05050103 a.u.
1 a.u. = 4.35974394 x 10⁻¹⁸ J, therefore the association energy is equal to -132.59 kJ mol-1.
References
1. W.M. Hayens (ed). 'CRC Handbook of Chemistry and Physics'. 93rd Ed. Boca Raton. CRC Press. 2013

