Rep:Mod:alexferre
Alexandre Van Bronkhorst Ferreira's 2nd Year Molecular Modelling Wiki Page
Day 1
Borane
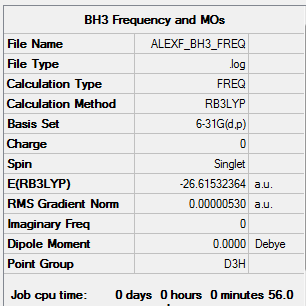
Calculation Method: B3LYP
Basis Set: 6-31G(d,p)
Summary Table:
Item Table:
Item               Value     Threshold  Converged?
 Maximum Force            0.000011     0.000450     YES
 RMS     Force            0.000005     0.000300     YES
 Maximum Displacement     0.000042     0.001800     YES
 RMS     Displacement     0.000021     0.001200     YES
Log File:
Frequency Table:
 Low frequencies ---  -14.5183  -14.5142  -10.8197   -0.0006    0.0168    0.3454
 Low frequencies --- 1162.9508 1213.1230 1213.1232
3D Image:
BH3 |
Vibration Data:
| Vibration | Intensity | Symmetry | Type |
|---|---|---|---|
| 1163 | Strong | Asymmetric | Bending |
| 1213 | Weak | Asymmetric | Bending |
| 1213 | Weak | Asymmetric | Bending |
| 2583 | Not Visible | Symmetric | Stretch |
| 2716 | Strong, Broad | Asymmetric | Stretch |
| 2716 | Strong, Broad | Asymmetric | Stretch |
Ng611 (talk) 14:59, 31 May 2018 (BST) You should also add the symmetry labels and the calculated intensity values to this table.
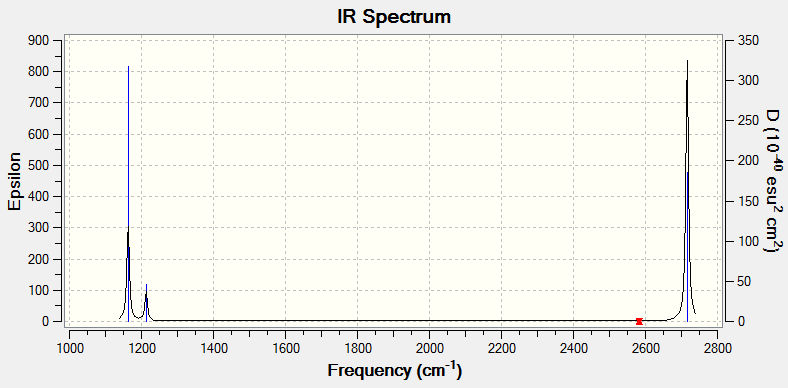
All vibrations are IR active with the exception of the vibration at 2583 cm^-1. This is a symmetric stretch and thus does not result in a change in dipole moment, making it IR inactive.
Computed IR Spectrum:
The IR spectrum shown above only has 3 visible peaks, despite BH3 having 6 different vibrational modes. the reason for this is that 2 of the vibrational modes (those at 1213 cm^-1 and 2716 cm^-1) are degenerate and thus appear as one peak on the spectrum, and additionally, one of the vibrational modes is not IR active, as explained above. This leaves 3 visible peaks on the IR spectrum.
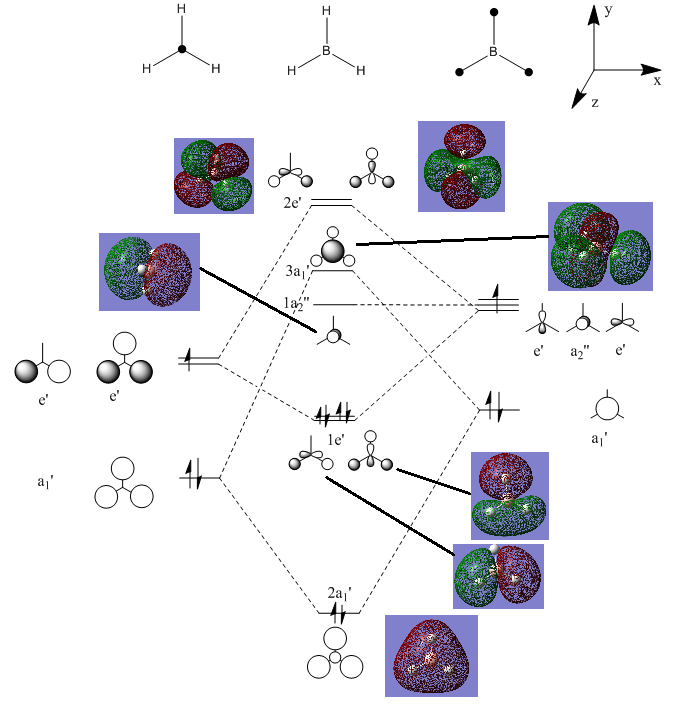
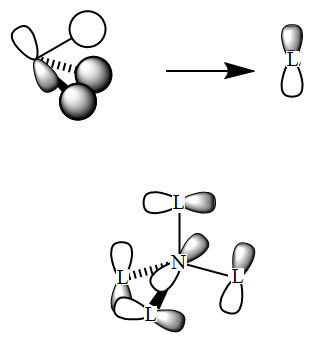
MO Diagram of BH3:
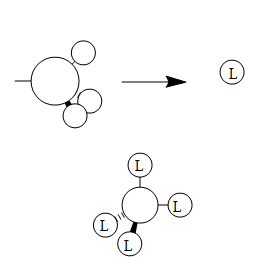
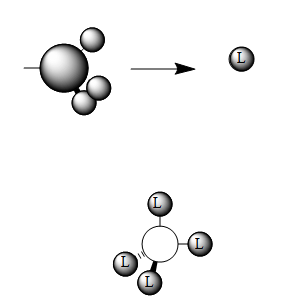
The MOs computed by the LCAO method clearly resemble the MOs computed by Gaussian, indicating the LCAO theory is an accurate method of predicting MO geometry.
New Molecule
Calculation Method: Basis Set:
Summary Table
Item Table:
Log File:
Frequency Table:
3D Image:
Ammonia
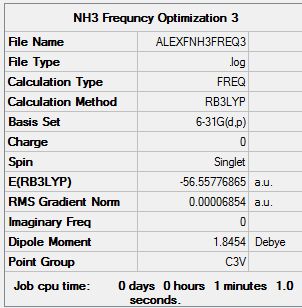
Calculation Method: B3LYP Basis Set: 6-31G(d,p)
Summary Table:
Item Table:
     Item               Value     Threshold  Converged?
 Maximum Force            0.000132     0.000450     YES
 RMS     Force            0.000069     0.000300     YES
 Maximum Displacement     0.000467     0.001800     YES
 RMS     Displacement     0.000264     0.001200     YES
 Predicted change in Energy=-7.939154D-08
 Optimization completed.
    -- Stationary point found.
Log File:
Frequency Table:
Low frequencies ---   -0.0022    0.0010    0.0022   40.8897   40.8897   43.8905
 Low frequencies --- 1089.0172 1694.0543 1694.0543
3D Image:
NH3 |
E=-56.55777 a.u.
Ammonia Borane
Calculation Method: B3LYP Basis Set: 6-31G(d,p)
Summary Table:
Item Table:
Item               Value     Threshold  Converged?
 Maximum Force            0.000349     0.000450     YES
 RMS     Force            0.000111     0.000300     YES
 Maximum Displacement     0.001345     0.001800     YES
 RMS     Displacement     0.000449     0.001200     YES
 Predicted change in Energy=-5.208288D-07
 Optimization completed.
    -- Stationary point found.
Log File:
Frequency Table:
Low frequencies ---   -0.0273   -0.0066   -0.0053   10.0706   10.1187   37.8782
 Low frequencies ---  265.3000  634.4256  639.2063
3D Image:
NH3BH3 |
E= -83.22469 a.u.
Ammonia Borane Energy Calculation
Energy of borane= -26.61532 a.u. = -69880 kJ/mol
Energy of ammonia= -56.55777 a.u. = -148490 kJ/mol
Energy of ammonia borane= -83.22469 a.u.= -218510 kJ/mol
According to equation: ΔE=E(NH3BH3)-[E(NH3)+E(BH3)]
ΔE= -0.05160 a.u.= -140 kJ/mol
This bond is fairly weak relative to typical covalent bonds. for instance, the N-H bonds found in the same molecule have a bond enthalpy of 391 kJ/mol.
Ng611 (talk) 15:03, 31 May 2018 (BST) Good final answer in a.u, but you've either converted to kJ/mol incorrectly or else have rounded to too low a degree of accuracy (nearest 10 kJ/mol when it should be to the nearest kJ/mol). Also, remember to cite your bond enthalpy values from a paper source ideally.
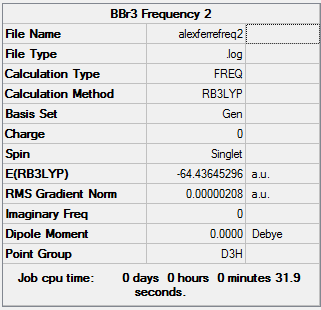
BBr3
Calculation Method: B3LYP Basis Set: Gen
Summary Table:
Item Table:
Item               Value     Threshold  Converged?
 Maximum Force            0.000004     0.000450     YES
 RMS     Force            0.000002     0.000300     YES
 Maximum Displacement     0.000019     0.001800     YES
 RMS     Displacement     0.000010     0.001200     YES
 Predicted change in Energy=-1.213444D-10
 Optimization completed.
    -- Stationary point found.
Log File:
Frequency Table:
 Low frequencies ---   -0.0140   -0.0064   -0.0046    2.3647    2.3647    4.8091
 Low frequencies ---  155.9641  155.9661  267.7107
3D Image:
BBr3 |
DSpace Link:
Mini Project: Ionic Liquids
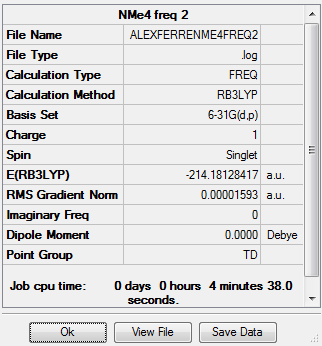
Tetramethyl Ammonium Ion
Calculation Method: B3LYP Basis Set: 6-31G (d,p)
Summary Table
Item Table:
Item               Value     Threshold  Converged?
 Maximum Force            0.000030     0.000450     YES
 RMS     Force            0.000016     0.000300     YES
 Maximum Displacement     0.000156     0.001800     YES
 RMS     Displacement     0.000139     0.001200     YES
 Predicted change in Energy=-4.022200D-08
 Optimization completed.
    -- Stationary point found.
Log File:
Frequency Table:
 Low frequencies ---   -0.0011   -0.0009   -0.0008   22.6527   22.6527   22.6527
 Low frequencies ---  188.8314  292.7676  292.7676
 Diagonal vibrational polarizability:
        1.3985326       1.3985326       1.3985326
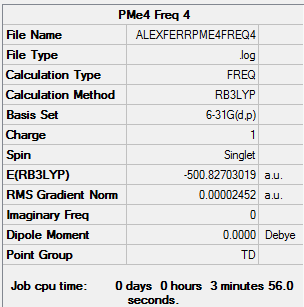
Tetramethyl Phosphonium ion
Calculation Method: B3LYP Basis Set: 6-31G (d,p)
Summary Table:
Item Table:
Item               Value     Threshold  Converged?
 Maximum Force            0.000035     0.000450     YES
 RMS     Force            0.000025     0.000300     YES
 Maximum Displacement     0.000475     0.001800     YES
 RMS     Displacement     0.000414     0.001200     YES
 Predicted change in Energy=-1.975649D-07
 Optimization completed.
    -- Stationary point found.
Log File:
Frequency Table:
Low frequencies ---    0.0021    0.0026    0.0034   26.4734   26.4734   26.4734
 Low frequencies ---  161.3944  195.8117  195.8117
 Diagonal vibrational polarizability:
        3.5282861       3.5282861       3.5282861
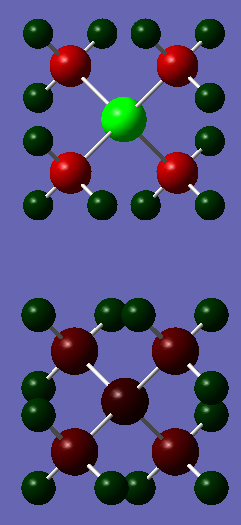
Charge Comparison Between Tetramethyl Phosphonium (top) and Tetramethyl Ammonium (bottom)
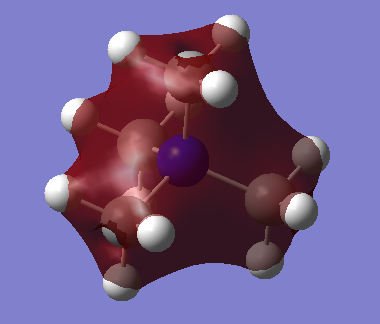
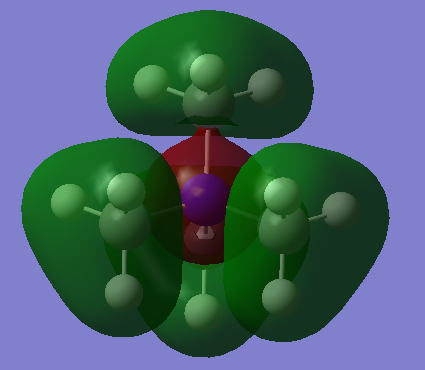
The ammonium ion has a much smaller degree of charge distribution than the phosphonium ion. the central phosphorous in the phosphonium carries a large positive charge (+1.667), in contrast to the slight negative charge found on the ammonium's nitrogen atom (-0.295). The reason for this is that phosphorous is larger and has more diffuse orbitals, which therefore means the carbon atoms are more able to draw electron density away from the phosphorous. this would also explain why the carbon atoms in the phosphonium are more negatively charged than the carbon atoms in the ammonium (-1.060 vs. -0.483). In both cases the hydrogen atoms are positively charged to similar extents (0.269 and 0.298).
Charge on Tetramethyl Ammonium ion
The overall ion is positively charged.The charge distribution of nitrogen shows that the nitrogen atom of the ion is in fact slightly negatively charged (-0.295). The carbon atoms are the most negatively charged (-0.483 each) while the hydrogen atoms are the most positively charged (+0.269 each).
The reason the ion is depicted with the positive charge on nitrogen is because, when representing bonding with Lewis structures, the nitrogen atom uses its lone pair to form an additional bond with the fourth methyl group, formally acquiring a negative charge.
This picture is not an entirely accurate method of describing electron density across molecules. MO theory predicts that electrons are distributed about orbitals which span the entire molecule, not single atoms. This model of chemical bonding allows for the computationally predicted charge distribution.
Ng611 (talk) 15:08, 31 May 2018 (BST) Good charge analysis. I would also discuss some other features. For example: what is the summation of the partial charges (it may seem obvious, but it should be mentioned), are the charges the same for symmetrically related atoms, how different are the charges on the hydrogen atoms given the electronegativity differences of the two central atoms?
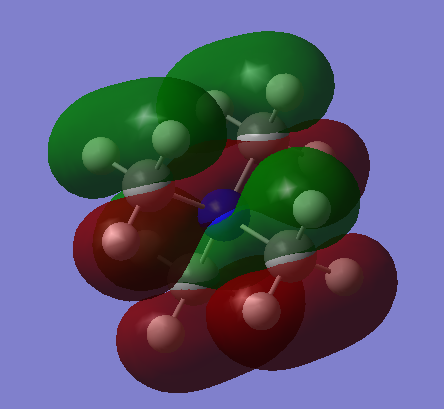
Selected MOs of the Tetramethyl Ammonium Ion
MO6:
MO10:
MO19 (also MO20 and MO21):
Ng611 (talk) 15:09, 31 May 2018 (BST) Good MO analysis and good overall report. A couple of your calculations were slightly off, but otherwise, this was a good, well-presented piece of work. Well done.

