
Rep:Mod:ahl10mod2
Module 2: Bonding and Molecular Orbitals in Main Group Compounds
GaussView 5.0.9 is a powerful program where you can construct the molecule you wish to investigate and run Gaussian calculations for the selected molecule. This is important for inorganic molecules and understanding their reactivity and bonding. This program is used extensively, especially molecules containing heavy atoms and molecules which are toxic to human, hence it would be a safer option to run calculations on it first rather than having exposure to the toxic chemical just to gain some experimental data.[1] All calculations and optimisations in this experiment were performed on GaussView 5.0.9.
Optimisations
Optimisation of BH3 with 3-21G basis set
BH3 molecule is created on GaussView 5.0.9 with B-H bond length of 1.5Å for all three B-H bonds. Optimisation and calculation were carried out on this default molecule of BH3.
Optimisation was performed on BH3 to find the equilibrium B-H bond length and H-B-H bond angle. The method used is B3LYP with simple basis set of 3-21G. The optimisation file for BH3 is linked to here.
The optimised bond length for B-H bond is 1.193Å and the optimised bond angle between H-B-H is 120°. Below shows the Guassian calculation summary:
| File Type | .log |
| Calculation Type | FOPT |
| Calculation Method | RB3LYP |
| Basis Set | 3-21G |
| Final Energy | -26.46226338 a.u. |
| Gradient | 0.00020672 a.u. |
| Dipole Moment | 0.00 Debye |
| Point Group | D3H |


        Item               Value     Threshold  Converged?
 Maximum Force            0.000413     0.000450     YES
 RMS     Force            0.000271     0.000300     YES
 Maximum Displacement     0.001610     0.001800     YES
 RMS     Displacement     0.001054     0.001200     YES
 Predicted change in Energy=-1.071764D-06
 Optimization completed.
    -- Stationary point found.
                           ----------------------------
                           !   Optimized Parameters   !
                           ! (Angstroms and Degrees)  !
 --------------------------                            --------------------------
 ! Name  Definition              Value          Derivative Info.                !
 --------------------------------------------------------------------------------
 ! R1    R(1,2)                  1.1935         -DE/DX =    0.0004              !
 ! R2    R(1,3)                  1.1935         -DE/DX =    0.0004              !
 ! R3    R(1,4)                  1.1935         -DE/DX =    0.0004              !
 ! A1    A(2,1,3)              120.0            -DE/DX =    0.0                 !
 ! A2    A(2,1,4)              120.0            -DE/DX =    0.0                 !
 ! A3    A(3,1,4)              120.0            -DE/DX =    0.0                 !
 ! D1    D(2,1,4,3)            180.0            -DE/DX =    0.0                 !
 --------------------------------------------------------------------------------
 GradGradGradGradGradGradGradGradGradGradGradGradGradGradGradGradGradGrad
The table above shows that the calculation has finished and converged, this can also be found in the .LOG file above. The last 4 steps with name A1, A2, A3 and D1 have shown that the gradient (-dE/dX), i.e. force, for each step is equal to zero, meaning that with a small displacement done to a molecule, the energy of the molecule will not change and it is at the most stable state.
The optimisation results can be represented using graphs. The total energy graph shows total energy plotted against optimisation step number. As each optimisation progresses, total energy decreases due to the bond length of B-H is getting closer to the equilibrium bond length and the gradient of the line on graph, i.e. force, decreases until reaching zero at the final optimisation step. This gradient (force) is also plotted on graph as the RMS (root mean square) gradient norm against optimisation step number, the end optimisation step is equal to zero, meaning that the force acting on the molecule is equal to zero and hence the BH3 is at equilibrium state. This information can be seen in the log file table above, showing where -dE/dx=0 and collectively all of these information have shown that using this basis set and method, the optimisation of the BH3 molecule is complete.
Optimisation of BH3 with basis set of 6-31G(d,p)
The BH3 molecule which was optimised with basis set of 3-21G is inaccurate and it does not provide a good description for BH3, therefore a better basis set should be used to obtain more accurate information and results on the molecule. The basis set of 6-31G(d,p) is used for this second optimisation of BH3 with the same method of B3LYP, this basis set is much more complex than 3-21G and it gives a much better approximation of the equilibrium state of BH3 molecule.
From this calculation, the optimised B-H bond length is 1.192Å and the optimised H-B-H bond angle is 120°. The table below shows the Gaussian calculation summary:
| File Type | .log |
| Calculation Type | FOPT |
| Calculation Method | RB3LYP |
| Basis Set | 6-31G(d,p) |
| Final Energy | -26.61532363 a.u. |
| Gradient | 0.00000235 a.u. |
| Dipole Moment | 0.000 Debye |
| Point Group | D3H |


        Item               Value     Threshold  Converged?
 Maximum Force            0.000005     0.000450     YES
 RMS     Force            0.000003     0.000300     YES
 Maximum Displacement     0.000019     0.001800     YES
 RMS     Displacement     0.000012     0.001200     YES
 Predicted change in Energy=-1.304899D-10
 Optimization completed.
    -- Stationary point found.
                           ----------------------------
                           !   Optimized Parameters   !
                           ! (Angstroms and Degrees)  !
 --------------------------                            --------------------------
 ! Name  Definition              Value          Derivative Info.                !
 --------------------------------------------------------------------------------
 ! R1    R(1,2)                  1.1923         -DE/DX =    0.0                 !
 ! R2    R(1,3)                  1.1923         -DE/DX =    0.0                 !
 ! R3    R(1,4)                  1.1923         -DE/DX =    0.0                 !
 ! A1    A(2,1,3)              120.0            -DE/DX =    0.0                 !
 ! A2    A(2,1,4)              120.0            -DE/DX =    0.0                 !
 ! A3    A(3,1,4)              120.0            -DE/DX =    0.0                 !
 ! D1    D(2,1,4,3)            180.0            -DE/DX =    0.0                 !
 --------------------------------------------------------------------------------
 GradGradGradGradGradGradGradGradGradGradGradGradGradGradGradGradGradGrad
The table above has been obtained from the .LOG file of optimisation of BH3 with 6-31G(d,p). It shows that all forces and displacements have converged and all the forces(-dE/dX) are equal to zero, showing that the optimised molecule is at stable structure.
Optimisation of TlBr3
Optimisation was performed on the molecule of TlBr3 with point group symmetry restricted to D3h and a very tight tolerance to changing to higher order point group. The optimised Tl-Br bond length is 2.651Å and the optimised Br-Tl-Br bond angle is 120°. The literature[2] value for Tl-Br bond length is 2.618Å, this is close to the calculated value and it suggests that the basis set and method we used are a good approximation for this molecule under analysis.
This calculaion has also been submitted to HPC and the finished calculation was submitted to the digital depository. The digital depository can be found on this D-space link: DOI:10042/21585 .
| File Type | .log |
| Calculation Type | FOPT |
| Calculation Method | RB3LYP |
| Basis Set | LANL2DZ |
| Final Energy | -91.21812851 a.u. |
| Gradient | 0.00000090 a.u. |
| Dipole Moment | 0.00 Debye |
| Point Group | D3H |


         Item               Value     Threshold  Converged?
 Maximum Force            0.000002     0.000450     YES
 RMS     Force            0.000001     0.000300     YES
 Maximum Displacement     0.000022     0.001800     YES
 RMS     Displacement     0.000014     0.001200     YES
 Predicted change in Energy=-6.084033D-11
 Optimization completed.
    -- Stationary point found.
                           ----------------------------
                           !   Optimized Parameters   !
                           ! (Angstroms and Degrees)  !
 --------------------------                            --------------------------
 ! Name  Definition              Value          Derivative Info.                !
 --------------------------------------------------------------------------------
 ! R1    R(1,2)                  2.651          -DE/DX =    0.0                 !
 ! R2    R(1,3)                  2.651          -DE/DX =    0.0                 !
 ! R3    R(1,4)                  2.651          -DE/DX =    0.0                 !
 ! A1    A(2,1,3)              120.0            -DE/DX =    0.0                 !
 ! A2    A(2,1,4)              120.0            -DE/DX =    0.0                 !
 ! A3    A(3,1,4)              120.0            -DE/DX =    0.0                 !
 ! D1    D(2,1,4,3)            180.0            -DE/DX =    0.0                 !
 --------------------------------------------------------------------------------
 GradGradGradGradGradGradGradGradGradGradGradGradGradGradGradGradGradGrad
The table above has been obtained from the .LOG file of the optimisation of TlBr3. With the information given above, the optimisation calculation of TlBr3 was converged in three steps and the optimised TlBr3 is indeed the equilibrium structure as shown by the value of zero for -dE/dx and the gradients on both total energy and RMS gradient graph are equal to zero.
Optimisation of BBr3
A molecule of was created by altering the BH3 molecule from the log file of BH3 optimisation with 6-31G(d,p). The optimisation was performed using method B3LYP and basis set GEN.
The calculation was submitted to HPC and the finished calculation was submitted to digital depository with a D-space link: DOI:10042/21590 .
The optimised BBr3 has an optimised B-Br bond length of 1.934Å and an optimised Br-B-Br bond angle of 120°.
| File Type | .log |
| Calculation Type | FOPT |
| Calculation Method | RB3LYP |
| Basis Set | Gen |
| Final Energy | -64.43645296 a.u. |
| Gradient | 0.00000382 a.u. |
| Dipole Moment | 0.00 Debye |
| Point Group | D3H |


        Item               Value     Threshold  Converged?
 Maximum Force            0.000008     0.000450     YES
 RMS     Force            0.000005     0.000300     YES
 Maximum Displacement     0.000036     0.001800     YES
 RMS     Displacement     0.000023     0.001200     YES
 Predicted change in Energy=-4.026911D-10
 Optimization completed.
    -- Stationary point found.
                           ----------------------------
                           !   Optimized Parameters   !
                           ! (Angstroms and Degrees)  !
 --------------------------                            --------------------------
 ! Name  Definition              Value          Derivative Info.                !
 --------------------------------------------------------------------------------
 ! R1    R(1,2)                  1.934          -DE/DX =    0.0                 !
 ! R2    R(1,3)                  1.934          -DE/DX =    0.0                 !
 ! R3    R(1,4)                  1.934          -DE/DX =    0.0                 !
 ! A1    A(2,1,3)              120.0            -DE/DX =    0.0                 !
 ! A2    A(2,1,4)              120.0            -DE/DX =    0.0                 !
 ! A3    A(3,1,4)              120.0            -DE/DX =    0.0                 !
 ! D1    D(2,1,4,3)            180.0            -DE/DX =    0.0                 !
 --------------------------------------------------------------------------------
 GradGradGradGradGradGradGradGradGradGradGradGradGradGradGradGradGradGrad
The table above has been obtained from the .LOG file of the optimisation of BBr3. With the information given above, the optimisation calculation of BBr3 was converged in three steps and the optimised BBr3 is indeed the equilibrium structure as shown by the value of zero for -dE/dx and the gradients on both total energy and RMS gradient graph are equal to zero.
Structure Comparison
| Molecule | BH3 [with 3-21G] | BH3 [with 6-31G(d,p)] | TlBr3 | BBr3 |
|---|---|---|---|---|
| Bond Length/Å | 1.193 | 1.192 | 2.651 | 1.934 |
By using a better basis set, more accurate information can be obtained for the molecule under investigation. The bond length for BH3 with basis set 6-31G(d,p) is similar to the bond length calculated with basis set of 3-21G, this is a very small difference but the bond length calculated with 6-31G(d,p) would be considered to be more accurate and precise to the fact that it is a better basis set.
By changing the ligands bonded to the central atom, it changes the bond length. As the size of atom of the ligand bonded central atom increases, the bond length increases as they have larger atomic radii due to higher number of electrons present around the ligand nucleus. Both ligands, in this case H and Br, are one electron donor ligands and they form single bonds with the central atom. Br atom is bigger than H atom as it has more electrons and it is a soft polarisable atom, when bonded to B atom, it would lead to a longer bond being formed and hence longer than the average bond length of B-H. Another factor contributing to the longer B-Br bond is the poor overlap of orbitals between B and Br. This mismatch in atomic orbital energy leads to poorer stabilisation of the newly formed molecular orbital, hence leading to formation of weaker bond and this is represented by the lengthening of the B-Br bond.
Orbital overlap applies to Tl-Br and B-H. Tl and Br are closer in terms of atomic orbital energy as they are both heavy atoms, this leads to better overlap when compared to B-Br, hence Tl-Br bond is relatively strong. B-H orbital is very good and this is reflected in the short bond length. It is a much stronger bond when compared to B-Br as it is shorter and the better orbital overlap gives rise to this difference. Tl and B are elements in group 13, they both have the same number of valence electrons but Tl is much more polarisable than B as it has a higher number of electrons, therefore it is much more diffused around the nucleus of Tl as electrons on the outer shells are further away from the nucleus and experiences less nuclear attraction.
A bond is a conceptual idea for humans to understand the interactions between two atoms. It is the overlap of electron density between the atoms where possible interactions can occur. GuassView generates bonds in between atoms to help us visualise the interaction between atoms. GuassView sometimes doesn't draw in bonds where we expected there to be one because it draws bonds based on distance criteria. If it exceeds the pre-defined values for distance, then no bonds will be observed for the molecule at that state but interactions of the electron density might still be present.
Frequency Analysis
BH3
The log file of optimisation of BH3 with basis set of 6-31G(d,p) was used for this vibrational frequency calculation in GuassView 5.0. Summary of the calculation setup is shown in the table below.
| File Type | .log |
| Calculation Type | FREQ |
| Calculation Method | RB3LYP |
| Basis Set | 6-31G(d,p) |
| Final Energy | -26.61532363 a.u. |
| Gradient | 0.00000237 a.u. |
| Dipole Moment | 0.000 Debye |
| Point Group | D3H |
Low frequencies ---   -0.9033   -0.7343   -0.0054    6.7375   12.2491   12.2824
Low frequencies --- 1163.0003 1213.1853 1213.1880
The low frequency data above has been obtained from the .LOG file of the frequency analysis of BH3. The low frequencies are within the range of +/-15cm-1 and there are no negative frequencies observed, meaning all calculated frequencies are minima as vibrational frequency is second derivative of potential energy and so this frequency calculation was successful.

There are only 3 peaks observed in the IR spectrum for BH3 because mode 2 and 3 have the same frequency and intensity as each other, therefore the peaks are overlapped and this applies to mode 5 and 6 as well. These modes overlapped due to the fact that they are generated by the two sets of degenerate orbitals found in the molecule with a point group symmetry label denoted by E, therefore giving them the same frequency of stretch and intensity. The remaining peak is caused by mode 1 with frequency of 1163 cm-1 and intensity of 92.54. Mode 4 does not give a peak as its intensity is zero and therefore it would not show up on the spectrum.
| Mode | Form of Vibration | Description | Frequency | Intensity | Symmetry (D3h point group) |
| 1 |  |
All H atoms oscillating in and out of the plane of the molecule in concerted motion with slight oscillation of B atom. | 1163 | 93 | A2" |
| 2 |  |
Two H atoms moving side to side like the scissoring motion. | 1213 | 14 | E' |
| 3 |  |
All H atoms wagging from left to right within the plane of the molecule. | 1213 | 14 | E' |
| 4 |  |
All H atoms moving in and out from the stationary central B atom with concerted motion. | 2582 | 0 | totally symmetric A1' |
| 5 |  |
Two H atoms moving in and out from the central B atom asymmetrically. | 2715 | 126 | E' |
| 6 |  |
Two H atoms moving in and out from the central B atom in concerted motion with the remaining H atom moving in and out from B atom asymmetrically from the other two. | 2715 | 126 | E' |
TlBr3
The log file of the optimisation of TlBr3 using method B3LYP with basis set of LanL2DZ was used for this frequency analysis.
| File Type | .log |
| Calculation Type | FREQ |
| Calculation Method | RB3LYP |
| Basis Set | LANL2DZ |
| Final Energy | -91.21812851 a.u. |
| Gradient | 0.00000088 a.u. |
| Dipole Moment | 0.000 Debye |
| Point Group | D3H |
Low frequencies ---   -3.4213   -0.0026   -0.0004    0.0015    3.9367    3.9367
Low frequencies ---   46.4289   46.4292   52.1449
The low frequency data above has been obtained from the .LOG file of the frequency analysis of TlBr3. The low frequencies are within the range of +/-15cm-1 and there are no negative frequencies observed, so this frequency calculation was successful.
This frequency calculation was submitted to departmental cluster and can be found in this D-space link: DOI:10042/21661 .

The IR spectrum of TlBr3 contains three broad peaks with low intensity as expected due to the D3h point group symmetry of the molecule. The three peaks are generated by the two degenerate states of E' and A2". The frequencies of these peaks are very low because Tl-Br bonds are weak due to the inefficient overlap of the Tl and Br orbitals. Both Tl and Br atoms have diffused electron density around the nuclei as they are both heavy atoms, this leads to the inefficient overlap of the electron density, hence generating more diffused molecular orbitals which lead to weaker bond and therefore lower frequencies.
| Mode | Form of Vibration | Description | Frequency | Intensity | Symmetry (D3h point group) |
| 1 |  |
Two Br atoms moving side to side like the scissoring motion while Tl and remaining Br remained stationary. | 46 | 4 | E' |
| 2 |  |
Whole molecule is wagging from side to side within the plane of the molecule. | 46 | 4 | E' |
| 3 |  |
All Br atoms oscillating symmetrically with Tl atom oscillating asymmetrically with respect to Br atoms. | 52 | 6 | A2" |
| 4 |  |
All Br atoms moving in and out from the stationary central Tl atom with concerted motion. | 165 | 0 | totally symmetric A1' |
| 5 |  |
Two Br atoms moving in and out from the central Tl atom asymmetrically with wagging of Tl atom and stationary remaining Br atom. | 211 | 25 | E' |
| 6 |  |
Two Br atoms moving in and out from the central Tl atom in concerted motion with the remaining Br atom moving in and out from B atom asymmetrically from the other two. | 211 | 25 | E' |
Comparison
BH3 and TlBr3 have D3H geometry, this leads to three peaks being observed in the IR spectrum of both molecules as expected, but there is a large difference in the frequency values of these peaks and the appearance of the peaks between the two. TlBr3 has much lower frequency and broader peaks when compared to BH3, where the frequencies for TlBr3 are smaller than the frequencies of BH3 by a factor of 10. This is due to Tl-Br bonds are weak bonds and vibrational frequency correlates to potential energy directly as it is the second derivative of potential energy, so weak bonds have high potential energy, hence lower vibrational frequency stretches in the IR spectrum and whereas strong bonds have low potential energy, therefore they would have higher vibrational frequency stretches in the IR spectrum. Tl-Br bond is a weak bond because both atoms have very diffused electron density around the nuclei due to the fact that they are heavy atoms, this leads to a poorer overlap of electron density between the two atoms and hence weaker bonds.
There has been reodering of some modes between the two molecules. From mode 4 to mode 6, for both molecules, these stayed the same ordering, but from mode 1 to mode 3, the order of these modes in BH3 is different to the order of these modes in TlBr3. This reordering occurred due to the A2" symmetry mode of vibration of TlBr3 generates a greater dipole moment when compared to BH3. TlBr3 has much more polarisable electron density than BH3. When the atoms of the molecule oscillates, the distortion of the electron density is much greater than what you would observe in BH3, therefore a bigger dipole moment can be generated, so this leads to the increase in vibrational frequency for this mode of vibration and hence reordering of the vibrational modes for mode 1 to 3.
The A2" and E' modes lie very close in both IR spectra and they are the low frequency modes generated by the actual movement (e.g. wagging, scissoring, rocking, twisting) of atoms themselves in the molecules. The A1' and E' modes both lie close together in spectra and they are the high frequency modes generated by the stretching of the bonds within the molecule. A1' and E' are much higher in frequencies compare to the other two is because these modes involve the distortion of the electron density between the atom (i.e. stretching of bonds), this means there is large change in dipole moment in the molecule and hence the frequencies of these stretches would be high up in spectra. Conversely, the A2" and E' modes are low in frequencies in spectra because the movements of the atoms in the molecule do not generate a big change in dipole moment within the molecule and hence lower in vibrational frequencies.
For every molecule that is not linear, there are 3N-6 vibrational frequencies with N as the number of atoms in the molecule, this gives six vibrational frequencies for BH3 and TlBr3. These six low vibrational frequencies represent the motions of the centre of mass of the molecule, these frequencies are much smaller than the frequencies observed for the vibrational modes because the motions of the centre of mass of molecule does not cause a big change in dipole moment of the molecule and therefore these motions are represented as low frequencies.
For both molecules, the same method and basis set is used for optimisation and frequency calculations because the calculations must be consistent for both to obtain accurate results and having the same method and basis set for calculations of both molecules, this allows comparisons of the data of the molecules to take place. The purpose of carrying out a frequency analysis is to make sure that all energies are at a minimum for the molecule, so all frequencies calculated are expected to be positive as it is the second derivative of potential energy, therefore having positive frequency values would mean the energy is at a minimum. Another reason for frequency analysis to compare calculated results with experimental data, this allows us to see whether the calculations of the molecule matches up with what has been observed from the experimental data and hence getting a better understanding of the molecule under investigation.
MO Analysis
BH3

The MO analysis calculation of BH3 was submitted to departmental cluster and the D-space link can be found here: DOI:10042/21662 .
The chk file of the optimisation of BH3 with 6-31G(d,p) basis set was used for the MO analysis of BH3. The MO surfaces generated from the chk file match up with the MO generated from the linear combination of fragment orbitals, there is no significant difference observed between the two and this can be seen in the MO diagram of BH3. There are many orbitals generated for a molecule of BH3, but we are only interested in MO 1 to MO 8, which are the occupied orbitals including the HOMO and LUMO. These MOs are included in the MO diagram and they are significant as they are the results of the interactions of the fragment orbitals. HOMO and LUMO are important as they determine the reactivity of the molecule and other properties of the molecule.
MO 8 is the most antibonding molecular orbital that has been taken into account in the MO diagram, this MO has the symmetry label of e', which correspond to the IR frequencies with symmetry labels of E' and this applies to all the symmetry labels of the remaining MOs. MO 1 is the bonding orbital with the lowest energy and a symmetry label of a1'; it is not IR active because it is too low in energy to have any interactions and hence not observed in the IR spectrum of BH3. MO 4 has a symmetry label of e'; it is the HOMO of the molecule and it is occupied by two electrons and the LUMO is MO 5, which has a symmetry label of a2".
The HOMO-LUMO gap is relatively small and the LUMO is a non-boning orbital, so borane molecule itself is quite reactive as addition of electrons into the MO would not have a big effect on the stabilisaton energy of overall molecule as the electrons are not going into an antibonding orbital and therefor in reality, borane molecules tend to dimerise to form diborane and share electrons which occupy this non-bonding molecular orbital.
The MO surfaces match up with the MO generated by linear combination of fragment orbitals in terms of the bonding and antibonding orbital distribution for each MO but the MOs generated by linear combination do not show whether they are diffuse orbitals, whereas the MOs generated by Guassian show whether they are or not. From this, the antibonding orbitals are shown to be more diffused compared to bonding MOs.
The accuracy of qualitative MO theory is fairy high as the MOs generated by linear combination of MOs matched up with the MOs generated by Gaussian in terms of electron distribution but MOs generated by linear combination of fragment orbitals do not show whether the orbitals are diffused or not. In general, LCAO MOs are useful as they are qualitative pictures of MOs of the molecule under investigation and they do not require specific data and calculations to generate them.
NH3 Analysis
Optimisation
A molecule of NH3 is created on GaussView 5.0 and it was optimised using method B3LYP with basis set of 6-31G(d,p). The optimised NH3 has a bond angle of 106° and an equilibrium N-H bond length of 1.018Å.


| File Type | .log |
| Calculation Type | FOPT |
| Calculation Method | RB3LYP |
| Basis Set | 6-31G(d,p) |
| Final Energy | -56.55776856 a.u. |
| Gradient | 0.00000885 a.u. |
| Dipole Moment | 1.8464 Debye |
| Point Group | C1 |
        Item               Value     Threshold  Converged?
 Maximum Force            0.000024     0.000450     YES
 RMS     Force            0.000012     0.000300     YES
 Maximum Displacement     0.000079     0.001800     YES
 RMS     Displacement     0.000053     0.001200     YES
 Predicted change in Energy=-1.629727D-09
 Optimization completed.
    -- Stationary point found.
The table above has be obtained from .LOG file of the optimisation of NH3. It shows that the optimisation only took four steps to be fully converged and the optimised structure of NH3 obtained is the equilibrium structure of the molecule. Both the total energy and RMS gradient graphs plateaued at the end going from optimisation step 3 to step 4, therefore showing that the calculations for the optimisation has been completed.
Frequency Analysis
The log file of the optimisation of NH3 using method B3LYP with basis set of 6-31G(d,p) was used for the calculation of frequency analysis.
| File Type | .log |
| Calculation Type | FREQ |
| Calculation Method | RB3LYP |
| Basis Set | 6-31G(d,p) |
| Final Energy | -56.55776872 a.u. |
| Gradient | 0.00000136 a.u. |
| Dipole Moment | 1.8464 Debye |
| Point Group | C1 |
Low frequencies ---   -9.3148   -8.1837   -6.2574   -0.0008   -0.0006    0.0015
Low frequencies --- 1089.3358 1693.9210 1693.9247
The low frequency data above has be obtained from .LOG file of the optimisation of NH3. There is no negative low frequency value in the second line of the low frequencies data, this means that all energies are at a minimum and the optimisation of NH3 is complete.
There are only three peaks observed in the IR spectrum with one of the peaks at a very low intensity and can hardly be seen on the spectrum. Mode 5 and 6 are not observed at the intensity for both peaks are below 1, this is much lower compare to the intensities of other modes and so they would not be observed in the spectrum. Mode 2 and 3 are degenerate as they both have the same frequency.
Same with BH3 and TlBr3, the higher frequencies are generated by the stretching of the bonds as they generate a larger dipole moment compare to the lower frequencies stretches generated by the motions of atoms and molecule.

| Mode | Form of Vibration | Description | Frequency | Intensity | Symmetry (C3v point group) |
| 1 |  |
All H atoms oscillating in and out of the plane of the molecule in concerted motion with slight oscillation of N atom. | 1089 | 145 | A2 |
| 2 |  |
Two H atoms moving side to side like the scissoring motion with remaining H atom oscillating up and down. | 1694 | 14 | E |
| 3 |  |
All H atoms wagging from left to right. | 1694 | 14 | E |
| 4 |  |
All H atoms moving in and out from the stationary central B atom with concerted motion. | 3461 | 1 | A1 |
| 5 |  |
All H atoms oscillation towards and away from the central N atom. | 3590 | 0 | E |
| 6 |  |
Two H atoms moving in and out from the central B atom in concerted motion with the remaining H atom moving in and out from N atom asymmetrically from the other two. | 3590 | 0 | E |
MO Analysis
The MO analysis calculation of NH3 was submitted to departmental cluster and the D-space link can be found here: DOI:10042/21688 .
The geometry of NH3 is shown to be C1 but the actual geometry of this molecule should be C3v due to the presence of the lone pair on nitrogen. This difference in geometry is due to the constraint we have introduced into this MO calculation at the beginning, where the additional keyword of 'nosymm' allows geometry to not be considered in the calculations.
The MOs generated by this calculation are more diffused compare to the MOs generated for BH3 but in general, the LCAOs of NH3 are the same as the MOs generated by Gaussian for BH3 and this is shown in the table below. The HOMO is MO 5 and LUMO is MO 6, this is expected as nitrogen has two more electrons compare to boron and therefore it would have two extra electrons in the MO diagram occupying MO 5. In general,, the ordering of MO for NH3 is very similar to the ordering observed in BH3, but the energies of the MOs in ammonia would be lower than borane as nitrogen is a more electronegative atom compare to boron, therefore it would lower the energies of the newly formed MOs more amd hence overall MO diagram of NH3 would have lower energy.
| MO | MO surface | LCAO | MO | MO surface | LCAO |
| 1 |  |
 |
5 |  |

|
| 2 |  |
 |
6 |  |

|
| 3 |  |
 |
7 |  |

|
| 4 |  |
 |
8 |  |

|
NBO Charge Analysis

The charge distribution of NH3 ranges from -1.125 to 1.125. The specific NBO charge for each H atom is +0.375 and the NBO charge for N atom is -1.125, these data has also been shown in the table below. This is expected for NH3 as nitrogen contains a lone pair of electron and it is more electronegative than hydrogen, therefore it would withdraw electron density from the three hydrogen atoms it is bonded to, hence an induced negative charge resides on N and leaving hydrogen atoms with positive charge numbers.
From the natural bonding orbital analysis, for all N-H bonds, it shows that they are all sp3 hybridised as expected because N-H bond is a single bond and the lack of valency of hydrogen atom restricts it to sp3 hybridisation only. The nitrogen atom contribute 69% to the bond with hydrogen contributing 31% to the bond. Nitrogen is the most electronegative atom in the periodic table and it has more electrons compare to hydrogen, therefore it would contribute more towards the bond as it has a larger electron density for the electron density of hydrogen to overlap and hence larger contribution.
Summary of Natural Population Analysis:

                                       Natural Population
                Natural  -----------------------------------------------
    Atom  No    Charge         Core      Valence    Rydberg      Total
 -----------------------------------------------------------------------
      N    1   -1.12515      1.99982     6.11104    0.01429     8.12515
      H    2    0.37505      0.00000     0.62250    0.00246     0.62495
      H    3    0.37505      0.00000     0.62250    0.00246     0.62495
      H    4    0.37505      0.00000     0.62249    0.00246     0.62495
 =======================================================================
   * Total *    0.00000      1.99982     7.97852    0.02166    10.00000
| Bond | Coefficient | Hybridisation |
|---|---|---|
| N-H | N(69%) H(31%) | s(25%) p(75%) |
NH3BH3
Optimisation
A molecule of NH3BH3 was generated on GaussView 5.0. The optimisation of this molecule was performed using method B3LYP with basis set 6-31G(d,p). The optimised NH3BH3 has a N-B bond length of 1.669Å, N-H bond length of 1.018Å and B-H bond length of 1.210Å. The bond angle of H-N-H is 108° and bond angle of H-B-H is 114° .


| File Type | .log |
| Calculation Type | FOPT |
| Calculation Method | RB3LYP |
| Basis Set | 6-31G(d,p) |
| Final Energy | -83.22468868 a.u. |
| Gradient | 0.00005748 a.u. |
| Dipole Moment | 5.5628 Debye |
| Point Group | C3 |
       Item               Value     Threshold  Converged?
 Maximum Force            0.000166     0.000450     YES
 RMS     Force            0.000035     0.000300     YES
 Maximum Displacement     0.000908     0.001800     YES
 RMS     Displacement     0.000323     0.001200     YES
 Predicted change in Energy=-1.132146D-07
 Optimization completed.
    -- Stationary point found.
The table above has be obtained from .LOG file of the optimisation of NH3BH3. Six steps were taken for the optimisation of this molecule to complete. This number of steps is higher than the number of steps needed for the optimisation of previous molecules; this is because NH3 is a bigger molecule compared to BH3, it has more bonds and bond angle to be optimised and hence more steps needed to obtain equilibrium structure. From information above, it shows that the calculation has converged and the equilibrium structure is obtained for NH3BH3.
Frequency Analysis
The log file of optimisation of NH3BH3 using method B3LYP with basis set 6-31G(d,p) was used for the frequency analysis of this molecule.
There are 8 peaks observed in the IR spectrum of NH3BH3 and there are 18 modes of vibrations in shown in the log file of this frequency analysis. The modes that are not observed in the spectrum are mode 1, 3, 4, 8, 9 and 16. Mode 1 is not observed because it is IR inactive as the intensity is equal to zero. All the others have intensities below 5, when compare to some of the other intensities where they are over 100, they are very low and hence they would not be observed in the IR spectrum.
There are 8 modes with symmetry label of E which are observed in IR spectrum. They are 4 pairs of degenerate modes of vibrations and they generate 4 observable peaks in the spectrum. The remaining 4 peaks are generated by mode 2, 7, 10 and 13 and they are not degenerate. The vibrational modes above 2000 cm-1 are caused by the stretching bonds in the molecule, these modes are high in frequency because stretching of the bonds involve a bigger change in dipole moments and hence they are very IR active.

| File Type | .log |
| Calculation Type | FREQ |
| Calculation Method | RB3LYP |
| Basis Set | 6-31G(d,p) |
| Final Energy | -83.22468902 a.u. |
| Gradient | 0.00000106 a.u. |
| Dipole Moment | 5.5646 Debye |
| Point Group | C3 |
Low frequencies ---   -4.9839   -3.2959   -3.2863    0.0031    0.0365    0.0839
Low frequencies ---  263.3734  632.9785  638.4053
The low frequency data above has been obtained from the .LOG file of the frequency analysis of NH3BH3.
| Mode | Form of Vibration | Frequency | Intensity | Symmetry (C3 point group) | Mode | Form of Vibration | Frequency | Intensity | Symmetry (C3 point group) |
| 1 |  |
263 | 0 | A | 10 |  |
1329 | 114 | A |
| 2 |  |
633 | 14 | A | 11 |  |
1676 | 28 | E |
| 3 |  |
638 | 4 | E | 12 |  |
1676 | 28 | E |
| 4 |  |
638 | 4 | E | 13 |  |
2472 | 67 | A |
| 5 |  |
1069 | 41 | E | 14 |  |
2532 | 231 | E |
| 6 |  |
1069 | 41 | E | 15 |  |
2532 | 231 | E |
| 7 |  |
1196 | 109 | A | 16 |  |
3463 | 3 | A |
| 8 |  |
1204 | 3 | E | 17 |  |
3581 | 28 | E |
| 9 |  |
1204 | 3 | E | 18 |  |
3581 | 28 | E |
Association Energy
| E(NH3) | -56.55776856 a.u. |
| E(BH3) | -26.61532363 a.u. |
| E(NH3BH3) | -83.22468868 a.u. |
| ΔE | -0.05159649 a.u. |
ΔE = E(NH3BH3)-[E(NH3)+E(BH3)]
ΔE = -83.22468868 - [(-56.55776856)+(-26.61532363)]
ΔE = -0.05159649 a.u. = -135.78 kJ/mol
The association energy of combining a molecule of NH3 and BH3 is conversely the dissociation energy/bond energy for NH3BH3. The calculated dissociation energy/bond energy for a molecule of NH3BH3 is -135.78 kJ/mol and it was calculated using the equation above for the change in energy, ΔE.
The calculated dissociation energy of the molecule is within the ballpark of bond dissociation energy,one would expect the bond dissociation energy of a bond to be between 100-500 kJ/mol and depending on the bond itself, strong bonds would have dissociation energy above 300 kJ/mol, so for the bond dissociation of N-B with the molecule of NH3BH3, the value is relatively low; this means that the N-B bond is relatively weak and it does not require a large amount of energy to break the bond. The negative sign to the value suggests that the dissociation of this bond would be exothermic as eneryg will be released from this process.
The literature[3] value of the bond association energy for NH33 is 119.24 kJ/mol. This is lower than the calculated value of association energy. Experimental value and calculate value rarely matches up due to the fact that we are using a mix basis set to take into account of the fact that the molecule is quite big and quantum mechanical effects can take place, this would introduce errors into the calculation and therefore the calculated values would not be accurate and precise. Another reason for the mismatch of experimental and calculated values is that GuassView combines quantum mechanics with classical mechanics, because of this mix of different calculations, errors can be introduced as the calculations are not in agreement with each other and therefore the calculated value would be different compare to experimental value of the association energy of NH3BH3.
Aromaticity
Aromaticity is a property where a conjugated π system or lone pairs are present in a molecule and it causes an unexpected stabilisation in the energy of the molecule as the π electrons delocalise across the molecule. A molecule must obey the Huckel rule, where for a system to be aromatic, it must have 4n+2 π electrons present. Benzene, Boratabenzene, Pyridinium and Borazine all have 42 electrons present and 6 of the 42 electrons are π electrons, therefore all of them obey the Huckel rule and hence they are aromatic.[4]
Benzene
Optimisation
The optimisation calculation of benzene was submitted to departmental cluster and the D-space link can be found here: DOI:10042/21800 .
A molecule of benzene was created on GaussView 5.0 and it was optimised using method B3LYP with basis set 6-31G(d,p). The optimised benzene structure has C-H bond length of 1.099Å and C-C bond length of 1.395Å. As expected, all C-C and C-H bonds have the same bond length as the molecule of benzene is completely symmetric, therefore the electron density is evenly spread across the whole molecule and giving all bonds to be equivalent. The observed C-C bond length is in between the observed bond lengths of C-C bond (1.513Å)[5] and C=C bond (1.299Å)[5]. This supports the theory the π electrons in the benzene ring system are delocalised as this causes all the C-C bonds to be equivalent and having hybridisation characters of somewhere between sp3 and sp2, therefore bond lengths of somewhere between a single C-C bond and double C=C bond.


| File Type | .log |
| Calculation Type | FOPT |
| Calculation Method | RB3LYP |
| Basis Set | 6-31G(d,p) |
| Final Energy | -232.25820551 a.u. |
| Gradient | 0.0009549 a.u. |
| Dipole Moment | 0.0001 Debye |
| Point Group | C1 |
        Item               Value     Threshold  Converged?
 Maximum Force            0.000212     0.000450     YES
 RMS     Force            0.000085     0.000300     YES
 Maximum Displacement     0.000991     0.001800     YES
 RMS     Displacement     0.000315     0.001200     YES
 Predicted change in Energy=-5.157454D-07
 Optimization completed.
    -- Stationary point found.
The table above has been obtained from .LOG file of the optimisation of benzene. All calculations have been converged as shown by the table of data above and the optimised structure obtained is the equilibrium structure as -dE/dx=0. It took two steps for the optimisation to reach equilibrium structure as shown by the total energy and RMS gradient norm graphs. This suggests that the basis set of 6-31G(d,p) is a good basis set for benzene as the number of optimisation steps required is very low.
Frequency Analysis
The frequency analysis calculation was submitted to departmental cluster and the D-space link can be found here: DOI:10042/21791 . The same method and basis set as optimisation were used for this calculation.
| File Type | .log |
| Calculation Type | FREQ |
| Calculation Method | RB3LYP |
| Basis Set | 6-31G(d,p) |
| Final Energy | -232.25820476 a.u. |
| Gradient | 0.00000374 a.u. |
| Dipole Moment | 0.0000 Debye |
| Point Group | C1 |

Low frequencies ---   -0.0004   -0.0002    0.0004    1.2764    2.8520    9.2722
Low frequencies ---  414.5347  414.6189  621.0767
The low frequency data above has been obtained from .LOG file of the frequency analysis of optimised benzene.
There are four peaks observed in the IR spectrum of benzene. There are only 7 IR active modes and there are three sets of degenerate vibrational frequencies. Mode 14 and 15, mode 21 and 22 and mode 28 and 29 are the three sets of degenerate frequencies. For mode 14, 15, 21 and 22, the shape of the benzene ring is distorted by the motions of the atoms, e.g. wagging, rocking, scissoring and twisting. These modes of motion are typically low in frequencies due to the small change in dipole moment in the molecule and this applies to mode 5 too as it has the lowest frequency out of the IR active modes. Mode 28 an 29 are genrated by the stretching of the C-H bonds within the molecule, this generates a bigger change in dipole moment and hence higher in vibrational frequencies.
| Mode | Frquency | Intensity | Mode | Frequency | Intensity | Mode | Frequency | Intensity |
|---|---|---|---|---|---|---|---|---|
| 1 | 414 | 0 | 11 | 1013 | 0 | 21 | 1524 | 7 |
| 2 | 414 | 0 | 12 | 1017 | 0 | 22 | 1524 | 7 |
| 3 | 621 | 0 | 13 | 1019 | 0 | 23 | 1652 | 0 |
| 4 | 621 | 0 | 14 | 1066 | 3 | 24 | 1652 | 0 |
| 5 | 694 | 74 | 15 | 1066 | 3 | 25 | 3171 | 0 |
| 6 | 718 | 0 | 16 | 1179 | 0 | 26 | 3181 | 0 |
| 7 | 865 | 0 | 17 | 1202 | 0 | 27 | 3181 | 0 |
| 8 | 865 | 0 | 18 | 1202 | 0 | 28 | 3197 | 47 |
| 9 | 974 | 0 | 19 | 1355 | 0 | 29 | 3197 | 47 |
| 10 | 974 | 0 | 20 | 1380 | 0 | 30 | 3207 | 0 |
MO Analysis

The MO analysis calculation was submitted to departmental cluster and the D-space link can be found here: DOI:10042/21794 .
The MO diagram for benzene as shown on the side include only the non-core orbitals and the antibonding orbitals included are pi- antibonding orbitals. The HOMO is MO 21, which is a degenerate pi orbital with MO 20, it has two nodal planes and it is occupied by two electrons. The interactions between the px orbitals are weak as they are interacting through space rather than head-on and therefore the energy of stabilisation is low and in general, the energy of the The LUMO is MO 22, which is also a degenerated pi orbital with MO 23 and it contains three nodal planes. In most conventional MO diagrams of benzene, they only show that pi orbitals, leaving out the sigma orbitals (i.e. MO 18 and 19) in between them because they are considered to be not important as they are not involved in the reactivity of the benzene molecule.
From MO 7 up to MO 22, these are considered to be the non-core orbitals of benzene as they are low in terms of potential energy where it would not affect the reactivity of benzene and they would only be considered if dative bonding mode is present in a molecule. Most of the orbitals with low potential energy are created through the combinations of 1s orbitals of hydrogen atoms and 2s orbital of carbon atoms as s orbitals are lower in energy when compared to p orbitals. MO 7 is the all bonding orbital consists of 1s orbitals of H and 2s orbitals of C where there are head-on interactions, it is expected that this MO has the lowest energy as there is no nodal plane present and all orbitals are in phase with each other. There are 6 sets of degenerate orbitals observed in benzene and this is caused by the combination of the C atomic orbitals. All C atomic orbitals have the same potential energy and when degenerate atomic orbitals of benzene combine with the degenerate orbitals of another benzene molecule, a degenerate set of MO would be formed with a high energy of stabilisation for the bonding MOs. This degeneracy can be removed when a different atom with different electronegativity is introduced into the ring to interact with C as observed in the benzene analogues (e.g. boratabenzene).
For MO 17, 10 and 21, they show that the π electron density is spread across the molecule rather than localised to certain atomic positions and this is most noticeable in MO 17 where all π orbitals are in phase and the electron density is spread across the whole molecule. This is due t the delocalisation of π electrons and this is in agreement with features of aromaticity, therefore benzene is an aromatic molecule. The three bonding π-symmetry orbitals are all occupied by two electrons each as one would expect because there are three double bonds in benzene, this gives 6 π electrons, this obey the Huckel rule for aromaticity where for a system to be aromatic, it must have 4n+2 π electrons, in the case of benzene, it has 6 π electrons with n=2.
The HOMO energy is -0.24691 a.u. and the LUMO energy is 0.00267 a.u.. This gap is quite big as the sign of the value goes from negative to positive. This can explain why benzene is stabilised in its normal state and it is not susceptible to addition reaction but it is susceptible to substitution reactions. Addition reactions involve addition of electrons into the LUMO as the degenerate HOMO is fully occupied, this causes an increase in the overall energy of the system as electrons are being added into antibonding orbitals, therefore addition is not favoured whereas substitution is as it doesn't involve change in number of electrons in the MO diagram and the energy of stabilisation from the delocalised ring is kept.
NBO Charge Analysis
The charge distribution of benzene ranges from -0.239 to 0.239 with the red representing the negative numbers and green representing the positive numbers. The table below shows the natural charges on each C and H atoms. All C atoms has slight negative charge with H atoms with slight positive charge, this is expected as C is more electronegative than H, so the electron density would be pulled towards C more and hence build up of electron on C.
For all C atoms in the molecule, they all have 50% contribution towards C-C bonds and the orbitals contributing are the sp2 hybridised orbitals as expected because of the presence of double bonds but there is no sp3 hybridised orbital contribution which would be expected if single bonds are present. Due to the delocalistion of the pi-electrons into the ring and the presence of the conjugated system, i.e. aromaticity of the molecule, all the C-C bonds are made equivalent and hence same orbitals being contributed as shown in the natural bonding orbital analysis. For C-H bonds, C has a higher contribution towards the bond than H as expected and the contributing orbitals are sp3 hybridised orbitals of C and s orbital of H, hence this forms a single bond between C atom and H atom. Further comparison of NBO charge distribution between analogues can be found in later section.

Summary of Natural Population Analysis:

                                       Natural Population
                Natural  -----------------------------------------------
    Atom  No    Charge         Core      Valence    Rydberg      Total
 -----------------------------------------------------------------------
      C    1   -0.23852      1.99910     4.22611    0.01331     6.23852
      C    2   -0.23855      1.99910     4.22613    0.01331     6.23855
      C    3   -0.23854      1.99910     4.22613    0.01331     6.23854
      C    4   -0.23852      1.99910     4.22611    0.01331     6.23852
      C    5   -0.23855      1.99910     4.22613    0.01331     6.23855
      C    6   -0.23854      1.99910     4.22613    0.01331     6.23854
      H    7    0.23854      0.00000     0.76003    0.00144     0.76146
      H    8    0.23853      0.00000     0.76003    0.00144     0.76147
      H    9    0.23854      0.00000     0.76002    0.00144     0.76146
      H   10    0.23854      0.00000     0.76003    0.00144     0.76146
      H   11    0.23853      0.00000     0.76003    0.00144     0.76147
      H   12    0.23854      0.00000     0.76002    0.00144     0.76146
 =======================================================================
   * Total *    0.00000     11.99462    29.91690    0.08847    42.00000
| Bond | Coefficient | Hybridisation |
|---|---|---|
| C1-C2 | C(50%) C(50%) | s(35%) p(65%) |
| C2-C3 | C(50%) C(50%) | s(35%) p(65%) |
| C3-C4 | C(50%) C(50%) | s(35%) p(65%) |
| C4-C5 | C(50%) C(50%) | s(35%) p(65%) |
| C5-C6 | C(50%) C(50%) | s(35%) p(65%) |
| C6-C1 | C(50%) C(50%) | s(35%) p(65%) |
| C-H | C(62%) H(38%) | s(30%) p(70%) |
Boratabenzene
Optimisation
The optimisation calculation for boratabenzene was submitted to departmental cluster and the D-space link can be found here: DOI:10042/21796 .
This optimisation was performed using method B3LYP with basis set 6-31G(d,p). The optimised bond lengths are the following: B-H = 1.218Å, B-C = 1.514Å, C-C = 1.399Å & 1.405Å and C-H = 1.097Å. There is a difference in the C-C bond length due to the fact that the carbon neighbouring the boron are in a different environment compare to the carbon atoms that are the furthest away from the boron atom. The C-C bonds closest to boron are shorter than the others due to more electron density being push into these two carbon atoms as carbon is more electronegative than boron, it withdraws electron density away from from boron, therefore more electron density for overlap for C-C bond, making the bond to be strong and hence shortening the bond.


| File Type | .log |
| Calculation Type | FOPT |
| Calculation Method | RB3LYP |
| Basis Set | 6-31G(d,p) |
| Final Energy | -219.02052299 a.u. |
| Gradient | 0.00000500 a.u. |
| Dipole Moment | 2.8456 Debye |
| Point Group | C1 |
         Item               Value     Threshold  Converged?
 Maximum Force            0.000010     0.000015     YES
 RMS     Force            0.000002     0.000010     YES
 Maximum Displacement     0.000057     0.000060     YES
 RMS     Displacement     0.000015     0.000040     YES
 Predicted change in Energy=-8.829535D-10
 Optimization completed.
    -- Stationary point found.
The table above has been obtained from the .LOG file of the optimisation of boratabenzene and it shows that all calculations have been converged.
Frequency Analysis
The frequency analysis calculation for boratabenzene was submitted to departmental cluster and the D-space link can be found here: DOI:10042/21796 .
For this calculation, the same method and basis set as optimisation were used.
| File Type | .log |
| Calculation Type | FREQ |
| Calculation Method | RB3LYP |
| Basis Set | 6-31G(d,p) |
| Final Energy | -219.02052299 a.u. |
| Gradient | 0.00000500 a.u. |
| Dipole Moment | 2.8456 Debye |
| Point Group | C1 |

Low frequencies ---   -7.2699    0.0001    0.0005    0.0007    3.1438    4.5253
Low frequencies ---  371.2962  404.4161  565.0825
The table above has been obtained from the .LOG file of the frequency analysis of optimised boratabenzene.
There are 30 vibrational frequencies for boratabenzene as shown in the table below, but there are 20 peaks present in the IR spectrum of this molecule. This is because the remaining 10 missing peaks are IR inactive, i.e. having intensities equalling to one or lower, and therefore they will not show up in the IR spectrum.
| Mode | Frquency | Intensity | Mode | Frequency | Intensity | Mode | Frequency | Intensity |
|---|---|---|---|---|---|---|---|---|
| 1 | 370 | 2 | 11 | 917 | 1 | 21 | 1449 | 9 |
| 2 | 404 | 0 | 12 | 950 | 0 | 22 | 1462 | 14 |
| 3 | 565 | 0 | 13 | 951 | 0 | 23 | 1564 | 7 |
| 4 | 568 | 0 | 14 | 960 | 2 | 24 | 1592 | 40 |
| 5 | 608 | 11 | 15 | 1012 | 4 | 25 | 2447 | 368 |
| 6 | 710 | 2 | 16 | 1084 | 3 | 26 | 3027 | 108 |
| 7 | 755 | 7 | 17 | 1175 | 1 | 27 | 3029 | 0 |
| 8 | 815 | 0 | 18 | 1179 | 1 | 28 | 3059 | 380 |
| 9 | 873 | 28 | 19 | 1227 | 1 | 29 | 3061 | 10 |
| 10 | 905 | 0 | 20 | 1333 | 30 | 30 | 3116 | 112 |
MO Analysis
The MO analysis calculation for boratabenzene was submitted to departmental cluster and the D-space link can be found here: DOI:10042/21798 .
There is no degeneracy of orbitals in boratabenzene due to the reduce in symmetry of the molecule. The energy of HOMO is 0.01095 a.u. and the energy of LUMO is 0.21472 a.u.. This gap is small compare to benzene, this suggests that the reactivity of boratabenzene is quite high as the addition of an extra electron into the LUMO would be quite facile and the energy of this antibonding orbital is small and therefore it would not lower the energy of stabilisation too much, hence the product molecule would still be quite stable. Comparison between benzene and analogues and more MO discussion of boratabenzene can be found in later section.
NBO Charge Analysis

The charge distribution of boratabenzene ranges from -0.588 to 0.588 with green representing positive numbers and red representing negative numbers. With the negative charge on boron atom for the molecule of boratabenzene, this pushes electron density onto the neighbouring carbon atoms, with C4 and C5 having the most negative charges as they are the closest to the boron atom and H10 is negatively charged as it is directly bonded to the boron atom too. This spreading of electron density is expected within the ring as all carbon atoms are more electronegative when compared to boron, therefore the carbon atoms would withdraw electrons from boron atom and leaving the boron atom slightly positively charged.
As shown in the natural bonding orbital analysis, all the C-C and B-C bonds are shown to have sp2 characters to them with C-C bonds closest to the boron atom having bigger contribution towards the bond from s orbitals (s - 38%) and the furthest C-C bonds away from boron atom have the lowest s orbital contribution (s - 35%) towards the bond itself. This is caused by the symmetry of the molecule where the charges are mirror images for all atoms with the plane of symmetry through the boron atom. The C-H bonds are all sp3 hybridised and the boron atom in B-H bond is shown to be sp2 hybridised, further showing that it is part of the delocalised ring as it is sp2 hybridised instead of sp3 hybridised. Further comparison of NBO charge distribution between analogues can be found in later section.
Summary of Natural Population Analysis:

                                       Natural Population
                Natural  -----------------------------------------------
    Atom  No    Charge         Core      Valence    Rydberg      Total
 -----------------------------------------------------------------------
      C    1   -0.25033      1.99910     4.23710    0.01413     6.25033
      C    2   -0.34002      1.99907     4.32711    0.01384     6.34002
      C    3   -0.25032      1.99910     4.23709    0.01413     6.25032
      C    4   -0.58804      1.99901     4.57725    0.01178     6.58804
      C    5   -0.58803      1.99901     4.57724    0.01178     6.58803
      H    6    0.17899      0.00000     0.81839    0.00263     0.82101
      H    7    0.18574      0.00000     0.81227    0.00199     0.81426
      H    8    0.17899      0.00000     0.81839    0.00263     0.82101
      H    9    0.18385      0.00000     0.81397    0.00218     0.81615
      H   10   -0.09649      0.00000     1.09595    0.00054     1.09649
      H   11    0.18385      0.00000     0.81397    0.00218     0.81615
      B   12    0.20182      1.99906     2.78752    0.01160     4.79818
 =======================================================================
   * Total *   -1.00000     11.99436    29.91623    0.08941    42.00000
| Bond | Coefficient | Hybridisation |
|---|---|---|
| C1-C5 | C(51%) C(49%) | s(38%) p(62%) |
| C3-C4 | C(51%) C(49%) | s(38%) p(62%) |
| C1-C2 | C(50%) C(50%) | s(36%) p(64%) |
| C2-C3 | C(50%) C(50%) | s(35%) p(65%) |
| B12-C4 | B(33%) C(67%) | s(33%) p(67%) |
| B12-C5 | B(33%) C(67%) | s(33%) p(67%) |
| C-H | C(60%) H(40%) | s(25%) p(75%) |
| B-H | B(45%) H(55%) | s(33%) p(67%) |
Pyridinium
Optimisation
The optimisation calculation for pyridinium was submitted to departmental cluster and the D-space link can be found here: DOI:10042/21797 .
This optimisation was performed using method B3LYP with basis set 6-31G(d,p). The optimised bond lengths are the following: N-H = 1.017Å, N-C = 1.352Å, C-C = 1.383Å & 1.399Å and C-H = 1.084Å. This molecule is aromatic as the lone pair of nitrogen count as two π electrons, combining with the remaining 4 π electrons from the C-C bonds, it obeys the Huckel rule and hence it is aromatic. The C-C bonds closest to the nitrogen atom within the ring is shown to be shorted than the C-C bonds further away from nitrogen atom in the ring only when second decimal place is considered. Taking into account of errors present in these calculations, this difference is very small and it is not significant enough to prove there is a difference in the C-C bond length.


| File Type | .log |
| Calculation Type | FOPT |
| Calculation Method | RB3LYP |
| Basis Set | 6-31G(d,p) |
| Final Energy | -248.66806092 a.u. |
| Gradient | 0.00000206 a.u. |
| Dipole Moment | 1.8723 Debye |
| Point Group | C1 |
         Item               Value     Threshold  Converged?
 Maximum Force            0.000004     0.000015     YES
 RMS     Force            0.000001     0.000010     YES
 Maximum Displacement     0.000009     0.000060     YES
 RMS     Displacement     0.000003     0.000040     YES
 Predicted change in Energy=-9.673370D-11
 Optimization completed.
    -- Stationary point found.
The table above is obtained from the .LOG file of the optimisation of pyridinium molecule.
Frequency Analysis
The frequency analysis calculation was submitted to departmental cluster and the D-space link can be found here: DOI:10042/21797 .
| File Type | .log |
| Calculation Type | FREQ |
| Calculation Method | RB3LYP |
| Basis Set | 6-31G(d,p) |
| Final Energy | -248.66806092 a.u. |
| Gradient | 0.00000206 a.u. |
| Dipole Moment | 1.8723 Debye |
| Point Group | C1 |

Low frequencies ---   -9.3858   -2.9630   -0.0012   -0.0009    0.0009    0.8916
Low frequencies ---  391.9002  404.3427  620.1995
The low frequencies data above is obtained from .LOG file of the frequency analysis of the optimised pyridinium structure.
With 30 modes of vibrational frequencies, there are only 19 peaks observed in the IR spectrum of pyridinium; this is because some of the mode are IR inactive as they have intensities of zero shown in the table below and therefore they can not be seen in the spectrum. Some of the peaks are very weak in intensities, they can be barely spotted in the spectrum as intensities of some peaks are over 100, the problem of scaling causes these low intensity peak hard to be observed and they can only be picked out by computer program.
| Mode | Frquency | Intensity | Mode | Frequency | Intensity | Mode | Frequency | Intensity |
|---|---|---|---|---|---|---|---|---|
| 1 | 391 | 1 | 11 | 1022 | 4 | 21 | 1523 | 21 |
| 2 | 404 | 0 | 12 | 1048 | 0 | 22 | 1580 | 48 |
| 3 | 620 | 0 | 13 | 1052 | 0 | 23 | 1657 | 32 |
| 4 | 645 | 0 | 14 | 1082 | 3 | 24 | 1677 | 34 |
| 5 | 676 | 90 | 15 | 1087 | 4 | 25 | 3223 | 0 |
| 6 | 747 | 82 | 16 | 1199 | 3 | 26 | 3240 | 1 |
| 7 | 854 | 11 | 17 | 1229 | 2 | 27 | 3242 | 11 |
| 8 | 882 | 0 | 18 | 1300 | 3 | 28 | 3252 | 20 |
| 9 | 991 | 2 | 19 | 1374 | 11 | 29 | 3254 | 0 |
| 10 | 1006 | 0 | 20 | 1416 | 3 | 30 | 3570 | 158 |
MO Analysis
The MO analysis calculation for pyridinium was submitted to departmental cluster and the D-space link can be found here: DOI:10042/21799 .
The energy of HOMO is -0.47886 a.u. and the energy of LUMO is -0.25841 a.u., this gap is considerably smaller than the HOMO-LUMO gap observed in benzene. This small difference in the HOMO and LUMO energy allows this pyridinium molecule to be more reactive. The energy required for an electron to occupy the LUMO is low and the antibonding character of LUMO is not high, therefore for an addition of electron into LUMO is quite facile. Comparison between benzene and analogues and more MO discussion of pyridinium can be found in later section.
NBO Charge Analysis

The charge distribution of pyridinium ranges from -0.483 to 0.483 with green representing positive numbers and red representing negative numbers. From the natural population analysis below, it shows that nitrogen atom has the most negative charge out of all the atoms; this is because nitrogen is the most electronegative element in the periodic table, therefore it would withdraw electron density from other neighbouring atoms towards itself as it is more electronegative than carbon atoms and hence the two neighbouring carbon atoms (C1 and C5) have positive charges whereas other carbon atoms have negative charges in the ring. The hydrogen atom (H11) directly bonded to the nitrogen has the highest positive charge as nitrogen atom withdraw the electron density on it and hence making the charge to be more positive.
All the orbitals of the C atoms are sp2 hybridised and for each C-C bonds, the contribution from each carbon atom is 50%; this shows even contribution and the C-C bonds are all the same rather than having the distinction of C-C and C=C bonds because of delocalisation of the electrons in the ring, generating an aromatic ring system. For N-H bonds, nitrogen has higher contribution towards the bond with sp3 hybridised orbitals as expected due to more electron density present and hydrogen contribute to the bond with its s orbital. This theory applies to C-H bond as well where C has a higher contribution to the bond, but instead of sp3 orbital, it is contributing to the bond with orbital with sp2 characteristics. Further comparison of NBO charge distribution between analogues can be found in later section.
Summary of Natural Population Analysis:

                                       Natural Population
                Natural  -----------------------------------------------
    Atom  No    Charge         Core      Valence    Rydberg      Total
 -----------------------------------------------------------------------
      C    1    0.07102      1.99918     3.91065    0.01916     5.92898
      C    2   -0.24106      1.99912     4.22862    0.01331     6.24106
      C    3   -0.12241      1.99913     4.10941    0.01386     6.12241
      C    4   -0.24106      1.99912     4.22862    0.01331     6.24106
      C    5    0.07102      1.99918     3.91065    0.01916     5.92898
      H    6    0.28493      0.00000     0.71397    0.00110     0.71507
      H    7    0.29720      0.00000     0.70177    0.00103     0.70280
      H    8    0.29169      0.00000     0.70718    0.00113     0.70831
      H    9    0.29720      0.00000     0.70177    0.00103     0.70280
      H   10    0.28493      0.00000     0.71397    0.00110     0.71507
      H   11    0.48278      0.00000     0.51476    0.00246     0.51722
      N   12   -0.47623      1.99937     5.46757    0.00929     7.47623
 =======================================================================
   * Total *    1.00000     11.99510    29.90895    0.09595    42.00000
| Bond | Coefficient | Hybridisation |
|---|---|---|
| C1-C2 | C(50%) C(50%) | s(39%) p(61%) |
| C2-C3 | C(50%) C(50%) | s(35%) p(65%) |
| C3-C4 | C(50%) C(50%) | s(34%) p(66%) |
| C4-C5 | C(50%) C(50%) | s(34%) p(66%) |
| N12-C1 | N(63%) C(37%) | s(37%) p(63%) |
| N12-C5 | N(63%) C(37%) | s(37%) p(63%) |
| N-H | N(75%) H(25%) | s(27%) p(73%) |
| C-H | C(62%) H(38%) | s(33%) p(67%) |
Borazine
Optimisation
The optimisation calculation for borazine was submitted to departmental cluster and the D-space link can be found here: DOI:10042/21792 .
This optimisation was performed using method B3LYP with basis set 6-31G(d,p). The optimised bond lengths are the following: B-N = 1.436Å, N-H = 1.012Å and B-H = 1.193Å. Borazine is the closest analogue to benzene out of all the ring molecules we have investigated above. Due to the presence of lone pairs of electrons from nitrogen, they can be delocalised across the structure of the molecule and with the presence of symmetry in the molecule, this causes the bonds to be equivalent rather than having any distortion in bond lengths which are observed in pyridinium and boratabenzene.


| File Type | .log |
| Calculation Type | FOPT |
| Calculation Method | RB3LYP |
| Basis Set | 6-31G(d,p) |
| Final Energy | -242.61450411 a.u. |
| Gradient | 0.00007068 a.u. |
| Dipole Moment | 0.0007 Debye |
| Point Group | C1 |
        Item               Value     Threshold  Converged?
 Maximum Force            0.000165     0.000450     YES
 RMS     Force            0.000044     0.000300     YES
 Maximum Displacement     0.000798     0.001800     YES
 RMS     Displacement     0.000266     0.001200     YES
 Predicted change in Energy=-2.148067D-07
 Optimization completed.
    -- Stationary point found.
The table above was obtained from the .LOG file of the optimisation of borazine. The calculation has been converged as shown by the table above.
Frequency Analysis
The frequency analysis calculation was submitted to departmental cluster and the D-space link can be found here: DOI:10042/21793 . The same method and basis set as optimisation were used for this calculation.
| File Type | .log |
| Calculation Type | FREQ |
| Calculation Method | RB3LYP |
| Basis Set | 6-31G(d,p) |
| Final Energy | -242.61451237 a.u. |
| Gradient | 0.00000331 a.u. |
| Dipole Moment | 0.0001 Debye |
| Point Group | C1 |

Low frequencies ---   -4.7651   -0.0004    0.0004    0.0009    2.7073    7.2370
Low frequencies ---  309.3009  309.4504  465.3007
The low frequencies data above is obtained from .LOG file of the frequency analysis of the optimised borazine structure.
There are 30 modes of vibrational frequency and only 7 peaks are observed in the IR spectrum, meaning only a few modes are IR active. The 7 IR active modes are 3, 6, 15, 21, 22, 23, 24, 25, 26, 29 and 30. There are 4 sets of degenerate modes: 21 and 22, 23 and 24, 25 and 26 and 29 and 30. They all have the same frequency and the intensity are within +/- 1 of each other and therefore only one peak generated instead two as they overlap each other on the spectrum.
| Mode | Frquency | Intensity | Mode | Frequency | Intensity | Mode | Frequency | Intensity |
|---|---|---|---|---|---|---|---|---|
| 1 | 309 | 0 | 11 | 941 | 0 | 21 | 1418 | 50 |
| 2 | 309 | 0 | 12 | 953 | 0 | 22 | 1418 | 50 |
| 3 | 465 | 26 | 13 | 953 | 0 | 23 | 1488 | 462 |
| 4 | 536 | 0 | 14 | 960 | 0 | 24 | 1488 | 461 |
| 5 | 536 | 0 | 15 | 996 | 367 | 25 | 2657 | 302 |
| 6 | 745 | 61 | 16 | 1063 | 0 | 26 | 2657 | 302 |
| 7 | 782 | 0 | 17 | 1095 | 0 | 27 | 2669 | 0 |
| 8 | 782 | 0 | 18 | 1095 | 0 | 28 | 3620 | 0 |
| 9 | 865 | 0 | 19 | 1248 | 0 | 29 | 3621 | 26 |
| 10 | 942 | 0 | 20 | 1354 | 0 | 30 | 3621 | 26 |
MO Analysis
The MO analysis calculation for borazine was submitted to departmental cluster and the D-space link can be found here: DOI:10042/21795 .
The degeneracy of orbitals are present in the MO of borazine and the MO energies of borazine are very similar to ones of benzene. The energy of HOMO is -0.27584 a.u. and the energy of LUMO is 0.02371 a.u.. This gap is very similar to the HOMO-LUMO gap of benzene and therefore one would assume that their reactivity is very similar, but this is not true. The reasoning to this, comparison between benzene and analogues and more MO discussion of borazine can be found in later section.
NBO Charge Analysis

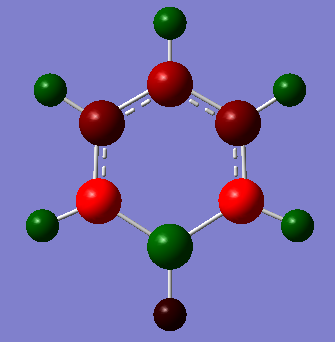
The charge distribution of borazine ranges from -1.094 to 1.094 with green representing positive numbers and red representing negative numbers. The most negative charge is on the nitrogen atoms in the ring and the most positive charge is on the boron atoms, this is expected as nitrogen is more electronegative than boron, therefore it would withdraw electron density from boron and the hydrogen that it is bonded and hence giving both boron and hydrogen relative positive charges. The hydrogen bonded to boron atoms have slight negative charge nearing neutral as it holds onto its electron density tightly and it is more negative relative to boron atom.
For both N-B and N-H bond, nitrogen has higher contribution towards each bond. The contributing orbital for N-B bond has sp2 character, whereas for N-H bond, the contributing orbital from nitrogen has sp3 and this is because energy of hydrogen s orbital has a closer energy match to sp3 hybridised orbital, therefore it would have a better overlap and hence giving greater stabilisation energy. Boron has a higher contribution towards B-H bond and the contributing orbital is sp2 hybridised. Further comparison of NBO charge distribution between analogues can be found in later section.
Summary of Natural Population Analysis:

                                       Natural Population
                Natural  -----------------------------------------------
    Atom  No    Charge         Core      Valence    Rydberg      Total
 -----------------------------------------------------------------------
      N    1   -1.09382      1.99928     6.09113    0.00340     8.09382
      H    2    0.43210      0.00000     0.56664    0.00126     0.56790
      N    3   -1.09382      1.99928     6.09113    0.00340     8.09382
      H    4    0.43210      0.00000     0.56664    0.00126     0.56790
      N    5   -1.09382      1.99928     6.09113    0.00340     8.09382
      H    6    0.43209      0.00000     0.56666    0.00126     0.56791
      B    7    0.73190      1.99914     2.25862    0.01033     4.26810
      H    8   -0.07019      0.00000     1.06993    0.00026     1.07019
      B    9    0.73194      1.99914     2.25859    0.01033     4.26806
      H   10   -0.07019      0.00000     1.06993    0.00026     1.07019
      B   11    0.73189      1.99914     2.25863    0.01033     4.26811
      H   12   -0.07019      0.00000     1.06993    0.00026     1.07019
 =======================================================================
   * Total *    0.00000     11.99528    29.95897    0.04575    42.00000
| Bond | Coefficient | Hybridisation |
|---|---|---|
| N-B | N(76%) B(24%) | s(39%) p(61%) |
| N-H | N(72%) H(28%) | s(23%) p(77%) |
| B-H | B(46%) H(54%) | s(38%) p(62%) |
Comparison between benzene and its analogues
After the optimisation of each molecule with the same method and basis set, all atoms in each molecule has remained within the plane of the ring structure, meaning they are all aromatic molecules and there are π electron density above and below the plane of these molecules. For the C-C bond lengths, there are variations in the values across the series of molecules discussed above. In reference to benzene C-C bond length, boratabenzene has longer C-C bonds. This is because of the orbital size mismatch between the boron and carbon, there is a poorer overlap of the orbitals and this causes the lengthening of the bonds as it is now a weaker bond. The exchange of a carbon atom for a boron atom causes distortion to the ring in terms of bond lengths and reduce in symmetry of the molecule, this leads to degeneracy of orbitals being removed. This applies to pyridinium as well where the substitution of one carbon atom with nitrogen leads to degeneracy being removed from the molecule and lowering of symmetry of the molecule.
For pyridinium, the bond lengths (1.383Å & 1.399Å) are very similar to benzene C-C bond length (1.395Å), but one of the C-C bond length of pyridinium is shorted by 0.01Å. The difference in bond length can be caused by the presence of nitrogen atom in the ring, where electron density on the nitrogen is being pushed onto the neighbouring carbon atoms, leading to more electron density on C-C bond, so better overlap of orbital is allowed and hence stronger and shorted C-C bond length. But this difference in bond length is not large as there is 10% error in calculations done by GaussView, so this difference is not significant and can be dismissed.
Pyridinium and borazine have the same bond length for N-H bond, this suggests that they are under the same hybridisation for nitrogen atom and hydrogen atom and this is proven to be correct by the natural bond orbital analysis, where the nitrogen atom on both molecule are sp2 hybridised and 100% s orbital contribution from the hydrogen atom towards the bond. As for boratabenzene and borazine, the B-H bond lengths are different to each other by 0.02Å, this is not a large difference taking into account of 10% error in calculations but a potential reason to explain this difference can be that in boratabenzene, the electron density is mainly on boron and carbon atoms, so there is less electron density in between boron and hydrogen, therefore the overlap of electron density is poor and hence the bond lengthen as the bond is slightly weaker. The boron atoms have the same hybridisation as each other which is sp2 hybridised, this supports the fact that the two bond lengths are similar.
The aromaticity of benzene analogues are lower than benzene, this is because all the analogues are heteroaromatic rings. The introduction of an heteroatom into an aromatic system, i.e. benzene, causes the electron distribution to be skewed/distored, this lowers the π symmetry of the molecule, leading to the reactivity of the heteroaromatic molecules to increase as they lower their aromaticity and hence in theory, the benzene analogues should be much more reactive compare to benzene itself.
Because of the introduction of heteroatom in the ring, the symmetry of the ring is lowered and this leads to more peaks being observed in the IR spectrum. Benzene is a very symmetrical molecule, many of its mode of vibrations are IR inactive as the motion or stretch doesn't generate a change in dipole moment in the molecule and therefore it can not be observed by IR spectroscopy and their intensities is zero. For two of the three analogues under analysis, boratabenzene and pyridinium, they have displayed more peaks in their IR spectrum than the IR spectrum of benzene. With boratbenzene displaying 20 peaks and pyridinium displaying 19 peaks, there are many modes of vibrational frequency which are active in these two molecules due to the lowering of symmetry within the molecules as they have lost one C5 rotational axis and two C2 rotational axes. The lose of symmetry allows dipole moments to be generated by motions of the atoms or stretching of the bonds, this causes the modes of vibration to be IR active and they can be observed in the IR spectrum. Borazine has a very similar IR spectrum as benzene, both IR spectrum have 7 peaks observed, this suggests that the level of aromaticity for both molecule is very similar, but the intensities of peaks for borazine is much higher than the peaks in the IR spectrum of benzene, this is because borazine itself already has a dipole moment due to the difference in electronegativity between boron and carbon and therefore the intensities of any IR active modes would be amplified, hence higher intensities for each individual peaks in IR of borazine.
NBO charge distribution comparison
| Benzene | Boratabenzene | Pyridinium | Borazine | |
| Charge no. and distribution |  |
 |
 |

|
| Charge range | -0.239 - 0.239 | -0.588 - 0.588 | -0.483 - 0.483 | -1.094 - 1.094 |
| Hydrogen | 0.239 | 0.096, 0.179, 0.184, 0.186 | 0.285, 0.292, 0.297, 0.483 | 0.432, -0.070 |
| Boron | - | 0.202 | - | 0.732 |
| Carbon | -0.239 | -0.250, -0.340 | 0.071, -0.122, -0.241 | - |
| Nitrogen | - | - | -0.476 | -1.094 |
There are big differences in the range of charges between the four molecules under analysis. Benzene has the smallest charge range compare to the others, this is because there is no heteroatoms within the ring itself and the molecule is completely symmetric, therefore there is no dipole moment established within the molecule. The electronegativities of hydrogen and carbon are very similar, the charge numbers on the hydrogen atoms and carbon atoms are the same except for the difference in the sign of the values and all the C-H bond dipole moments are the same. Borazine have the biggest charge range due to the large difference in electronegativity between boron and nitrogen. Nitrogen is much more electronegative than boron, it would withdraw electron density away from neighbouring boron atoms, causing a positive charge to be established at boron centre and negative charge established at nitrogen centre. There are different charges on different hydrogen atoms. For the hydrogen atoms bonded to boron atoms, they have slight negative charge numbers on them as the dipole moment is established in the B-H bond, whereas the hydrogen bonded to nitrogen have positive charge number due to the electronegative nitrogen withdrawing electron density away from hydrogen atom and therefore creating a dipole moment within the N-H bond. This dipole moment within the N-H bond of borazine is the largest out of all of the observed dipole moment in bonds of other analogues, this is because borazine itself has a dipole moment already and this staggering of dipole moment effect causes the charge numbers to be higher and therefore larger charge range.
Pyridinium and boratabenzene are very similar in terms of charge range but in terms of charge numbers, they are quite opposite. With pyridinium, the most negative charge is found on the heteroatom, i.e. nitrogen, whereas boratabenzene, the heteroatom, i.e. boron, has a positive charge. This difference is caused by the difference in electronegativity between nitrogen and boron, this in term affects the charge distribution around the ring. The carbon atoms adjacent to the nitrogen atom in pyridinium molecule have positive charges due to nitrogen withdrawing electron density away from them and the hydrogen atoms around the ring have higher positive charges when compared to the hydrogen atoms in boratabenzene due to the electron withdrawing effect of nitrogen. For boratabenzene, the adjacent carbon atoms to boron have negative charges as carbon is more electronegative than boron, therefore it withdraws electron density away from boron atom and hydrogen atoms, so all the carbon atoms within this molecule have negative charges and hence generating dipole moment for the molecule.
MO comparison
| MO | Benzene | Boratabenzene | Pyridinium | Borazine |
| 17 |  |
 |

| |
| Energy (a.u.) | -0.35998 | -0.13210 | -0.64062 | -0.36136 |
| 20 |  |
 |

| |
| Energy (a.u.) | -0.24692 | -0.03492 | -0.50847 | -0.27585 |
| 21 (HOMO) |  |
 |

| |
| Energy (a.u.) | -0.24691 | 0.01095 | -0.47886 | -0.27584 |
| 22 (LUMO) Energy (a.u.) | 0.00267 | 0.21472 | -0.25841 | 0.02371 |
The three occupied molecular orbitals chosen above are the π orbitals of benzene and its three analogues. The MO surfaces of each orbital shown above have similar shape and distribution. The electron distribution of MOs of benzene and borazine are very similar, this is because of the high symmetry level that both molecule possesses and the distribution of the π electron density is not distorted like what it is being observed in pyridinium and boratabenzene. Due to these similarities between the two, they suggest that the aromaticity of benzene and borazine are very similar as their MO energies are quite close to each other but their reactivities are very different. Borazine would undergo electrophilic and nucleophilic additions due to the nitrogen acting as nucleophilic centre and boron acting as electrophilic centre, whereas benzene would only undergo electrophilic aromatic substitution due to the stabilisation the delocalised ring system provides.
For MO 20 and 21 of borazine, it shows that the electron density is more concentrated on the nitrogen but for benzene, both MO's electron density is evenly distributed, this difference is due to the difference in electronegativity, where nitrogen withdraw more electron density towards itself and therefore electron density is concentrated on nitrogen atoms. In general, the MO energies of borazine are lower than benzene due to the participation of nitrogen orbital which lowers the energy molecule orbitals and therefore the overall energies of MO are lower than benzene MO energies.
MO 17 is the all bonding π orbital and it shows that for benzene and borazine, the electron distribution is evenly distributed, but for pyridinium and boratabenzen, the electron density is skewed. For pyridinium, the electron density is skewed towards the nitrogen atom due to its high electronegativity, whereas boratabenzene has electron density skewed towards the carbon atoms in the ring due to the higher electronegativity of carbon. Pyridinium has the most negative energy for its MOs and this is because nitrogen lone pair is low in energy due to its high electtonegativity, therefore when it overlaps with carbon px orbitals, it would lower the newly formed bonding MO even more and hence it is low in energy. Boratabenzene has the highest energy for this MO and the other two MOs, this is because both carbon and boron orbitals are high up in energy as they are not very electronegative, the overlap between the two would be good overlap and the energy of stabilisation generated would be good.
The electron distributions for MO 20 and 21 of pyridinium and boratabenzene are the reverse of each other. The electron density of MO 21 of pyridinium is similar to MO 20 of boratabenzene and the electron density of MO 20 of boratabenzene is similar to MO 21 of pyridinium. This occurs because for the MO 20, the electron density is on nitrogen atom, nitrogen atom in general have lower energy due to its electronegativity and therefore when the orbital of nitrogen is involved in this overlap, it lowers the overall energy of the MO more than the boron would in boratabenzene as boron is less electronegative, hence higher in energy, so with the same electron density pattern, the energy for boratabenzne is higher (i.e. positive energy value) and it is the HOMO of the molecule. For MO 21 of pyridinium, the nitrogen orbitals are not involved, therefore it does not have the nitrogen orbital to lower the energy of the newly formed bonding MO, it has a higher energy than MO 20 and hence it is the HOMO of pyridinium.
With the substitution of carbon atom with heteroatoms, the degeneracy of molecular orbitals are removed due to mismatch of LCAO energy levels and the decrease in symmetry in the molecule. This effect is very prominent in pyridinium and boratbenzene, where the symmetry has decrease a lot as they have lost four rotational axes and two planes of symmetry. Borazine has retained some of the symmetry and so the degeneracy of orbitals is still present, which is the same as benzene in terms of which MOs are degenerate and for both benzene and borazine, MO 20 and MO 21 are degenerate orbitals. Through these substitutions, the MO energies have changed and degeneracy has removed. Pyridinium has lower MO energies then benzene in general, so effectively, the introduction of nitrogen atom into the ring lowered the MO energies due to the nitrogen atom having higher electronegativity and hence lower in energy. For boratabenzene, it is the opposite of pyridinium as boron is less electronegative than carbon and therefore the MO energies become more positive than the benzene MO energies. Borazine has similar MO energies to benzene, this because boron orbitals are quite positive in energy and nitrogen orbitals are quite negative in energy, this does not give a good orbital overlap as the energy difference is large, therefore the newly formed MOs would not have high energy of stabilisation and so it would have energy values in the same area as benzene MO energy values.
Reactivity
The HOMO-LUMO energy gap for pyridinium and boratabenzene is very similar, this suggests that they both should have the similar reactivity and they both should be more reactive than benzene and borazine as their gaps are smaller than the gaps of benzene and borazine, electrons can be easily added into the LUMO without changing the energy of stabilisation by a large amount where it destabilise the molecule and therefore they would be more susceptible for attack by electrophiles and nucleophiles. The HOMO-LUMO gaps of benzene and borazine are very similar as they are isoelectronic and isostructural with each other, so one might automatically assume that their reactivity would be similar/the same but this is not true. When considering reactivity, the charge distribution of the molecule has to be taken into account as this affects how each individual atom of the molecule might be more susceptible for attack by nucleophile/electrophile. Benzene only undergoes electrophilic aromatic substitutions as additions would cause the energy of stabilisation to descrease due to the electrons being added into antibonding orbitals, therefore benzene is not very reactive. In the case of borazine, due to the uneven charge distribution, it is susceptible to nucleophilic and electrophilic attacks. With the boron atoms as electrophilic centres, nucleophilic addition can occur at boron and nitrogen atoms act as nucleophilic centres where electrophilic addition can occur. These availabilities of different reactions means that borazine is more reactive than benzene even though they have similar HOMO-LUMO energy gap.
References
- ↑ P. Hunt, http://www.huntresearchgroup.org.uk/teaching/year3_lab_start.html. Last date accessed:23/11/2012.
- ↑ W. M. Haynes, CRC Handboook of Chemistry and Physics, 2012-2013, 93th ed., p.9-48.
- ↑ G. Leroy, M. Sana and C.Wilante, Theor. Chim. Acta., 1993, 85, 156.
- ↑ J. Clayden, N. Greeves and S. Warren, Organic Chemistry, 2012, 2nd ed..
- ↑ 5.0 5.1 F. H. Allen, O. kennard and D. G. Watson, J. Chem. Soc. Perkin Trans., 1987, II, S7-S8.