Rep:Mod:afgarms216
This wiki demonstrates basic functionality within the quantum chemical software package Gaussian and some applications of its results.
NH3 Molecule
First, a molecule of NH3 was constructed an an optimisation performed. The important information from the results summary table is shown below. Figure 1 shows the optimised molecule in 3D space.
Basis set : 6-31G(d,p)
Final Energy (E(RB3LYP)) : -56.55776873 a.u.
RMS gradient (norm?) : 0.00000485 a.u.
Point group : C3hSome geometric information was also collected:
Bond Angle : 105.741 °
To show that the optimisation has been performed correctly, a table from the .log file generated by the software is shown here. It shows the convergence of the molecular parameters to the lowest energy situation- the minimum stationary point on the molecule's potential energy surface has been found by the software. In addition to checking this table, the progress of the optimisation was verified by checking the energies of the conformers generated up to the final optimised version, making sure that they decreased to a final minimum value.
Item               Value     Threshold  Converged?
 Maximum Force            0.000004     0.000450     YES
 RMS     Force            0.000004     0.000300     YES
 Maximum Displacement     0.000072     0.001800     YES
 RMS     Displacement     0.000035     0.001200     YES
 Predicted change in Energy=-5.986279D-10
 Optimization completed.
    -- Stationary point found.
                           ----------------------------
                           !   Optimized Parameters   !
                           ! (Angstroms and Degrees)  !
 --------------------------                            --------------------------
 ! Name  Definition              Value          Derivative Info.                !
 --------------------------------------------------------------------------------
 ! R1    R(1,2)                  1.018          -DE/DX =    0.0                 !
 ! R2    R(1,3)                  1.018          -DE/DX =    0.0                 !
 ! R3    R(1,4)                  1.018          -DE/DX =    0.0                 !
 ! A1    A(2,1,3)              105.7412         -DE/DX =    0.0                 !
 ! A2    A(2,1,4)              105.7412         -DE/DX =    0.0                 !
 ! A3    A(3,1,4)              105.7412         -DE/DX =    0.0                 !
 ! D1    D(2,1,4,3)           -111.8571         -DE/DX =    0.0                 !
 --------------------------------------------------------------------------------
 GradGradGradGradGradGradGradGradGradGradGradGradGradGradGradGradGradGrad
Figure 1: Optimised Ammonia Molecule |
From the general 3N-6 rule 6 modes of vibration are expected (this is a non-linear molecule with N=4). The calculated modes are shown in Figure 2. Modes 2 and 3 and modes 5 and 6 are degenerate pairs with equal frequency. Modes 1, 2 and 3 are bending modes and modes 4, 5 and 6 are stretching modes. Mode 4 is highly symmetric, causing no change in dipole moment. Mode 1 is known as the umbrella stretching mode due to its motion resembling the opening of an umbrella. In an IR spectrum of gaseous ammonia it would be expected that all modes would appear expect mode 4 as there is no change in dipole moment. Due to the degeneracy of bands 2 and 3 and 5 and 6, 3 bands should appear. This agrees with the spectrum presented by the U.S. National Institute of Standards(1).
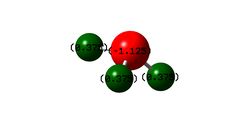
Figure 3 shows the calculated charge distribution in the NH3 molecule. This agrees with the expectation that the nitrogen atom should have a negative charge three times the magnitude of each of the positive charges on the hydrogen atoms; nitrogen is much more electronegative than hydrogen and so pulls the negative electron cloud towards itself, giving itself a negative charge. The overall neutral charge on the molecule means that the nitrogen should treble the charge magnitude of each identical hydrogen and of opposite sign so the sum is zero.
 |
 |
The full optimisation file can be found here.
H2 Molecule
The same optimisation process was then performed for H2 and the calculated values are shown below, as they were above. The optimised molecule is shown in Figure 4
Basis set : 6-31G(d,p)
Final Energy (E(RB3LYP)) : -1.17853936 a.u.
RMS gradient (norm?) : 0.00000222 a.u.
Point group : Dinfinity h
Bond Length : 0.74280 Å
Bond Angle : 180.000 °The bond length here agrees with the commonly accepted bond length for hydrogen of 74 pm. It also agrees with the bond dissociation energy of hydrogen which is usually quoted as 436 kJ/mol(2).
Item               Value     Threshold  Converged?
 Maximum Force            0.000004     0.000450     YES
 RMS     Force            0.000004     0.000300     YES
 Maximum Displacement     0.000005     0.001800     YES
 RMS     Displacement     0.000007     0.001200     YES
 Predicted change in Energy=-1.939322D-11
 Optimization completed.
    -- Stationary point found.
                           ----------------------------
                           !   Optimized Parameters   !
                           ! (Angstroms and Degrees)  !
 --------------------------                            --------------------------
 ! Name  Definition              Value          Derivative Info.                !
 --------------------------------------------------------------------------------
 ! R1    R(1,2)                  0.7428         -DE/DX =    0.0                 !
 --------------------------------------------------------------------------------
 GradGradGradGradGradGradGradGradGradGradGradGradGradGradGradGradGradGrad
Figure 4: Optimised Hydrogen Molecule |
A table of the vibrational modes (just one for H2) is shown in Figure 5.

The full optimisation file can be found here.
N2 Molecule
Again, the process was performed but this time for nitrogen, N2. The final molecule is shown in Figure 6.
Basis set : 6-31G(d,p)
Final Energy (E(RB3LYP)) : -109.52412868 a.u.
RMS gradient (norm?) : 0.00000458 a.u.
Point group : Dinfinity h
Bond Length : 1.10549 Å
Bond Angle : 180.000 °These are similar to the widely accepted values of 945 kJ/mol as bond dissociation energy and 110 pm as the bond length(2).
  Item               Value     Threshold  Converged?
 Maximum Force            0.000008     0.000450     YES
 RMS     Force            0.000008     0.000300     YES
 Maximum Displacement     0.000002     0.001800     YES
 RMS     Displacement     0.000004     0.001200     YES
 Predicted change in Energy=-1.963077D-11
 Optimization completed.
    -- Stationary point found.
                           ----------------------------
                           !   Optimized Parameters   !
                           ! (Angstroms and Degrees)  !
 --------------------------                            --------------------------
 ! Name  Definition              Value          Derivative Info.                !
 --------------------------------------------------------------------------------
 ! R1    R(1,2)                  1.1055         -DE/DX =    0.0                 !
 --------------------------------------------------------------------------------
 GradGradGradGradGradGradGradGradGradGradGradGradGradGradGradGradGradGrad
Figure 6: Optimised Nitrogen Molecule |
The one vibrational frequency calculated for N2 is shown in Figure 7.

The full optimisation file can be found here.
The Haber Process
The Haber process is the most widely used process in producing Ammonia, commonly used to manufacture fertiliser and other vital chemicals. The general equation is as follows:
N2 + 3H2 → 2NH3
Using the data calculated above, a energy change value for the reaction can be generated.
E(NH3) = -56.55776873 a.u.
2 * E(NH3) = -113.1155375 a.u.
E(H2) = -1.17853936 a.u.
3 * E(H2) = -3.53561808 a.u.
E(N2) = -109.52412868 a.u.
ΔE = 2 * E(NH3) - [E(N2) + 3 * E(H2)] = -0.0557907 a.u. or -146.47849401 kJ/mol
Note that the atomic units of energy (a.u.) referred to here are Hartrees.
This suggests that the NH3 product is more thermodynamically stable than the N2 and H2 starting materials as energy is released when the NH3 is produced.
There is a difference in the calculated and experimental values. This can be explained by two things; firstly, experimentally this reaction is performed under high pressure and temperature which affects the energy of the reaction. Additionally, under real conditions the reacting N2 and H2 molecules are surrounded by other N2 and H2 molecules whereas here the energies of N2 and H2 are calculated in free space, with no conflicting interactions from other molecules. These other interactions would greatly effect the energies of the molecules.
Project: Chlorine Trifluoride, ClF3
An optimisation was performed for Chlorine Trifluoride, ClF3, and the results were as follows:
Basis set : 6-31G(d,p)
Final Energy (E(RB3LYP)) : -759.46531688 a.u.
RMS gradient (norm?) : 0.00002465 a.u.
Point group : C2v
Bond Length : 1.72863 Å (axial) and 1.65143 Å (equatorial)
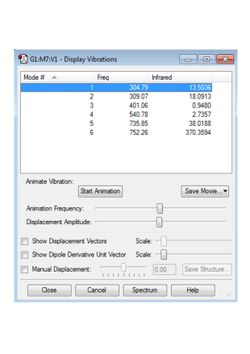
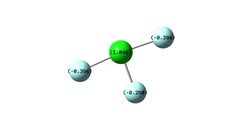
Bond Angle : 87.140 ° and 174.281 °These values compare favourably with those in the literature of 1.598 Å and 1.698 Å(3). It can be seen that the potential energy minimum has been found, by the small magnitude of the RMS gradient in the results above and by the positive sign of all vibrational frequencies, shown in Figure 8. The calculated charge distribution is shown in Figure 9.
 |
 |
The Item table is shown here to show further the extent of optimisation. The final optimisation is shown in Figure 10.
Item               Value     Threshold  Converged?
 Maximum Force            0.000050     0.000450     YES
 RMS     Force            0.000028     0.000300     YES
 Maximum Displacement     0.000185     0.001800     YES
 RMS     Displacement     0.000134     0.001200     YES
 Predicted change in Energy=-1.250221D-08
 Optimization completed.
    -- Stationary point found.
                           ----------------------------
                           !   Optimized Parameters   !
                           ! (Angstroms and Degrees)  !
 --------------------------                            --------------------------
 ! Name  Definition              Value          Derivative Info.                !
 --------------------------------------------------------------------------------
 ! R1    R(1,2)                  1.7286         -DE/DX =    0.0                 !
 ! R2    R(1,3)                  1.6514         -DE/DX =    0.0                 !
 ! R3    R(1,4)                  1.7286         -DE/DX =    0.0                 !
 ! A1    A(2,1,3)               87.1404         -DE/DX =    0.0                 !
 ! A2    A(3,1,4)               87.1404         -DE/DX =    0.0                 !
 ! A3    L(2,1,4,3,-1)         174.2807         -DE/DX =    0.0                 !
 ! A4    L(2,1,4,3,-2)         180.0            -DE/DX =    0.0                 !
 ! D1    D(2,1,3,4)            180.0            -DE/DX =    0.0                 !
 --------------------------------------------------------------------------------
 GradGradGradGradGradGradGradGradGradGradGradGradGradGradGradGradGradGrad
Figure 10: Optimised Chlorine Trifluoride Molecule |
The full optimisation file can be found here.
The program allows for the generation of molecular orbitals; here, some examples are shown and discussed.

The molecular orbital shown in Figure 11 is very low in energy. It can be inferred that it is essentially just the 1s orbital of atomic chlorine. As a result, it is non-bonding, as it doesn't interact with any other atomic orbitals and exists independent of the other atoms. It is completely occupied- this both predicted by the program and intuitive due to how deep in energy it is; the Aufbau principle states that lower energy orbitals are filled before higher energy orbitals.
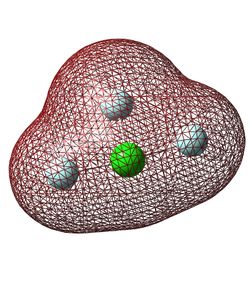
Figure 12 shows the molecular orbital formed by the constructive interaction of the 1s orbitals of all four atoms. This is the lowest energy bonding orbital and the first which contains multiple atomic orbitals. It is fully occupied and is a bonding orbital.
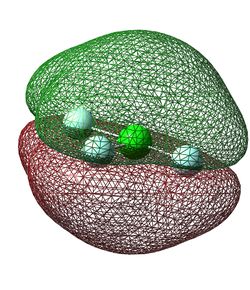
The fifteenth lowest energy molecular orbital (Figure 13) is formed from in-phase 2p orbitals of all four atoms. The particular p orbitals involved are all perpendicular to the plane of the molecule and have the same phase lobes on each side of the plane, creating two larger lobes of opposite phase above and below the plane. This molecular orbital is again completely filled as it is also below the HOMO (Highest Occupied Molecular Orbital) in energy. It is a good bonding orbital due to the good constructive interactions between all of the atomic orbitals.
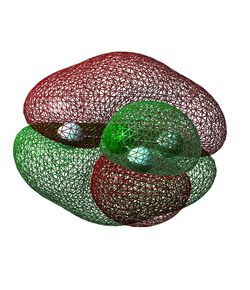
The molecular orbital in Figure 14 is very similar to that in Figure 13 as it involves the same 2p orbitals of all four atoms. However, it is higher in energy due to differences in phase; the lowest energy fluorine atom (in the equatorial position) has its 2p orbital in a different phase to the other three. This creates two large lobes or opposite adjacent to two smaller lobes of opposite phase. This molecular orbital is entirely occupied and it contributes to bonding between the chlorine and the two axial fluorines. As the third fluorine is out of phase, it does not contribute to the bonding between that fluorine and the chlorine.
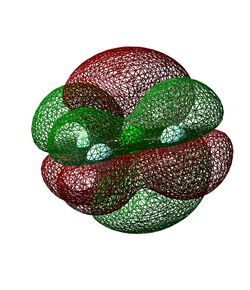
The molecular orbital in Figure 15 is the HOMO - it is the highest energy molecular orbital which contains electrons. The atomic orbitals which contribute to it are again the 2p orbitals, but this time it is the chlorine 2p which is a different phase to the other three. As a result, large lobes of different phase (essentially those of the chlorine 2p atomic orbital) disrupt the smaller lobes created by the overlap of the three 2p fluorine atomic orbitals. It is fully occupied and could be considered non-bonding as it contributes nothing to the bonding between the chlorine and fluorine atoms.
References
(1) http://webbook.nist.gov/cgi/cbook.cgi?ID=C7664417&Type=IR-SPEC&Index=1#Refs accessed 3/3/17
(2) Darwent, B. deB. (January 1970). Bond Dissociation Energies in Simple Molecules (PDF). NSRDS-NBS 31. Washington, DC: U.S. National Bureau of Standards. LCCN 70602101.
(3) Smith, D. F. (1953). "The Microwave Spectrum and Structure of Chlorine Trifluoride". The Journal of Chemical Physics. 21 (4): 609–614. Bibcode:1953JChPh..21..609S. doi:10.1063/1.1698976.
