Rep:Mod:aem416-1
Molecules Section
NH3 Molecule
| Data Type | Value |
|---|---|
| Calculation Method | RB3LYP |
| Basis Set | 6-31G(d,p) |
| E(RB3LYP) | -56.55776873 a.u. |
| RMS Gradient Norm | 0.00000485 a.u. |
| Point Group | C3V |
| N-H Bond | 1.01798 Å |
| H-N-H Angle | 105.741 degrees |
Experimental values put the N-H bond at 1.019 Å and the H-N-H angle at 109.1 degrees[1]. These are very similar to the calculated values.
Item Table
       Item               Value     Threshold  Converged?
 Maximum Force            0.000004     0.000450     YES
 RMS     Force            0.000004     0.000300     YES
 Maximum Displacement     0.000072     0.001800     YES
 RMS     Displacement     0.000035     0.001200     YES
 Predicted change in Energy=-5.986280D-10
 Optimization completed.
    -- Stationary point found.
                           ----------------------------
                           !   Optimized Parameters   !
                           ! (Angstroms and Degrees)  !
 --------------------------                            --------------------------
 ! Name  Definition              Value          Derivative Info.                !
 --------------------------------------------------------------------------------
 ! R1    R(1,2)                  1.018          -DE/DX =    0.0                 !
 ! R2    R(1,3)                  1.018          -DE/DX =    0.0                 !
 ! R3    R(1,4)                  1.018          -DE/DX =    0.0                 !
 ! A1    A(2,1,3)              105.7412         -DE/DX =    0.0                 !
 ! A2    A(2,1,4)              105.7412         -DE/DX =    0.0                 !
 ! A3    A(3,1,4)              105.7412         -DE/DX =    0.0                 !
 ! D1    D(2,1,4,3)           -111.8571         -DE/DX =    0.0                 !
 --------------------------------------------------------------------------------
JMol
NH Molecule |
Optimisation Link
The optimisation file is linked to here
Vibration
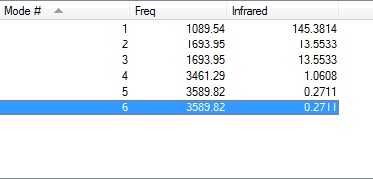
-How many modes do you expect from the 3N-6 rule?
From the 3N-6 rule we expect 6 vibrational modes.
-Which modes are degenerate (ie have the same energy)?
Modes 2 and 3 are degenerate at a frequency of 1693.95 cm-1. Modes 5 and 6 are degenerate at a frequency of 3589.82 cm-1.
-Which modes are "bending" vibrations and which are "bond stretch" vibrations?
Modes 1, 2 and 3 are bending. Modes 4, 5 and 6 are stretching.
-Which mode is highly symmetric?
Mode 4 is highly symmetric.
-One mode is known as the "umbrella" mode, which one is this?
Mode 1 is known as the umbrella mode.
-How many bands would you expect to see in an experimental spectrum of gaseous ammonia?
Since there are 4 distinct vibration frequencies, one would expect to see 4 bands in the gaseous ammonia spectrum, but since the intensities of the modes 4, 5 and 6 are so low then we would only see two bands at around 1089.54 and 1693.95 cm-1.
Charge
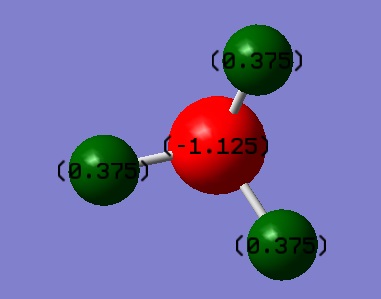 Since N is more electronegative than H we would expect to see N have a negative charge and H a positive one. Our model predicts a charge distribution of N=-1.125 and H=0.375.
N2 Molecule
| Data Type | Value |
|---|---|
| Calculation Method | RB3LYP |
| Basis Set | 6-31G(d,p) |
| E(RB3LYP) | -109.52412868 a.u. |
| RMS Gradient Norm | 0.00000060 a.u. |
| Point Group | D∞h |
| N-N Bond | 1.10550 Å |
| Molecule Shape | Linear |
Experimental data shows the N-N bond to be 1.0975 Å[2], this is very similar to the calculated value.
Item Table
   Item               Value     Threshold  Converged?
 Maximum Force            0.000001     0.000450     YES
 RMS     Force            0.000001     0.000300     YES
 Maximum Displacement     0.000000     0.001800     YES
 RMS     Displacement     0.000000     0.001200     YES
 Predicted change in Energy=-3.401031D-13
 Optimization completed.
    -- Stationary point found.
                           ----------------------------
                           !   Optimized Parameters   !
                           ! (Angstroms and Degrees)  !
 --------------------------                            --------------------------
 ! Name  Definition              Value          Derivative Info.                !
 --------------------------------------------------------------------------------
 ! R1    R(1,2)                  1.1055         -DE/DX =    0.0                 !
 --------------------------------------------------------------------------------
JMol
N Molecule |
Optimisation Link
The optimisation file is linked to here
Vibration
-How many bands would you expect to see in an experimental spectrum of gaseous nitrogen?
None because there is no dipole change in the vibration.
Charge
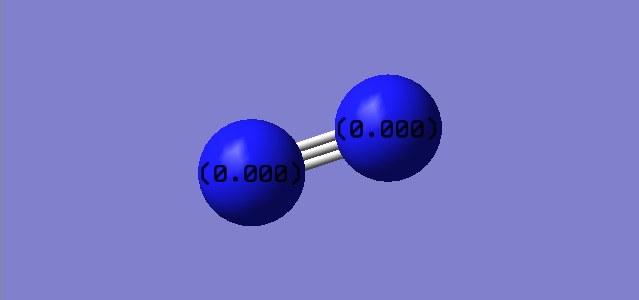 Both N have the same electronegativity so we expect charges to be 0.
H2 Molecule
| Data Type | Value |
|---|---|
| Calculation Method | RB3LYP |
| Basis Set | 6-31G(d,p) |
| E(RB3LYP) | -1.17853936 a.u. |
| RMS Gradient Norm | 0.00000017 a.u. |
| Point Group | D∞h |
| H-H Bond | 0.74279 Å |
| Molecule Shape | Linear |
The experimental data puts the H-H bond at 0.74138 Å[3], very similar to the calculated value.
Item Table
   Item               Value     Threshold  Converged?
 Maximum Force            0.000000     0.000450     YES
 RMS     Force            0.000000     0.000300     YES
 Maximum Displacement     0.000000     0.001800     YES
 RMS     Displacement     0.000001     0.001200     YES
 Predicted change in Energy=-1.184240D-13
 Optimization completed.
    -- Stationary point found.
                           ----------------------------
                           !   Optimized Parameters   !
                           ! (Angstroms and Degrees)  !
 --------------------------                            --------------------------
 ! Name  Definition              Value          Derivative Info.                !
 --------------------------------------------------------------------------------
 ! R1    R(1,2)                  0.7428         -DE/DX =    0.0                 !
 --------------------------------------------------------------------------------
JMol
H Molecule |
Optimisation
The optimisation file is linked to here
Vibration
-How many bands would you expect to see in an experimental spectrum of gaseous hydrogen?
None because there is no dipole change in the vibration.
Charge
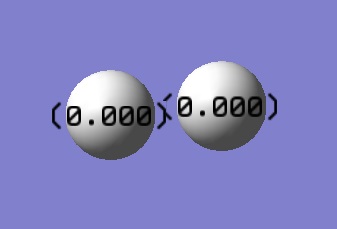 Both H have the same electronegativity so we expect charges to be 0.
Haber-Bosch Reaction
| Data Type | Value |
|---|---|
| E(NH3) | -56.55776873 a.u. |
| 2*E(NH3) | -113.11553746 a.u. |
| E(N2) | -109.52412868 a.u. |
| E(H2) | -1.17853936 a.u. |
| 3*E(H2) | -3.53561808 a.u. |
| ΔE=2*E(NH3)-[E(N2)+3*E(H2)] | -0.055790699999989 a.u. |
| ΔE | -146.4784940081111 kJ/mol |
A mole of ammonia is less stable than a mole of N2, but since two ammonia molecules are produced from one N2 (N2 + 3H2 -> 2NH3) then that offsets the balance and makes the reaction exothermic. Therefore, stability of the combined reagents is lower than that of the product.
Extra Molecules
Cl2 Molecule
| Data Type | Value |
|---|---|
| Calculation Method | RB3LYP |
| Basis Set | 6-31G(d,p) |
| E(RB3LYP) | -920.34987887 a.u. |
| RMS Gradient Norm | 0.00000470 a.u. |
| Point Group | D∞h |
| Cl-Cl Bond | 2.04158 Å |
| Molecule Shape | Linear |
The experimental values for the Cl-Cl bond place it at 1.9875 Å[3]. This value is very close to the theoretical one.
Item Table
       Item               Value     Threshold  Converged?
 Maximum Force            0.000008     0.000450     YES
 RMS     Force            0.000008     0.000300     YES
 Maximum Displacement     0.000023     0.001800     YES
 RMS     Displacement     0.000032     0.001200     YES
 Predicted change in Energy=-1.849058D-10
 Optimization completed.
    -- Stationary point found.
                           ----------------------------
                           !   Optimized Parameters   !
                           ! (Angstroms and Degrees)  !
 --------------------------                            --------------------------
 ! Name  Definition              Value          Derivative Info.                !
 --------------------------------------------------------------------------------
 ! R1    R(1,2)                  2.0416         -DE/DX =    0.0                 !
 --------------------------------------------------------------------------------
JMol
H Molecule |
Optimisation
The optimisation file is linked to here
Vibration
-How many bands would you expect to see in an experimental spectrum of gaseous Chlorine?
None because there is no dipole change in the vibration.
Charge
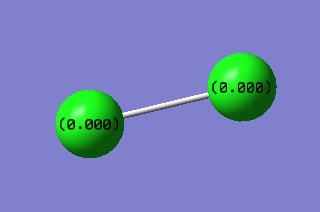 Both Cl have the same electronegativity so we expect charges to be 0.
Molecular Orbitals
These MOs are in order of decreasing energy. X will be defined as the axis of the Cl-Cl bond.
LUMO:
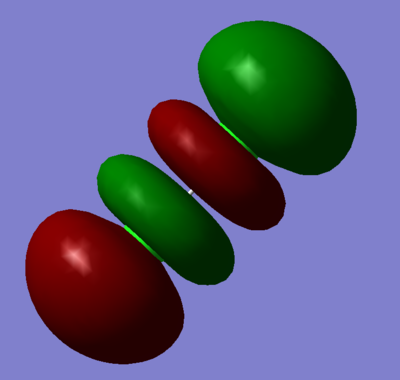 Combination of two 3px orbitals to give a sigma ungarade antibonding orbital.
HOMO:
 Combination of two 3pz orbitals to give a pi garade antibonding orbital.
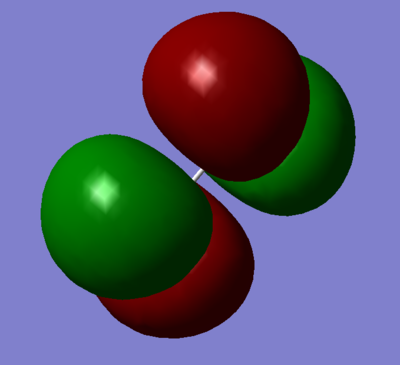 Combination of two 3py orbitals to give a pi garade antibonding orbital.
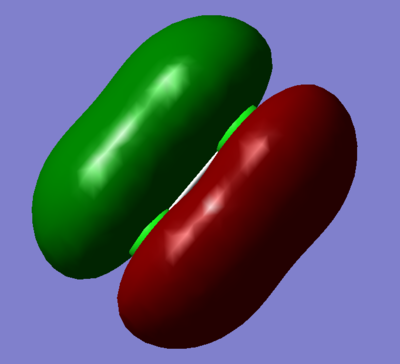 Combination of two 3pz orbitals to give a pi ungarade bonding orbital.
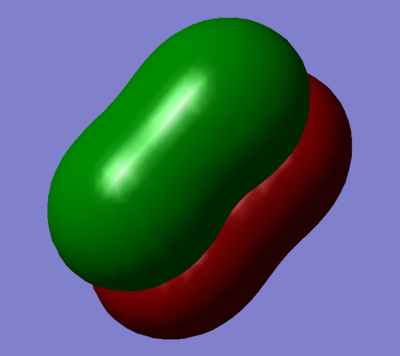 Combination of two 3py orbitals to give a pi ungarade bonding orbital
The combinations of the 3py and 3pz orbitals, both bonding ungarade and antibonding garade orbitals are degenerate.
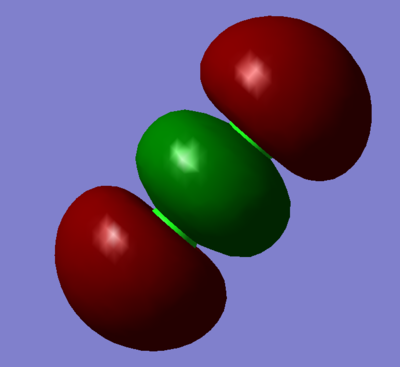 Combination of two 3px orbitals to give a sigma garade bonding orbital.
 Combination of two 3s orbitals to give a sigma ungarade antibonding orbital.
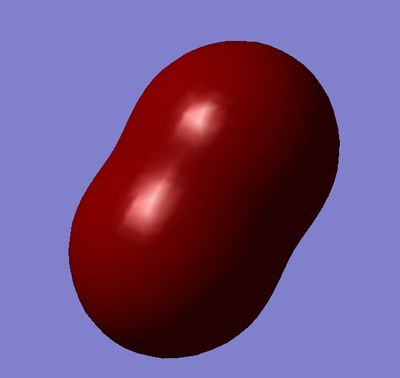 Combination of two 3s orbitals to give a sigma garade bonding orbital
ClF Molecule
| Data Type | Value |
|---|---|
| Calculation Method | RB3LYP |
| Basis Set | 6-31G(d,p) |
| E(RB3LYP) | -559.94269578 a.u. |
| RMS Gradient Norm | 0.00014179 a.u. |
| Point Group | D∞v |
| Cl-F Bond | 1.66434 Å |
| Molecule Shape | Linear |
The experimental value for the Cl-F bond is 1.6281 Å[2]. This is very close to the experimental value.
Item Table
             Item               Value     Threshold  Converged?
 Maximum Force            0.000008     0.000450     YES
 RMS     Force            0.000008     0.000300     YES
 Maximum Displacement     0.000023     0.001800     YES
 RMS     Displacement     0.000032     0.001200     YES
 Predicted change in Energy=-1.849058D-10
 Optimization completed.
    -- Stationary point found.
                           ----------------------------
                           !   Optimized Parameters   !
                           ! (Angstroms and Degrees)  !
 --------------------------                            --------------------------
 ! Name  Definition              Value          Derivative Info.                !
 --------------------------------------------------------------------------------
 ! R1    R(1,2)                  2.0416         -DE/DX =    0.0                 !
 --------------------------------------------------------------------------------
JMol
H Molecule |
Optimisation
The optimisation file is linked to here
Vibration
-How many bands would you expect to see in an experimental spectrum of gaseous hydrogen?
One at 781 cm-1 since there is a change of dipole moment in the vibration.
Charge
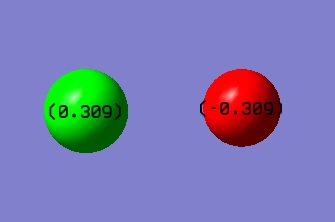 Since F is more electronegative than Cl, we expect the F to have a negative charge and the Cl a positive one.
References
- ↑ Freund H.J. () 2.3.8 Ammonia (NH{3}). In: Goldmann A., Koch EE. (eds) Subvolume A. Landolt-Börnstein - Group III Condensed Matter (Numerical Data and Functional Relationships in Science and Technology), vol 23a. Springer, Berlin, Heidelberg
- ↑ 2.0 2.1 Sutton, L. (1965). Tables of interatomic distances and configuration in molecules and ions. London: Chemical Society.
- ↑ 3.0 3.1 Atkins, P. and De Paula, J. (2010). Physical chemistry. New York: W.H. Freeman, p.931.
.

