Rep:Mod:aed1210
Physical Module
reaction is the point during the reaction at which the potential energy of the complex is highest. This point also corresponds to a saddle point on the potential energy surface of the reaction. Using the Gaussian software, the transition states of various reactions will be computed, optimised and certain qualities about them elucidated. Several different transition states will be studied over the course of this experiment. Firstly, the chair and boat transition structures of the [3,3] Cope Rearrangement will be studied, along with the various conformations of reactants and the activation energy of the reaction. Then the transition states of two separate Diels-Alder reactions will be studied with the focus on the mixing of the molecular orbitals and the allowed and forbidden reactions, as well as the endo and exo conformations of the reaction between cyclohexa-1,3-diene and maleic anhydride.
The Cope Rearrangement Tutorial
Optimizing the Reactants and Products
The Cope rearrangement is a [3,3]-sigmatropic rearrangement of 1,5-dienes, as seen in the scheme below. The reaction mechanism has been debated and extensivley studied [1], it is now accepted that it occurs in a concerted fashion and that the transition state for the reaction is either a boat or chair structure. The objectives of the following exercises are to locate the low-energy minima and transition structures of 1,5-hexadiene Cope Rearrangement, therefore determining the preferred mechanism.

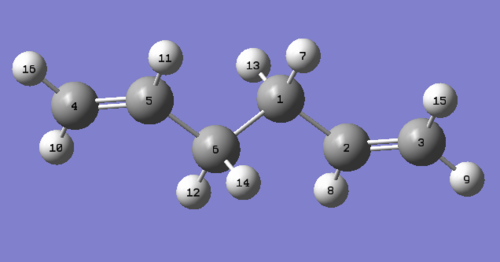
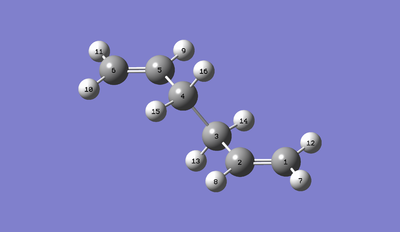
There are twelve possible conformers of the 1,5-hexadiene molecule, some of which have been created within the GaussView program. Of the studied conformers, some have a gauche linkage for the central four atoms and the others have an anti-linkage. Each of these conformers was then optimised using Gaussian, using the Hartree Fock method and the 3-21G basis set. Shown below are the structures, point groups, and energy of the molecules, both in Hartrees and relative to the other molecules.
| Structure | Point Group | Energy/Hartrees HF/3-21G |
Relative Energy/kcal/mol | |||
|
C2 | -231.68771607 | 3.10 | |||
|
C2 | -231.69166701 | 0.62 | |||
|
C2 | -231.69153035 | 0.71 | |||
|
C1 | -231.68916019 | 2.20 | |||
|
C2 | -231.69260225 | 0.04 | |||
|
Ci | -231.69253522 | 0.08 | |||
|
C1 | -231.69097055 | 1.06 |
As can be seen from the above numbers, the conformer with the lowest energy and thus the one that would be seen in the highest proportions in an actual sample is the Gauche 3 conformer. The relative stability of the Gauche 3 conformer can be attributed to a favourable interaction between the vinyl proton and the C=C π orbital. The highest energy conformer is the Gauche 1 conformer, at a relative energy of 3.10 kcal/mol higher than the Gauche 3 conformation. The reason why the Gauche 1 conformer is of the highest energy is due to the proximity of the two vinyl groups. These are electron rich and so it is unfavourable to have them so close together. The remaining sequence for the gauche conformers is determined by the distance between these two groups, specifically the distance between the protons on each group, as a general trend, the energy decreases with increasing distance between these two protons. The energy of the anti-conformers can be explained as a trend between the distance of the vinyl protons and the protons on the β carbon.
Comparison of Theories
Two levels of computational theory will be applied to calculations throughout this experiment, HF/3-21G and B3LYP/6-31G*. In order to compare the two theories, both are applied to the optimisation of the same molecule and the bond lengths and angles obtained in the optimised molecule are compared. In this case, the Anti 2 molecule has been reoptimised at the B3LYP/6-31G* for comparison to the previously calculated HF/3-21G value. Upon inspection, there is no visible difference between the optimised molecules, however closer investigation shows some differences between the two structures.
Angles and bond lengths are described with reference to the numbered molecule below.
| Bond | HF Value / Å | B3LYP Value / Å |
|---|---|---|
| C2-C3 | 1.31623 | 1.33824 |
| C2-C1 | 1.50890 | 1.50721 |
| C1-C6 | 1.55278 | 1.55505 |
The B3LYP method produces a longer bond length for the carbon-carbon double bond, slightly shorter but almost identical bond between the sp2 and sp3 hybridised centres and a shorter bond length for the sp3-sp3 single bond than the Hartree-Fock method. For the double bond, the literature value is calculated to be 1.33, and so is more accurately modelled by the B3LYP model. As the value for the other bonds are fairly similar, and as such the extra computational power may not be deemed worth it for simple calculations. (The opposite is actually true: one can use the simpler calculation to obtain a rather good first estimate of the minimum geometry with a relatively low computational cost, and then refine this estimate with a small number of steps at a higher level of theory. João (talk) 19:03, 15 April 2015 (BST))
| Dihedral | HF Value / deg | B3LYP Value / deg |
|---|---|---|
| C3-C2-C1-C6 | 114.69527 | 118.77555 |
| C2-C1-C6-C5 | 179.98991 | 180.00000 |
The dihedral angle between the carbons in the different environments also varies between methods. For the C3-C2-C1-C6 angle, the B3LYP method returns a larger angle than the Hartree-Fock method. We see a slight variation in angle for the central dihedral (between C2-C1-C6-C5) but this very small between the two methods (<0.011 units).
Frequency Analysis
Frequency analysis can also be performed on the optimised structure we have calculated. The frequency obtained is related to the second derivative of the potential energy surface with respect to the geometry of the atoms involved. The output obtained allows further information about the stationary point on the PES that was obtained from the optimisation to be gathered.
The log file obtained from the frequency analysis confirms that the structure has been optimised to a minimum, due to the lack of imaginary frequencies. It also provides some thermochemical data in the form of energies and enthalpies, as a displayed below. (How do these quantities vary with temperature? João (talk) 19:03, 15 April 2015 (BST))
Sum of electronic and zero-point Energies=           -234.416255
Sum of electronic and thermal Energies=              -234.408963
Sum of electronic and thermal Enthalpies=            -234.408019
Sum of electronic and thermal Free Energies=         -234.447872
Optimizing the "Chair" and "Boat" Transition Structures
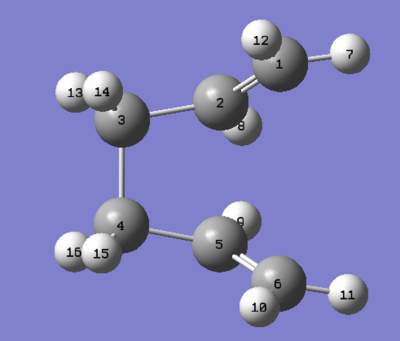
The chair transition state is optimised first. An allyl fragment is first optimised and then two of these fragments are placed, staggered with a C2h point group, 2.2 A apart. This structure was optimised using the TS (Berny) method as we are dealing with a transition state, and a frequency analysis was performed on the optimised structure using the HF method and the 3-21G basis set. The resulting optimised transition state is visualised below.
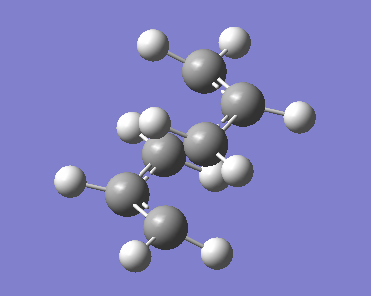
Examination of the log file obtained from the optimisation gives the chair transition state as hoped, and the singular negative frequency present at 818 cm-1 confirms the presence of a minimum, the transition state, and can be thought of as a saddle point on the PES.
The vibration at -818 cm-1 is visualised below (What is the significance of this particular motion corresponding to an imaginary frequency? João (talk) 19:03, 15 April 2015 (BST))
Transition State Vibration -818cm-1 |
Frozen Coordinate Chair Optimisation
An alternate method of optimising the chair transition state, but still using the Hartree-Fock method and 3-21G basis set is the frozen coordinate optimisation. In this method, the same procedure of setting the distance between the fragments (2.2A) was used, but with the additional constraint of fixing the ends of the molecule to a distance of 2.2 Å for the duration of the optimisation. The molecule is optimised twice in total, first with frozen groups, then re-optimised with the groups free (Apart from freezing the coordinates, are the two optimization steps identical? Why could this procedure be useful? João (talk) 19:03, 15 April 2015 (BST)). Although the product of the first optimisation looks like the transition state produced from the method above, a single negative frequency of -765 cm-1 is obtained, confirming that the optimisation has not been fully completed. The molecule produced after the second optimisation is shown below.
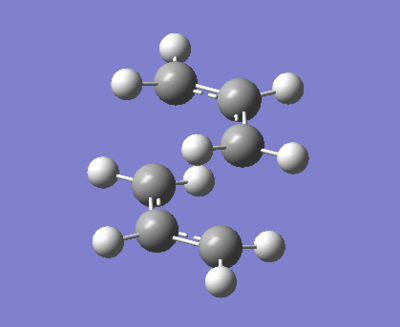
The difference between the two structures obtained is marginal and cannot be seen from examination of the structure displayed above, but there is a difference. In the frozen coordinate optimisation, the bond lengths are slightly longer (2.02074 vs 2.02032), and the frequency is slightly less negative (-817.88 vs -817.92) (Are the differences you observe significant? João (talk) 19:03, 15 April 2015 (BST)). The difference must arise from the differences in method applied as the calculation results are directly comparable due to being performed with the same basis set. The desired frequency (-818) is more closely achieved by the first method of optimisation, and bond lengths are closer to 2.2 Å, potentially pointing to this being the more reliable method of the two.
QTS2 Optimisation
For optimisation of the boat transition state, the QST2 method was employed. This involves giving both the products and the reactants for the reaction and allowing the simulation to try and find the transition state. The products and reactants thus have to be numbered accordingly to allow the method to identify the pathway between them. The first input for this method is shown below.
| Reactant | Product |
The calculation fails under this input, as the reaction mapped between the two involved the cleavage of the central bond, followed by translation of the allyl fragment. This gives a chair transition state and so the input and output must be modified to produce the correct modelling.
| Reactant | Product |
This time, the angles of the reactant and product molecules are modified to give the structures seen above, a structure closer to the Gauche 2 conformation (Perhaps more like an eclipsed conformation? João (talk) 12:25, 16 April 2015 (BST)). Here, the reactant and product are closer to the transition state and so the saddle point is found during the scale of the calculation. The boat transition state is visualised below.
Boat Transition State |
Upon examination of the vibrational modes, a single negative vibration is found at -840 cm-1, corresponding to the transition state vibrations. The presence of this vibration also confirms the maximum (saddle point) in this pathway has been found.
Reaction Pathway Vibration |
Intrinsic Reaction Coordinate (IRC)
It is very difficult to predict the conformers that are produced from the transition states, however there is a Gaussian method (IRC) that allows the mapping of the minimum energy path from the transition structure to its local minimum on the PES. It can be thought of the path a ball with zero kinetic energy would follow if placed on the PES. Generation is done by following the curvature of the PES stepwise and is useful for us to see which conformers of the reactants and products are connected by the transition state in question. The size of step selected for the generation of the IRC has a direct effect on the accuracy of the output as a larger step size can accrue significant errors during the course of calculation. To determine the conformer produced from the transition state, the forward reaction path is calculated. The resulting IRC plot is shown below.
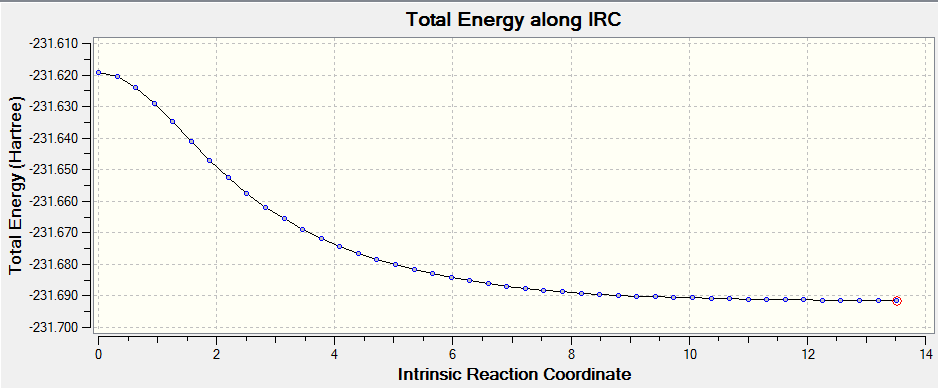
The total energy graph shows the drop in energy as the molecule comes down from the high energy transition state to settle in the low energy well of the product conformation. From the plot above we can see that as the energy has yet to reach a plateau, a minimum geometry has not yet been found. The minimum geometry can be found in a number of ways but for ease it was chosen to perform an optimisation on the lowest energy conformation from the low energy plot, which can be visualised by opening the checkpoint file. The structure obtained after this optimsation is very similar to the Gauche 2 conformer pointing to this conformer being the one formed from this transition state. (Before the optimization step, does the obtained structure differ much from the optimized one? João (talk) 12:25, 16 April 2015 (BST))
Activation Energies
In order to calculate the activation energies of the reaction pathways, we need optimised forms of both the transition states, to compare with the energies of the reactant. These can be performed using both the HF/3-21G and the B3LYP/6-31G* levels of theory and so the two transition states were optimised at the B3LYP/6-31G* level. At the higher level of theory, transition states are still found, geometries are visualised below… (This comparison seems to be missing. Did you confirm your reoptimised geometries were still transition states at the higher level of theory? João (talk) 12:25, 16 April 2015 (BST)) By subtracting the energy of the reactant away from the transition state energies, the activation energies are found, as shown below.
Summary of energies (in hartree)
| HF/3-21G | B3LYP/6-31G* | |||||
|---|---|---|---|---|---|---|
| Electronic energy | Sum of electronic and zero-point energies | Sum of electronic and thermal energies | Electronic energy | Sum of electronic and zero-point energies | Sum of electronic and thermal energies | |
| at 0 K | at 298.15 K | at 0 K | at 298.15 K | |||
| Chair TS | -231.619322 | -231.466703 | -231.461343 | -234.556985 | -234.414909 | -234.408968 |
| Boat TS | -231.602802 | -231.450929 | -231.445301 | -234.543093 | -234.402341 | -234.396007 |
| Reactant (anti2) | -231.692535 | -231.539539 | -231.532566 | -234.611709 | -234.469208 | -234.461860 |
Where 1 hartree = 627.509 kcal mol-1
Summary of activation energies (in kcal/mol)
| HF/3-21G | HF/3-21G | B3LYP/6-31G* | B3LYP/6-31G* | Expt. | |
| at 0 K | at 298.15 K | at 0 K | at 298.15 K | at 0 K | |
| ΔE (Chair) | 45.94 | 44.69 | 34.07 | 33.19 | 33.5 ± 0.5 |
| ΔE (Boat) | 56.31 | 54.76 | 43.06 | 41.32 | 44.7 ± 2.0 |
Compared to experiment, the higher level of theory gives a more accurate result than the HF/3-21G level, as expected. Compared across the two temperatures, 0K and 298.15K it can be seen that the activation energy is largest for the 0K case. This is due to the presence of thermal energy at 298.15K, it can be thought of that with the additional thermal energy the molecule begins the reaction process from a place closer to the transition state maximum than without the thermal energy, thus the barrier to the transition state is relatively smaller (In such analysis shouldn't you also consider the thermal corrections at the transition state? João (talk) 12:25, 16 April 2015 (BST)). The activation energy for the chair pathway is lower in both cases, and is therefore the state of preference.
Diels Alder Cycloaddtions
Ethylene and cis-Butadiene
The Diels-Alder reaction is a well-documented pericyclic reaction between a diene and a dienophile that forms a cyclic structure. First described in 1928, it is very synthetically useful and so has been widely applied and studied ever since. Here, the reaction studied in the following section is that between ethylene and cis-butadiene to form cyclohexene. (What level of theory did you use in these calculations? João (talk) 18:51, 17 April 2015 (BST))
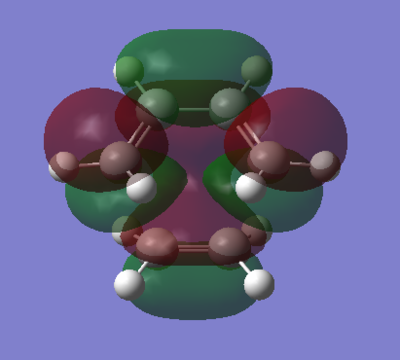
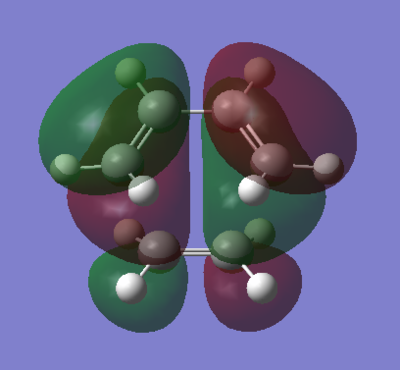
The optimised structures allow us to visualise the orbitals of the compound, and so the HOMO and LUMO orbitals of both compounds are shown below. (What are the symmetry properties of these orbitals? João (talk) 18:51, 17 April 2015 (BST))
cis-Butadiene |
| cis-Butadiene LUMO | cis-Butadiene HOMO |
| Ethylene LUMO | Ethylene HOMO |
As before with the previous example, the transition state of the Diels-Alder reaction between the two was optimised from an input of the two optimised reactants at a fixed distance from one another. Initially, a distance of 2.2 was used as in the previous example but this distance resulted in a failure to optimise the transition structure and so a shorter distance of 2.15 was used to gain a successful optimisation.
Optimisation for the transition state leads to the below structure being formed. The presence of a single negative frequency confirms that the saddle point has been located which is also visualised below.
Transition State Vibration |
Bond Lengths
In order to analyse the bonding in the transition state, the bond lengths are examined.
| Bond | Length / Å |
|---|---|
| C1-C4 | 1.38192 |
| C4-C6 | 1.39750 |
| C1-C14 | 2.11935 |
| C14-C11 | 1.38290 |
Typical single C-C bond lengths in carbon are 1.54 Å for sp3 hybridisation and for sp2 are 1.46 Å.[2] The bond lengths of the existing bonds of ethylene and cis-butadiene in the transition state suggest a delocalised, partial double bond character for the C-C bonds in both the reactants. The Van der Waals radius of carbon is 1.70 Å so a distance of 2.12 Å between the carbon atoms that will share a sigma bond in the product suggests an attractive interaction between them. (Why does it suggest an attractive interaction? At the transition state do you expect attraction, repulsion, neither? João (talk) 18:51, 17 April 2015 (BST))
The visualised frequency of the transition state infers some information about the mechanism of bond formation. The two points at which the new sigma bonds are to be created move synchronously, as expected from the concerted, pericyclic reaction.
Orbital Comparison
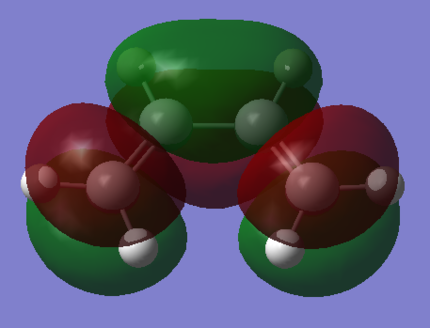
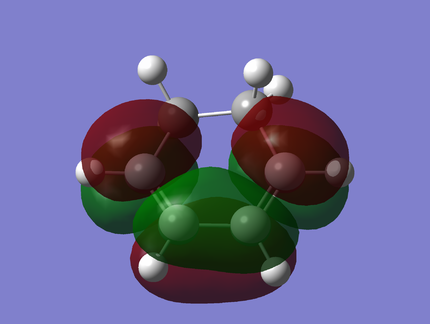
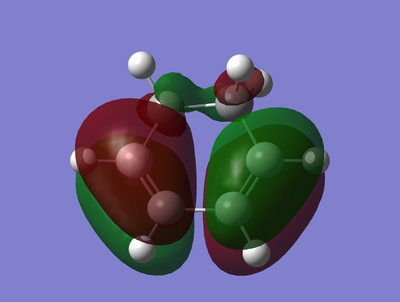
The theory applied that allows the study of chemical reactions through analysis of their molecular orbital is Fronteir Molecular Orbital theory (FMO) (Not exactly, frontier orbital theory only focus on the frontier orbitals, there are more complete theories which don't limit their analysis to these orbitals. João (talk) 18:51, 17 April 2015 (BST)), we are able to use this theory to predict the outcomes of reactions, qualitatively, by considering the HOMO and LUMO orbitals of the reactants. The HOMO and LUMO of the transition state are shown below, when compared with the HOMOs and LUMOs of the reactants, some similarities can be seen. Namely, the HOMO of the transition state appears to be a blend of the butadiene HOMO and the ethylene LUMO and the transition state LUMO a blend of the butadiene LUMO and ethylene HOMO. As the HOMO and LUMO of the reactants must be well matched in energy and of the right symmetry to allow the reaction to proceed, the mixing of the two to give the transition state orbitals shows that the reaction is an allowed pathway (Why does it show that? João (talk) 18:51, 17 April 2015 (BST)).
| TS LUMO - Symmetric w.r.t. Plane | TS HOMO - Antisymmetric w.r.t. Plane |
Cyclohexa-1,3-diene and Maleic Anhydride
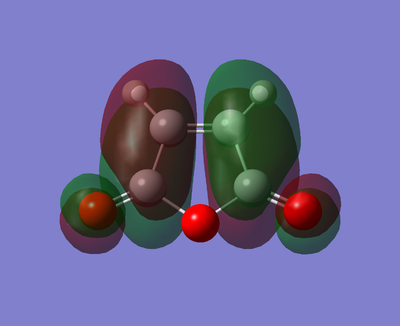
The Diels-Alder reaction between Cyclohexa-1,3-diene and Maleic Anhydride brings up another important issue of the transition states involved. With more complex reactants, there is the possibility of approach from two distinct directions, endo and exo. The dienophile substitute may face toward the diene (endo) or away (exo). With most cases under kinetic control, the endo product is usually preferred and a study of the orbitals involved shows, for the following reaction, why that is the case.
As before, the two reactants were first optimised and their HOMO and LUMOs visualised, the results of which are shown below.
Cyclohexa-1,3-diene
Cyclohexa-1,3-diene |
| LUMO | HOMO |
Maleic Anhydride
Maleic Anhydride |
| LUMO | HOMO |
Endo and Exo Transition States
Endo
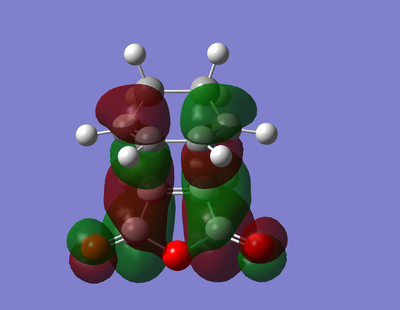
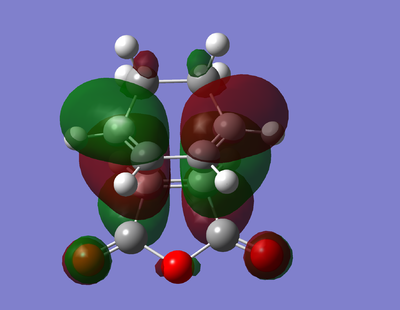
In order to create the endo transition state for the reaction, the reactants were optimised and placed in the endo formation before performing an optimisation and frequency calculation on the structure and the transition state saddle point is once again confirmed by the presence of a single negative frequency found.
The optimised transition state, HOMO and LUMO orbitals are all visualised below.
Endo Transition State |
| LUMO | HOMO |
Exo
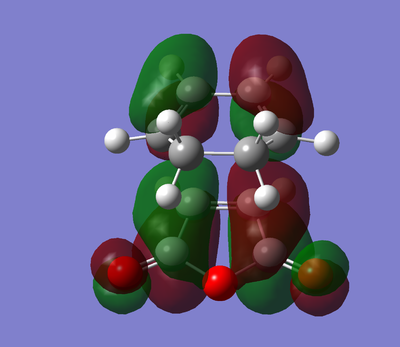
The same procedure was followed for the exo transition state as the endo form previously. Again, a saddle point was established and confirmed through the presence of only one negative frequency.
Exo Transition State |
| LUMO | HOMO |
For both structures, a comparison of the relative energies has been made. The endo conformation is of lower energy, rationalising why the endo conformation is the preferred product (Doesn't this depend on experimental conditions? João (talk) 18:51, 17 April 2015 (BST)).
| Conformer | Energy (Hartrees) | Relative Energy (kcal/mol) |
|---|---|---|
| Exo | -0.05041984 | 0.68 |
| Endo | -0.05150481 | 0 |
A comparision of the bond lengths has also been made with respect to the labelled diagrams of each compound. The main difference brought to light here is the distance between the carbons where the new bonds will be formed. In the exo transition state, these are slightly longer than in the endo case. This elongation can be attributed to the greater steric repulsion in the exo transition state, making closer approach less favourable in this scenario (Do you see evidence for such repulsion? João (talk) 18:51, 17 April 2015 (BST)).

| Bond | Endo Bond Lengths (Å) | Exo Bond Lengths (Å) |
|---|---|---|
| C1-C2 | 1.49053 | 1.48975 |
| C1-C4 | 1.52297 | 1.52209 |
| C2-C9 | 1.39307 | 1.39439 |
| C9-C11 | 1.39724 | 1.39677 |
| C15-C16 | 1.40848 | 1.41013 |
| C16-C17 | 1.48923 | 1.48820 |
| C17-O23 | 1.40896 | 1.40963 |
| C17-O21 | 1.22057 | 1.22054 |
| C2-C16 | 2.16237 | 2.18027 |
| C3-C15 | 2.16238 | 2.18054 |
Secondary Orbital Effects
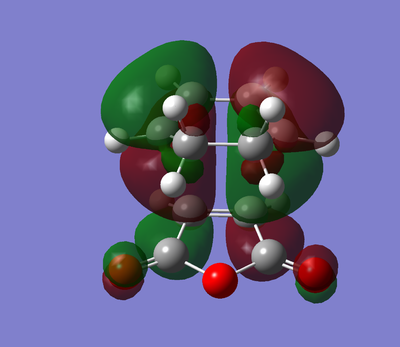
It has previously been proposed (Reference? João (talk) 18:51, 17 April 2015 (BST)) that a secondary orbital overlap effect, where by the pi system on the substituent of the dieneophile and the pi system of the diene have a favourable interaction in the endo form, give the reasons for the endo selectivity seen in the reaction. However, examination of the HOMO and LUMO orbitals only is not able to account for these effects in this case. It is a drawback of the frontier orbital model that this is based on that we cannot rationalise the selectivity seen from these visualised orbitals alone. Examination of the second highest filled orbital does show the effects we're looking for. Here, we see influence from the carbonyl pi system, that would show the favourable interation desired. As expected, this orbital interaction can only be seen in the endo form of the transition state, no such influence is seen in the exo form and thus no stabilising interaction would be possible, providing rational for the endo preference of the reaction. (Where do you show this? João (talk) 18:51, 17 April 2015 (BST))
Conclusion
The mechanisms and transition states of three reactions were studied with the Gaussian program; the cope rearrangement, and two forms of the Diels-Alder reaction. For the Cope rearrangment, several different conformations of the reactants were analysed, including one at two separate levels of theory, allowing comparison between the two. As expected, it was found that the higher level of theory B3LYP/6-31G* provdided a better optimisation of the molecule, however the HF/3-21G level does provide a fairly accurate optimsiation of the molecule and for simple molecules provides a very computationally efficient method that should not be discounted.
After this, two transition states of the cope rearrangement were studied through a variety of different methods to identify the transition state. The two forms of the TS for the reaction, the boat and chair, were optimised and their energies calculated, allowing for the activation energy of the reaction to be calculated.
The Diels-Alder reaction was studied in the second part of the experiment. Through use of Frontier Molecular Orbital theory, the HOMO and LUMO orbitals of each reaction were studied to make some qualitative deductions about the outcomes of the reactions. The downfalls of this method were also discussed when it comes to the endo preference of the reaction between maleic anhydride and cyclohexa-1,3-diene as the reaction preference cannot be rationalized through examination of these orbitals alone.
Overall, the use of the Gaussian program and generally, the effectiveness of computational methods into the study of the energy and potential energy surfaces of reactions has been demonstrated. With relative ease, we have been able to demonstrate complex physical phenomena and try to rationalise their origin.

