
Rep:Mod:adt101
Molecular modelling in Organic Chemistry by Aaron Trowbridge
Module 1: The Dimerisation and Hydrogenation of Cyclopentadiene
Dimerisation of cyclopentadiene
Dicyclopentadiene is a major industrial feedstock with a worldwide consumption of 150000 metric tons in 2006.[1] It finds major uses in the production of plastics and resins as well as niche applications as a fine chemical. [2]

It is produced by the dimerisation of cyclopentadiene on standing however is can be promoted by the action of impurities such as peroxides and TCA. [3] The dimerisation process is the product of a Diels-Alder π4s + π2s cycloaddition where the two π-bonds in one cyclopentadiene ring, fixed in a cis-conformation, react with a single π-bond in another forming a methylene bridged partially hydrogenated indene like structure (Scheme 1). The dimerisation of cyclopentadiene can however produce two different isomeric products an endo- isomer and an exo-isomer. The nature of these isomers is the orientation of the 5-membered cyclopentene ring relative to the longest bridge, the orientation syn (in the same plane)- to the longest ring is defined as the endo- isomer. Looking at the norbonene ring we have a one-carbon bridge and a two-carbon bridge and hence we can define the two isomers (Scheme 2).

Woodward and Hoffmann noticed a predominance of the endo-isomer when the dimerisation process was carried out experimentally and there are several possible explanations as to why this occurs. [4]
The formation of a single isomer over the other indicates that we have either thermodynamic or kinetic factors present during the reaction. Reactions under thermodynamic control are reversible and an equilibrium occurs which eventually leads to the formation of the most stable product. Reactions that yield the thermodynamic product are typically conducted at high temperatures and for long periods of time. Reactions under kinetic control are often irreversible and the product obtained is done so via the reaction pathway that offers the lowest barrier to formation. Put simply, the stability of the transition state governs the outcome, not the stability of the product. Reactions that yield the kinetic products are therefore typically conducted rapidly at low temperatures. In order to rationalise whether or not the reaction is under thermodynamic or kinetic control we need to examine the relative energies of the two dicyclopentadiene isomers
We can analyse the relative energies of the isomers using computational techniques and modelling. For the modelling of the isomers ChemBio3D ulta v.12.0 was used, energy minimisation calculations were conducted using an MM2 forcefield. The energies computed for the two isomers is a combination of the stretching, bending, torsion, VDW and dipole-dipole energies. The values computed are measures of deviation from the ideal or normal values for that particular function. Large positive deviations, such as the values of the bending energy for the two dicyclopentadiene isomers (Scheme 3) indicate a very strained ring system.
| Energy Iteration | Endo- isomer (kcal/mol) | Exo- isomer (kcal/mol) | Energy Difference |
| Stretch | 1.2500 | 1.2855 | 0.0355 |
| Bend | 20.8490 | 20.5806 | -0.2684 |
| Stretch-Bend | -0.8356 | -0.8384 | -0.0028 |
| Torsion | 9.5109 | 7.6547 | -1.8562 |
| Non-1,4 VDW | -1.5434 | -1.4159 | 0.1275 |
| 1,4-VDW | 4.3191 | 4.2323 | -0.0868 |
| Dipole-Dipole | 0.4475 | 0.3775 | -0.100 |
| Total Energy | 33.9975 | 31.8765 | -2.1210 |
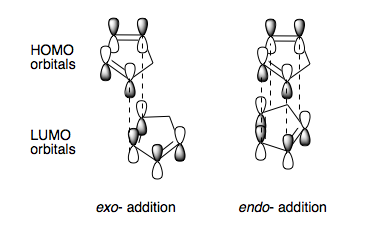
From Scheme 3 we can see that the relative energies of the two isomers differ by over 2 kcal/mol, the calculations show that the exo-isomer has the lowest energy and hence is the most stable. from this we can deduce that the reaction must be under kinetic control because thermodynamically, the more unstable product is formed. We can use a simple HOMO-LUMO orbital interaction picture to reason. The endo-transition state is stabilised by secondary orbital interactions during the transition state, whereas such such stabilisation is not afforded during the exo-transition state (click to view orbital interactions). An alternative explanation is that dipole-dipole interactions occur between the diene and dienophile during the endo-transition state that favour this product. [5]
Hydrogenation of Dicyclopentadiene
As we have seen endo-dicyclopentadiene is the major product isolated from the dimerisation of cyclopentadiene. If we hydrogenate this compound there are three conceivable products that could be made, two dihydro-derivatives and the fully hydrogenated tricyclo[5.2.1.0]decane. The dihydro derivatives find use in the rubber and adhesives industry, whereas the fully hydrogenated species can be isomerized in the presence of a lewis acid to form adamantane, a useful synthetic intermediate. [6] In reality the hydrogenation of dicyclopentadiene with Pd/C affords initially a single dihydro-deriviative and only after prolonged hydrogenation the fully hydrogenated species (Scheme 4). [7] The observed species has been hydrogenated around the alkene in the norbonene ring system, whereas the unobserved species has been hydrogenated around the alkene in the cyclopentene ring.

The observed product distribution can be rationalised by examining the relative energies of the two isomers using an energy minimisation calculation using an MM2 forcefield (Scheme 5).
| Energy Iteration | Observed isomer (kcal/mol) | Unobserved isomer (kcal/mol) | Energy Difference |
| Stretch | 1.1299 | 1.2771 | 0.1472 |
| Bend | 13.0133 | 19.8664 | -6.8531 |
| Stretch-Bend | -0.5649 | -0.8346 | -0.2697 |
| Torsion | 12.4139 | 10.8068 | -1.6071 |
| Non-1,4 VDW | -1.3265 | -1.2257 | 0.1008 |
| 1,4-VDW | 4.4408 | 5.6630 | 1.2222 |
| Dipole-Dipole | 0.1410 | 0.1621 | -0.0211 |
| Total Energy | 29.2476 | 35.6850 | 6.4374 |
From the results of the energy minimisation calculations (Scheme 5) we can see that the observed isomer is that which has the lowest energy (by over 6 kcal/mol), as you would expect. The major energy difference between the two isomers occurs in the bending region, with almost a 7 kcal/mol difference. Looking at the energy minimisation calculations it can be shown that the bond angles around the alkene in the two different isomers varies by almost 5.5o with the bond angle in the observed isomer closer to the ideal value of 120o, at 112o. It is clear by simple observation that the alkene in the norbonene ring is significantly strained and thus releasing the ring strain by hydrogenation affords a significant lowering in the overall energy of the system.
Module 2: Atropisomerism in the Synthetic Intermediates of Taxanes
Taxanes are a class of highly poisonous diterpenoids isolated from the bark of the family Taxaceae, commonly know as the Yew. The most well known of these alkaloids is Taxol, one of the worlds most successful anti-cancer drugs promoting microtubule assembly. [8] With 11 stereocentres and a tetracyclic heptadecane backbone, only a handful of total syntheses exist and chemists have been trying to utilise the Oxy-Cope rearrangement shown in Scheme 6 to introduce the necessary functionality for many years.[9]

The rearrangement shown in Scheme 6 produces 2 atropisomers. Atropisomerism occurs as a result of hindered rotation around a single bond due to unfavourable steric interactions. The atropisomerism in this intermediate occurs around the carbonyl forcing it to either face up (isomer 1 up) or down (isomer 2 down) in the ring. On standing the two atropisomers (1 and 2) slowly isomerise between each other and the most thermodynamically favoured isomer accumulates. The most favoured conformation can be calculated using the energy minimisation technique and an MM2 forcefield (Scheme 7).
| Isomer 1 | Isomer 2 | ||||||
|
|
| Energy Iteration | Isomer 1 (kcal/mol) | Isomer 2 (kcal/mol) | Energy Difference |
| Stretch | 2.7846 | 2.6193 | -0.1653 |
| Bend | 15.5404 | 11.3465 | -4.1939 |
| Stretch-Bend | 0.4301 | 0.3433 | -0.0868 |
| Torsion | 18.2518 | 19.6623 | 1.4105 |
| Non-1,4 VDW | -1.5508 | -2.1597 | -0.6089 |
| 1,4-VDW | 13.1084 | 12.8736 | -0.2348 |
| Dipole-Dipole | -1.7250 | -2.0020 | -0.2770 |
| Total Energy | 47.8396 | 42.6830 | -5.1566 |
We can repeat these calculations using a similar energy minimising technique however using a different forcefield, MMFF94. The results of the calculations using the same two isomers is shown in Scheme 8.
| Energy Iteration | Isomer 1 (kcal/mol) | Isomer 2 (kcal/mol) | Energy Difference |
| Total Energy | 70.5366 | 60.5653 | -9.9713 |
What is clear from the two energy minimisation calculations shown using an MM2 and MMFF94 forcefield in Schemes 7 and 8, is that isomer 2 adopts the most stable conformation by 5.16 and 9.97 kcal/mol respectively. Because isomer 2 is the most stable we would expect that over time all of the up isomer will convert to the down isomer, but it is unclear why this process is slow hence causing atropisomers. In order to gain a clearer understanding we must examine the two isomers in more detail, the fused cyclohexane rings both adopt a chair conformation however the two chairs are mirror images of each other. Ordinarily, cyclohexane undergoes rapid ring interconversion via a boat-conformation, however such fused rings cannot undergo this process so readily. In order to grasp the sort of energy barrier associated with this we can examine isomers 1 and 2 with the opposite chair conformations, isomers 1a and 2a.
| Isomer 1b | Isomer 2b | ||||||
|
|
The corresponding energies associated with these two inverted chair isomers 1b and 2b calculated using an MM2 and MMFF94 forcefield are shown in Scheme 9.
| Total Energy | Isomer 1b (kcal/mol) | Isomer 2b (kcal/mol) | Energy Difference |
| MM2 | 58.3858 | 52.5424 | -5.8434 |
| MMFF94 | 82.7711 | 74.8249 | -7.9462 |
From Scheme 9 we can see that the inverted chair isomers of 1 and 2 are around 10 kcal/mol higher in energy, with the down isomer still more energetically favourable. In order for isomers 1 and 2 to interconvert they must go through a transition state featuring these higher energy inverse boats hence rendering these two isomers separable. This is in good agreement with literature whose studies have shown that the down isomer is more stable by around 4kcal/mol and thermal studies have shown that heating a mixture of the atropisomers at 358K for 3 hours leading to an 80% isomeric excess of the stable down isomer. [10]
It has been demonstrated that the alkene in the taxane intermediates 1 and 2 are unusually unreactive. The location of alkene in the structure is at a bridgehead which is even more unusual as one would expect such a highly strained environment to render the alkene more reactive. These highly twisted alkenes have much poorer π-overlap and subsequently a lowering of the HOMO-LUMO gap causing reactivity more akin to that of a biradical. This concept is measured by olefinic strain and is a comparison of the conformational strain of the alkene compared to the saturated alkane. Most alkanes have a positive value of olefinic strain however a certain class of molecules named hyperstable alkenes exist where the energy of the alkene is lower than that of the corresponding alkane. The hyperstability is a result of the angular strain caused by the the bridgehead alkene being less than the energy caused by trans-annular interactions of the saturated cycloalkane. [11]
Module 3: Regioselective Addition of a Dichlorocarbene to an Unsymmetrical Diene
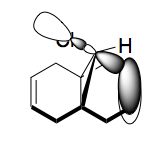
It has been shown that the electrophilic [1+2]Cycloaddition of dichlorocarbene to 9-chloro-1,4,5,8-tetrahydro-4a,8a-methanonapthalene occurs with a remarkable degree of regioselectivity (Scheme 10). [12]

The addition of dichlorcarbene occurs on the endo-face of the ring away from the steric bulk of the methylene bridge as expected, however what is not so clear is the regioselectivity of the addition. The bridged tetrahydronapthalene ring system is not symmetrical and the ring under the chlorine is an endo-ring because it is pointing down towards the other 6-memebred ring. In order to gain a better understanding of this we need to examine the energies associated with the two alkenes. An energy minimisation calculation was undertaken on the molecule using an MM2 forcefield and a MOPAC PM6 Semi-imperical method. The limitations of the MM2 forcefield minimisation can be clearly seen when the two results are overlayed (Scheme 11).

The MOPAC PM6 optimised structure was then used to calculate the energy levels and molecular orbitals of the molecule. The energy calculation was performed in Gaussian with a DFT Ground State B3YLP method and the results displayed in Scheme 12 show the HOMO-1 to the LUMO+2 and their corresponding energies.
| MO | Energy Surface | Energy (eV) |
| HOMO-1 |  |
-0.33309 |
| HOMO |  |
-0.33300
|
| LUMO |  |
-0.15803
|
| LUMO+1 |  |
-0.14954
|
| LUMO+2 |  |
-0.08209
|
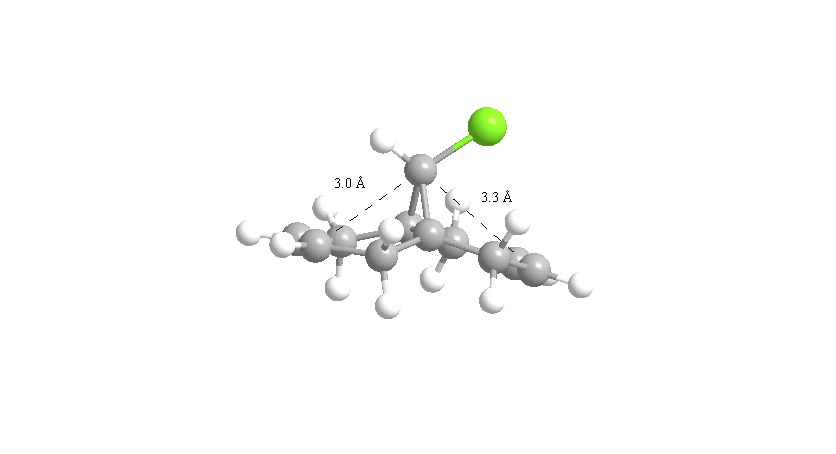
From Scheme 12 it can been seen that there are several interactions of significance occurring within the HOMO-LUMO region of the molecule contributing to its reactivity. The most significant interaction is that of the exo-π bond (LUMO-1) interacting with the C-Cl σ* orbital (HOMO+2) (click to view orbitals). The electron rich π-orbital has a good orbital alignment with the σ* allowing it to pump electrons into the bond. This manifests itself in the shortening of the distance between the bridgehead methylene and the alkene carbon. The relative distances between exo- and endo-π bonds and the methylene bridgehead are 3.05Å and 3.26Å respectively (click to view lengths), indicating a significant orbital interaction. The fact that the electron density is being removed from the exo-alkene means that it is more electrophilic than the corresponding endo-alkene. Dichlorocarbene acts as an electrophile and hence targets the more nucleophilic endo-alkene, resulting in the observed regioselectivity. Further confirmation arises from the IR stretching frequencies calculated from Gaussian using a B31YP with 6-31G basis set. The exo-alkene has a lower stretching frequency than the endoalkene (1737cm-1 compared to 1757cm-1) because of the reduced electron density in the bond. We can also compare the C-Cl stretching frequency from the diene to the fully saturated tetrahydrodiene. As the electron density is pumped from the exo-π orbital into the antibonding C-Cl σ* orbital we would expect the bond to weaken and hence stretch at a lower frequency compared to the tetrahydrodiene, unfortunately this was not observed in the IR predictions (771cm-1 for the diene and 770cm-1 for the tetrahydrodiene). The IR stretching modes and frequencies are displayed in Scheme 13 and to view the predicted IR Spectrum (click here).
| Stretch | Frequency (cm-1) |
| Diene (exo- C=C) | 1757.45 |
| Diene (endo-C=C) | 1737.05 |
| Diene (C-Cl σ*) | 770.81 |
| Tetrahydrodiene (C-Cl σ*) | 770.11 |
Module 4: Neighbouring Group Protection in Monosaccharide Glycosidation
Glycosidation is the process of forming a new glycosidic bond. The reaction requires the loss of a leaving group at the anomeric carbon and the subsequent addition of a nucleophile. The reaction follows an SN1 type mechanism with the formation of an intermediate oxonium ion. The planar nature of the oxonium ion means that there is an equal chance of the nucleophile attacking at the top or the bottom face giving a mixture of α- and β-anomers (Scheme 14).

If the nucleophile has a low energy σ*-orbital and the reaction under thermodynamic control then the anomeric effect will tend to prefer the α-anomer but this is in no way a completely regioselective process.
A significantly higher degree of regioselectivity can be achieved by means of Neighbouring group participation. If the 2-position is occupied by an acetyl group the intermediate oxonium cation can be quenched forming an acetoxonium cation which is resonance stabilised. The formation of this ion blocks off attack to one face of the intermediate by the nucleophile forming almost exclusively the trans-product.

Scheme 15 shows a variety of mechanistic reaction pathways that the 2-acetylpyranose structures can go through. The principal reaction pathway forms the trans product almost exclusively however the higher energy secondary reaction pathway can lead to the formation of the cis product. Industrial formation of oligosaccharides must be completed with incredibly high levels of selectivity <99% because the amount of possible side products is compounded on each glycosidation that occurs. In order to understand the level of selectivity achieved we need to look at the energies associated with each intermediate with and without neighbouring group participation.
Scheme 16 shows the four lowest energy conformational isomers of the intermediate oxonium cation that I could find. Unfortunately the orientation of the methyl groups in space is very sensitive as they appear to fall into local minima during the energy minimisation calculations often masking to true lowest energy conformation. The conformations analysed are those shown in Scheme 15 using an MM2 forcefield (1a and 1b, 2a and 2b).
| Energy Iteration | 1a (kcal/mol) | 1b (kcal/mol) | Energy Difference (kcal/mol) | 2a (kcal/mol) | 2b (kcal/mol) | Energy Difference (kcal/mol) |
| Stretch | 2.2640 | 2.1839 | -0.0801 | 2.1748 | 2.2827 | 0.1079 |
| Bend | 12.3408 | 9.2338 | -3.1070 | 9.0322 | 8.5583 | -0.4739 |
| Stretch-Bend | 0.9357 | 0.8254 | -0.1103 | 0.8242 | 0.8596 | 0.0345 |
| Torsion | 1.6209 | 2.4156 | 0.7947 | 2.6240 | 1.4891 | -1.1349 |
| Non-1,4 VDW | -0.9599 | -3.3708 | -2.4109 | -3.0504 | -4.4009 | -1.3505 |
| 1,4-VDW | 19.1476 | 19.3557 | 0.2081 | 19.5860 | 18.9488 | -0.6372 |
| Charge-Dipole | -23.1042 | -1.4462 | 21.6580 | -10.5575 | 7.7531 | 18.3106 |
| Dipole-Dipole | 7.2977 | 4.0423 | -3.2554 | 5.4056 | 3.8102 | -1.5954 |
| Total Energy | 19.5427 | 33.2396 | 13.6969 | 26.0389 | 39.3010 | 13.2621 |
From Scheme 16 we can see that the two secondary pathway orientations are significantly higher in energy than their primary pathway counterparts (ca. 13kcal/mol). This is as to be expected from the significant distortion of the acetyl groups out of the plane of the molecule. As previously mentioned the MM2 energy minimisation calculations suffer from falling into local minima with respect to the spatial orientation of the -OMe groups. In order to compensate for this we can minimise the energy using a more advanced calculation - MOPAC PM6 which is more thorough in its minimisation technique (Scheme 17).
| Energy Iteration | 1a (kcal/mol) | 1b (kcal/mol) | Energy Difference (kcal/mol) | 2a (kcal/mol) | 2b (kcal/mol) | Energy Difference (kcal/mol) |
| Heat of Formation | -91.6590 | -73.1138 | 18.5452 | -89.2416 | -77.3982 | 11.8434 |
From both Schemes 16 band 17 we can see that the energy of the secondary pathway oxonium ion is consistently higher in energy which is consistent with the high level of selectivity seen. The MOPAC/PM6 calculations show a dramatically larger difference in energy between isomers 2a and 2b than 1a and 2b. We can rationalise this by considering the distances between the carbonyl oxygen of the acetyl group and the anomeric carbon. The results are displayed in Scheme 18.
| 1a | 1b | 2a | 2b | |
| MM2 | 2.6Å | 3.2Å | 2.7Å | 3.2Å |
| MOPAC/PM6 | 1.6Å | 3.5Å | 1.6Å | 3.8Å |
From Scheme 18 we can see that for isomers 1 and 12 the MM2 energy minimisation places the secondary pathway acetyl carbonyl further away from the anomeric carbon. This is obvious considering the increased strain between the structures,and the MOPAC/PM6 optimised structures tell the same story. All of the MOPAC/PM6 optimised primary reaction pathway structures show a considerable shortening of the acetyl carbonyl - anomeric carbon distance. This may indicate a degree of delocalisation of the oxonium cation over the acetyl group as the MOPAC/PM6 calculation does not take into account the specified location of positive charge but instead places it in the area of lowest energy. By inspection of the intermediates from the MOPAC/PM6 optimisations (scheme 17) the low energy isomers 1a and 2a show distinct 5-membered ring geometry around the acetyl carbonyl and anomeric carbon centres, lending weight to this prediction. This apparent delocalisation is not however seen in isomers 1b 2b where the carbonyl oxygen is far removed from the anomeric carbon, here the increase in strain and trans-annular effects must outweigh the gain in stabilisation by delocalising the charge over the carbonyl.
However, in order to complete the picture we must examine the cyclic acetoxonium ion and how the conformational isomers of this compare to those of the oxonium ion. Again we will examine these using an MM2 energy minimisation and a MOPAC/PM6 optimisation.
| Energy Iteration | 3a (kcal/mol) | 3b (kcal/mol) | Energy Difference (kcal/mol) | 4a (kcal/mol) | 4b (kcal/mol) | Energy Difference (kcal/mol) |
| Stretch | 1.8177 | 2.8124 | 0.9947 | 2.0066 | 2.7025 | 0.6959 |
| Bend | 18.0245 | 17.6264 | -0.3981 | 13.7079 | 17.4043 | 3.6964 |
| Stretch-Bend | 0.7191 | 0.8212 | 0.1021 | 0.7003 | 0.7889 | 0.0886 |
| Torsion | 8.8075 | 8.0535 | -0.7540 | 8.1425 | 8.2599 | 0.1174 |
| Non-1,4 VDW | -2.2956 | -2.2330 | 0.0723 | -2.4098 | -2.5858 | -0.1760 |
| 1,4-VDW | 17.9201 | 19.2392 | 1.3191 | 17.7951 | 19.4627 | 1.6676 |
| Charge-Dipole | -10.0529 | 1.7196 | 11.7725 | -9.7734 | 0.0530 | 9.8264 |
| Dipole-Dipole | -1.0920 | -1.9216 | -0.8296 | -2.0658 | -1.7745 | 0.3213 |
| Total Energy | 33.8484 | 46.1175 | 12.2691 | 28.1034 | 44.3410 | 16.2370 |
| Energy Iteration | 1a (kcal/mol) | 1b (kcal/mol) | Energy Difference (kcal/mol) | 2a (kcal/mol) | 2b (kcal/mol) | Energy Difference (kcal/mol) |
| Heat of Formation | -91.6604 | -66.8492 | 24.8112 | -91.6517 | -60.8741 | 30.7776 |
We can infer from Scheme 17 and 20 that the MOPAC/PM6 optimisation does include delocalisation of the oxonium cation across the acetyl group when not explicitly specified because the heats of formation for the oxonium cation and acetoxonium cations are practically the same. It is evident again from Schemes 19 and 20 that the intermediates from the primary reaction pathway are significantly lower in energy than their secondary pathway counterparts. The unfavourable kinked 5-membered acetoxonium ring seen in 3b and 4b doesn't allow as good a resonance stabilisation as the more planar rings in 3a and 4a due to poorer orbital overlap. The higher energy intermediates 3b and 4b are therefore unlikely to form hence giving rise to the high level of trans-slectivity achieved in neighbouring group participation - glycosidation.
Module 5: 13C NMR Prediction of a Taxol derivative
As we discussed earlier in Module 2, the intermediates in the synthesis of Taxol resulting from an oxy-cope rearrangement are in fact atropisomers that slowly interconvert on standing. In fact the compound analysed in Module 2 is not a true intermediate but bears a close resemblance, the atropisomers produced have a dithiane functional group off of the cyclohexane ring and a methyl group off of the fused cyclohexane bond (Scheme 21).


It is possible to predict the NMR spectrum of compounds modelled using computational software. The lowest conformational isomer of the compound must first be selected otherwise the prediction will be inaccurate. Fortunately the lowest energy conformers of similar compounds had been calculated in Module 2 and hence there was little problem in performing this technique. The molecule was optimised using an MM2 forcefield and the results are shown (here). Two procedures are used in order to predict the NMR of the compound, firstly a more advanced energy minimisation calculation using a DFT method and 6-31G(d,p) basis set with polarisation and a CPCM solvation field (benzene). Secondly, the NMR prediction was run using a Mpw1pw91(d,p) method with a 6-31G basis set with polarisation and a CPCM solvation field (benzene). The results of the calculation were referenced with respect to TMS modelled by Mpw1pw91(d,p) GIAO solvation in Benzene. The shifts obtained were compared against literature values (75MHz, C6D6) for the pure compound (Scheme 22). [13] From Scheme 22 we can see that the predicted values are very close to the reported values except for the carbon bonded to the dithiane group. It is common for carbons attached to heavier nuclei to suffer from spin-orbit coupling errors in the calculation and this is seen here by the calculated shift being some 10ppm out from the reported value. Apart from the error caused by the C-S bonds all of the other shifts are within 4ppm of the actual shift and the majority within 2ppm. This technique is very powerful and confirms that the identified isomer has in fact been assigned correctly in the literature.
Module 6:Acid catalysed equilibration of Acortatarin Spiroketals, anomers that aren't and journal discrepancies in structure, what is going on?


Acortatarins A and B are a class of pyrolle based spiroketal alkaloids that are derived from the roots of Acorus Tatarinowii.[15] The molecules possess high levels of anti-oxidant properties allowing them to be used as potential treatments for diabetic complications and certain types of cancer.[16] Unfortunately a recent effort in 2010 to isolate the alkaloids for further investigation only managed to extract aorund 10mg of the alkaloids from 50kg of the A. Tatarinowii roots, leaving an obvious need for a successful synthetic strategy. [17]
The difference between Acortatarin A and B is the presence of the hydroxy group alpha to the spiro-ketal centre and the two Acortatarin molecules exist as pairs of conformational isomers around this centre (Scheme 24). The structures of Acortatarin A and B have been the subject of some controversy as the original absolute conformations were revised by the use of 2D ROESEY NMR and crystallographic techniques, therefore it presents a good opportunity for computational analysis of the isomers.[18] The isomers exist as either the α-spiroketal (1a and 2a) or the β-spiroketal (1b and 2b), similar to α- and β- anomers in saccharide chemistry.
When a single isomer of Acortatarin A or B is dissolved in a solution of CH3OD with 3 equivs. of p-TsOH for 10mins at room temperature an epimerization equilibrium forms between the two α- and β-spiroketals with the α-isomer predominating (65:35) in both cases.[19] In order to understand this we need to look at the difference in energy between the four structures. We are going to look at the energies of the different isomers using an MM2 minimisation, an MMFF94 minimisation and a MOPAC/PM6 minimisation (Scheme 26-28).
| Energy Iteration | 1a (kcal/mol) | 1b (kcal/mol) | Energy Difference (kcal/mol) | 2a (kcal/mol) | 2b (kcal/mol) | Energy Difference (kcal/mol) |
| Stretch | 1.2205 | 1.2478 | 0.0273 | 1.3986 | 1.2229 | -1.1757 |
| Bend | 23.2903 | 24.1696 | 0.8793 | 25.4424 | 25.0467 | -0.3957 |
| Stretch-Bend | 0.3542 | 0.3656 | 0.0114 | 0.4205 | 0.3901 | -0.0304 |
| Torsion | 5.8353 | 6.2616 | 0.4263 | 6.2175 | 5.4892 | -0.7283 |
| Non-1,4 VDW | -4.6002 | -5.5754 | -0.9752 | -5.6370 | -7.4014 | -1.7644 |
| 1,4-VDW | 13.1238 | 12.7959 | -0.3279 | 13.5781 | 13.7243 | 0.1462 |
| Dipole-Dipole | 3.5507 | 3.5441 | -0.0066 | 3.0602 | 3.3602 | 0.3000 |
| Total Energy | 42.7746 | 42.8092 | 0.0346 | 44.2804 | 41.8318 | -2.4486 |
| Energy Iteration | 1a (kcal/mol) | 1b (kcal/mol) | Energy Difference (kcal/mol) | 2a (kcal/mol) | 2b (kcal/mol) | Energy Difference (kcal/mol) |
| Final Energy | -52.0963 | -54.5001 | -2.4038 | -98.4112 | -92.1970 | 6.2142 |
| Energy Iteration | 1a (kcal/mol) | 1b (kcal/mol) | Energy Difference (kcal/mol) | 2a (kcal/mol) | 2b (kcal/mol) | Energy Difference (kcal/mol) |
| Final Energy | -184.2238 | -182.9517 | 1.2721 | -217.9825 | -223.5681 | -5.5856 |
From Schemes 26 to 28 we can see that there is no real correlation between whether the α- or β-spiroketal is the most stable isomer. From the naming of the spiroketals we can infer that they can exist in two conformations, an α-anomer and a β-anomer. From our knowledge of saccharide chemistry the anomeric effect is a proposed argument for why the α-anomer predominates over the β-anomer. The reasoning for the anomeric effect centres on the stereoelectronics of the structure whereby the oxygen lone pair donates into the antiperiplaner axial C-O σ* bond, this obviously cannot occur if the C-O bond is equatorial. From the equilibrium data, the α-spiroketal predominates in both cases, lending weight to an anomeric argument in the stability of these structures (Scheme 29.)

This argument is all well and good however this effect is not manifested in the results of the MM2, MMFF94 or MOPAC/PM6 optimised structures. To answer this we need to understand the mechanics of the optimisation calculations. The MM2 and MMFF94 optimisation techniques do not take into account electron orbital interactions and so do not recognise the anomeric effect, whereas the MOPAC/PM6 calculation weakly takes into account these interactions it is in no way compelling. If we look at the two structures of the spiroketals from any of the calculations we can see that the conformation in 3d-space is not as clear cut as that portrayed in Scheme 29. The planar pyrrole ring flatens out the pyran ring forming a half chair while the furan ring adopts an envelope conformation. The combination of these factors forces the two epimers to both adopt this doubly anomeric stabilised α- conformation. This is very confusing as the literature clearly states that both an α- and β-spiro conformation exist.
...a further twist (no pun intended)
At this point a sensible approach would be to examine the literature crystallographic results. It is clearly visible in the paper - Stereoselective Synthesis of Acortatarins A and B, Org. Lett., 2012, 14 (17), pp 4442–4445 - that the crystallographic data used to illustrate the conformation of the molecule originates from the paper that they claim wrongly assigned the conformation of the structure in the first place. The crystallographic file of the alleged most stable α-Acortatarin A (Scheme 30)[20] is shown to correlate to their revised structure and to the crystallographic file of the origianl but not to the molecule in their paper.
|
If we compare the revised α-Acortatarin A[21] to the original α-Acortatarin A[22] we do not see this proposed β-anomer conformation in the original, instead we see a well revealed double anomeric effect the same as the revised structure. If these isomers were assigned purely on whether they exhibited an anomeric affect they would both be classed as α-anomers. To assign any of them with this notation just seems ridiculous and very misleading.
...confused? So am I!

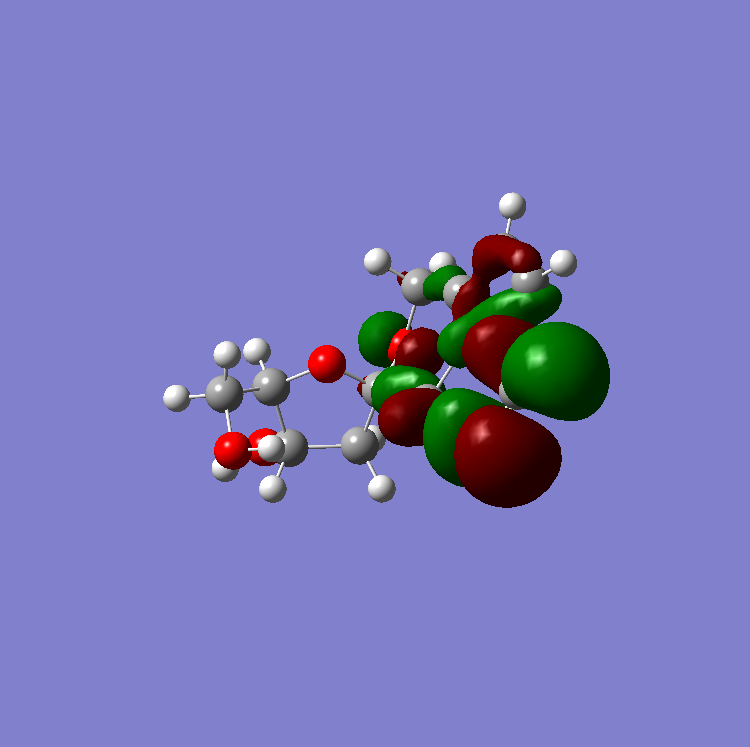
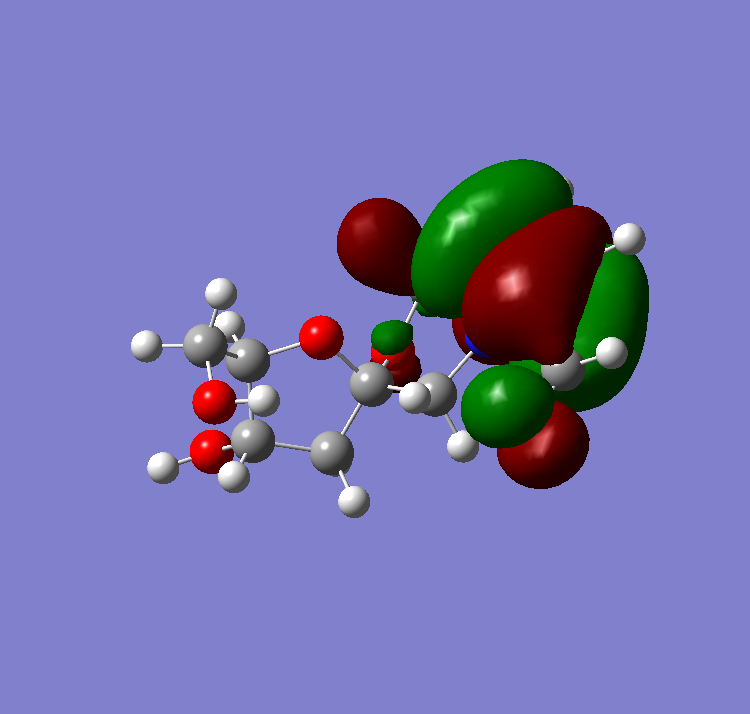
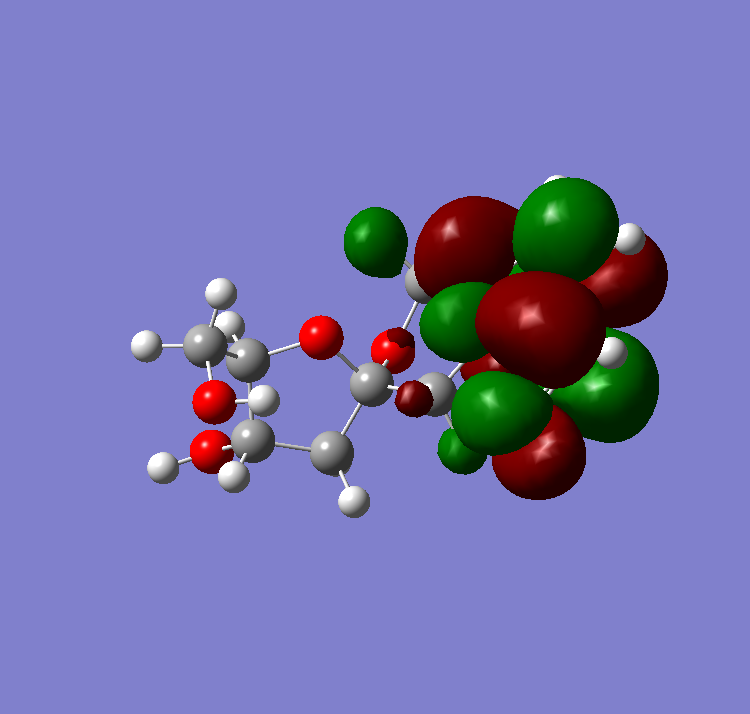
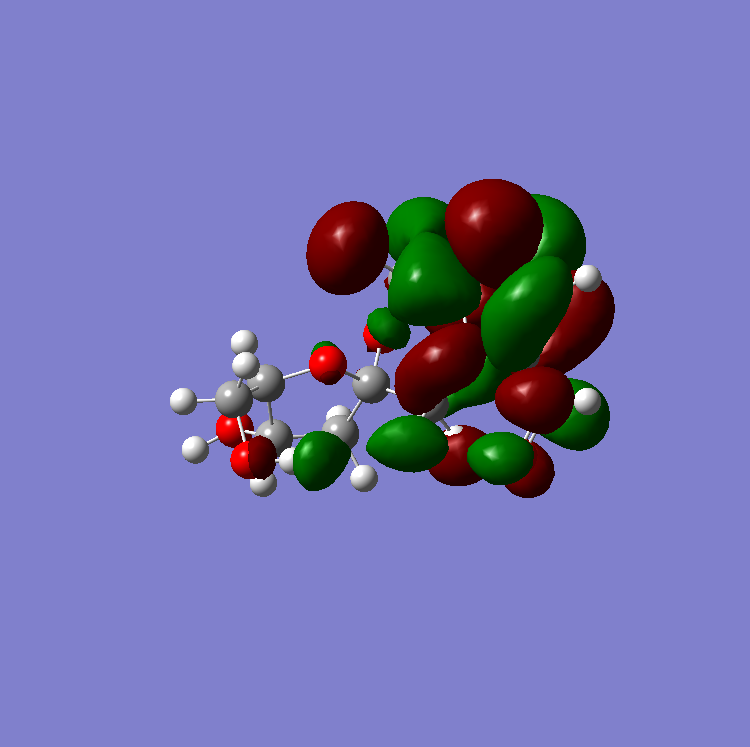
To make like a little easier lets just consider the structure of Acortatarin A. If we look at Scheme 30 the conformation is incredibly close to that of the MOPAC/PM6 optimised structure and so I am going to use the MOPAC/PM6 structures herein. To get a complete view of the orbital interactions we need to use Gaussian to find the lowest energy conformation. We can use Gaussian to view the molecular orbitals of the molecules to see if this sheds any light on the two molecules. The HOMO and LUMO for the two isomers calculated using a DFT/B3LYP method and 6-31G are incredibly similar (HOMO-1, HOMO, LUMO, LUMO+1). I cannot find the exact molecular orbital containing the C-O σ* bond but the oxygen lone pairs on both molecules do line up antiperiplanar to the C-O σ* bonds. Frustratingly this provides no clear distinction between the two structures.
In order to try and make sense of this we can look at the NMR data for the two structures. NMR is a technique which is very sensitive to the local environment of the atoms, clearly indicating whether there are any variations in the structure. Yet again however we run into problems when analysing the NMR data given in the literature. Amazingly the reference used to compare the NMR data of their structure of Acortatarin A is the same reference of the compound they say has been revised, even more confusing is that they match.

Scheme 23 shows the different 13C NMR shifts from the literature and predicted. There is an error present in the predicted NMR due to the TMS reference in methanol and accordingly the TMS was modelled in chloroform using a wB97XD/cc-pVDZ method. The error in the predicted NMR is evident by the rather large deviation from the literature values. Although one can see that the predicted NMR is close enough to match to the structure, it is not evident which structure (1a or 1b) that is. Too add to the confusion the original and revised structures have exactly the same shifts.
A more conclusive method of distinguishing between the two isomer of Acortatarin A (1a and 1b) would be to look at the optical rotation. The optical rotation can be calculated with Gaussian using a CAMB3LYP method and a 6-311G(d,p) basis set at 589nm in methanol. The results of the calculation are shown below:
Acortatarin A (1a) [α](589nm)=+210.88o, Acortatarin A (1b) [α](589nm)=-194.27o
By optical rotation their is a clear distinction between the two isomers 1a and 1b. More importantly the magnitude of the two values renders them more akin to enantiomers than simple conformational isomer. I believe that this is yet more evidence suggesting that both structures adopt an equatorial conformation. The literature value of the compound adopting the 1a conformation is yet more compelling, the revised structure has an optical rotation in methanol of +200o. The optical rotation is extremely sensitive to changes in structural conformation, even a minor deflection in bond angle can lead to a value 50% out. The difference between the predicted and literature values for Acortatarin A (1a) is close enough to confirm the structure, it is clear that if the so called β-isomer was present, this number would be drastically different.
...a simple mistake?
So lets review the structures that are causing confusion. The original structure as drawn in the literature is shown as a MOPAC/PM6 optimised structure in Scheme 33. The most shocking part is that the crystal structure and the drawn structure do not match. The original structure was elucidated using 2D NMR (ROESY and COSY) but it seems not the original crystallographic file which is the revised structure.
|

Looking at the NMR from Scheme 34 and comparing it to the NMR of the original proposed structure as shown in Scheme 32 we can see that the values are incredibly similar and within the tolerance I would have in assigning a structure of this type. The key in unlocking this error is with the predicted optical rotation for the proposed original structure. The optical rotation was calculated with Gaussian using a CAMB3LYP method and a 6-311G(d,p) basis set at 589nm in methanol. The results of the calculation are shown below:
Original proposed Acortatarin A [α](589nm)=-165.37o
The value they claim for their optical rotation is +200o, the complete opposite rotation to that predicted. I believe that this should have been the most compelling factor in making them reassess their original structure.
Conclusion
The α- and Β-spiroketals
From the data we have seen the claim in literature that the predominating isomer that forms in the acid-catalysed equilibrium does so out of a double anomeric affect is not seen from the optimised gaussian structures. Any attempt to force the tetrahydrofuran ring to adopt its β-equatorial position leads to flatening of the ring forcing it axial. Both the α- and β-spiroketals show a double anomeric effect and there appears to be very little difference in energy between them. The NMR shows very little variation between the two structures, much less than might be expected if the tetrahydrofuran ring occupied a formal equatorial and axial position. The modulus of optical rotation of the two isomers is incredibly similar, it may well be a coincidence but such a conformational change would unlikely lead to such a similar value. Taking into account all of these factors it seems highly unlikely that the cause of the equilibrium is thermodynamic or as a result of an anomeric effect. The only other possibility is a kinetic factor however the molecular orbitals for both of the compounds are practically identical. The result of the apparent equilibrium is therefore difficult to identify, it presents an interesting problem and one which given more time to solve I believe would be very interesting. Until however the time is taken to isolate these separate isomer and analyse them properly the structure cannot be confirmed for sure.
Identifying the wrong structure
It is quite frankly unbelievable that such a glaring error was allowed to occur in literature. The original paper proposing this structure have clearly misdrawn their structure from their crystallographic data and not checked simple computational calculations that show that their proposed structure simply does not fit the other data such as the optical rotation. Non-sensically the paper then revising the structure referenced the paper they were correcting for NMR data and other properties. The time spent on by the original team analysing complex 2D NMR spectra would have been much better spent just checking the crystal structure and computational calculations. Undoubtedly the revised structure is the true structure of naturally occurring Acortatarin A by optical rotation, NMR and crystallographic studies, and just goes to prove how invaluable computational analysis in the identification of complex molecules can be.
Technical Notes
All molecules were modelled using ChemDraw Pro v12 or GaussView 5 and optimised using ChemBio3D Ultra v12 or Gaussian 09. All MM2 and MMFF94 forcefield calculations were conducted using a minimum RMS Gradient of 0.01. All MOPAC energy calculations were conducted using the PM6 method with a closed shell wave function and EF optimizer and minimum RMS gradient of 0.1. Gaussian optimisation and MO calculations were conducted using a DFT/B3LYP with a 6-31G basis set. Gaussian NMR predictions were conducted using a MPW1PW91 method with a 6-31G(d,p) basis set and CPCM solvent simulation. Gaussian optical rotation calculations were conducted using a CAM-B2LYP method with a 6-311G(d,p) basis set and IEFPCM solvent simulation. All complex Gaussian calculations were sent to the Imperial College Chemistry SCAN cluster. I have not included the NMR Spectra in the document because I changed the numbering system that was present on the spectra and the overlapping lines and numbers made it unintelligible, however they are available upon request.
References
- ↑ http://www.icis.com/Articles/2007/07/16/9044783/chemical-profile-dicyclopentadiene.html
- ↑ http://www.icis.com/Articles/2007/07/16/9044783/chemical-profile-dicyclopentadiene.html
- ↑ Merck Index, 13th edition, 2767.
- ↑ DOI: 10.1021/ja00947a033
- ↑ Gilchrist, T. L., Storr, R. C., Organic reactions and orbital symmetry, 1979, Cambridge University Press, p. 120
- ↑ Petroleum and Coal, Vol. 45, 3-4, 105-108
- ↑ Petroleum and Coal, Vol. 45, 3-4, 105-108
- ↑ Merck Index, 13th edition, 7052.
- ↑ DOI: 10.1021/jo00109a020
- ↑ DOI: 10.1021/ja00004a040
- ↑ DOI: 10.1021/ja00398a003
- ↑ DOI: 10.1021/jo00019a015
- ↑ DOI: 10.1021/ja00157a043
- ↑ http://www.vitagreen.com/en/ingredients/list/?prefix=c
- ↑ Tong, X.-G.; Zhou, L.-L.; Wang, Y.-H.; Xia, C.; Wang, Y.; Liang, M.; Hou, F.-F.; Cheng, Y.-X. Org. Lett. 2010, 12, 1844–1847
- ↑ Valko, M.; Leibfritz, D.; Moncol, J.; Cronin, M. T. D.; Mazur, M.; Telser, J. Int. J. Biochem. Cell Biol. 2007, 39, 44–84.
- ↑ Tong, X.-G.; Zhou, L.-L.; Wang, Y.-H.; Xia, C.; Wang, Y.; Liang, M.; Hou, F.-F.; Cheng, Y.-X. Org. Lett. 2010, 12, 1844–1847.
- ↑ DOI: 10.1021/ol3019456
- ↑ DOI: 10.1021/ol3019456
- ↑ DOI: 10.1021/ol3019456
- ↑ DOI: 10.1021/ol3019456
- ↑ DOI: 10.1021/ol100451p