Rep:Mod:adb129
MgO Experiment
Abstract
The properties of a Magnesium Oxide fcc crystal were explored under the Harmonic and Quasi-Harmonic approximation using the graphical user interface DL Visualise with the simulation program GULP. Vibrational energy levels were calculated and used to compute the free energy and predict the expansion of the material on heating. The crystal was then expanded using molecular dynamics and the results of the approximations compared.
Introduction
Harmonic Approximation
Magnesium oxide forms a face centred cubic[1] ionic crystal. At all temperatures above 0K the atoms within the structure vibrate around their equilibrium positions. For an infinite crystal this generates a continuum of vibrational modes. Each possible vibration can be labelled with a k-vector relating to the direction and wavelength of the vibration[2]. k = 2π/λ
The larger the value of k, the more nodes present in the wave function and thus the higher the frequency of vibration. Working in reciprocal space, k can be plotted against frequency to generate a dispersion curve. The first Brillouin zone confines the set of independent values for k between -π/a and π/a. The origin point on this graph occurs at k point (0,0,0) and has the label Γ. At this point all vibrations are occurring in the same direction.[2]
The acoustic and optic branches manifest[3] from the expansion beyond the one dimensional longitudinal motion to include sideways motion and come from the solutions to the equations of motion. The direction of u determines polarisation (longitudinal, transverse or mixed) and can be degenerate because of symmetry. In a three dimensional lattice with s atoms per unit cell there are 3s phonon branches consisting of 3 acoustic and 3s-3 optical branches.

There are two atoms in the MgO crystal cell thus 6 vibrational bands are present. When drawn for the k points this gives a phonon band structure plot. At various points in k space the vibrational modes will have the same energy and so not present as the full 6 branches in the dispersion curve.

The Density of States is a useful probability distribution that summarises the distribution curves. It averages over all k points to yield the population of vibrational modes along the k-path. The accuracy of the DOS averages relates to the grid size the calculation is carried out over. The more k-points considered, the more the plot transitions into smooth curves between defined peaks away from the four distinct peaks of the 1x1x1 grid size with only one k point considered.
Summation of all vibrational bands of all k points equates to a summation over all vibrational energy levels and allows for computation of the free energy of the crystal under the harmonic approximation. Evib = (n+1/2)ħω. The free energy can be considered as an equivalent to the DOS graph because more k points considered directly relates to more contributions to the free energy being included in the sum.
Quasi-Harmonic Approximation
The harmonic approximation breaks down as the internuclear distance moves away from the equilibrium bond distance. Whilst it is a reasonable approximation at the minimum of the parabolic function of potential energy against intermolecular distance it breaks down at more intense vibrations. This is because in the harmonic oscillator approximation the average bond length does not vary with energy and so a correction is needed.
The quasi harmonic approximation is used here to describe the volume-dependent thermal effects and is based on the assumption that the harmonic approximation holds for every value of the lattice parameter but that the lattice parameter is adjustable.
The quasi-harmonic approximation displays many characteristics of the Lennard-Jones function. Increasing temperature leads to increased occupation of the vibrations resulting in greater interatomic separation. Near the maxima of vibration there is a significant internuclear repulsion. This increase in interatomic separation results in an overall increase in lattice parameter across the crystal and thus an increase in volume.
Molecular Dynamics
Molecular dynamics simulates the motions of the atoms in the real material. It is used to evolve the system in time according to Newtons law. The atoms follow the trajectories they would in reality and properties are computed as time averages of their behaviour. This is much more computationally expensive but avoids the use of the harmonic approximation.
Experimental
All simulations were run using the graphical user interface DL Visualise v2.4.1 with the General Utility Lattice Program (GULP) in the RedHat Linux environment. The GULP Potential Parameters were set to force field ionic.lib as the shell environment.
The binding energy of the MgO crystal per primitive unit cell was calculated using a single k point calculation under GULP. The phonon dispersion curve was calculated using a GULP Phonon Dipsersion calculation run along the conventional path in k-space W-L-G-W-X-K with phonons computed at 50 points on this path.
The Phonon Denisty of States, Optimisation of Helmholtz Free Energy and Thermal Expansion of MgO were calculated using Lattice Dynamics. The optimal grid size of k-points to be used for these calculations was established empirically via monitoring of convergence to a single value using the the DOS plot and incremental increases of grid size.
To study the thermal expansion of MgO the simulation optimised the Gibbs free energy using a k-space grid of shrinking factors 25x25x25 at incrementally increasing temperatures between 0K to 1000K in steps of 100K.
Molecular Dynamics was used to study the thermal expansion of MgO under the NPT ensemble. A timestep of 1.0 femtosecond was used with equilibration and production steps of 500. Sampling and Trajectory write steps were set to 5.
Results and Data
MgO Internal Energy
The crystal structure is specified by the unit cell. Here we describe the MgO primitive cell as a rhombohedron of side 2.9783A and internal angles 60 degrees. The conventional cell has four times the volume of the primitive cell but better reflects the symmetry of the MgO crystal due to its cubic nature.
The report generated from a single point calculation gives the interaction potentials that describe the MgO bonding. The total energy is due to interatomic forces (short range repulsions and electrostatic interactions) by summing over the infinite lattice. The input value we gain for this is -41.07531759. This is the binding energy of the crystal.
Calculating the Phonon modes of MgO
Every possible vibration of the crystal can be labelled with a k-vector. In order to understand the variation of frequencies with k and visualise the phonon modes, the phonon frequencies are computed along a path in k-space, W-L-G-W-X-K and a phonon dispersion curve generated.[4]
All of the possible variation of the infinite lattice of MgO can be computed in this way if sufficient k points are calculated at. A density of states summarises the dispersion curves and thus is a useful tool to approximate the free energy sum over all the vibrations of the lattice. It is an average over all k points on a specified grid that yields the density of modes.
The density of states thus varies with grid size due to the changing numbers of k-points being sampled. The more k-points the closer to the infinite crystal and the more accurate the Density of States but the more computationally expensive. As the grid size was increased, the peaks became smaller and more frequent, gradually becoming a continuous graph.
The Density of States was calculated at increasing grid sizes. For the 1x1x1 grid the Density of States is calculated at the k-point (0.5, 0.5, 0.5), L, where the DOS mirrors the Phonon Dispersion with four distinct peaks, two at double intensity due to degeneracy at the lower frequencies.

As grid size is increased more k points are sampled and thus the Density of States becomes more representative of that of the infinite crystal. To establish an appropriate grid size, the shrinking factors were incrementally increased in value until little discernable difference in appearance, beyond slight smoothening of the peaks, was made that could justify the additional computational time. This was determined to be a grid of 20x20x20. Whilst significantly larger grids did still show a small amount of difference the step change compared to that between smaller grid sizes was insignificant and it can be reasonably well assumed that this grid size will suffice for most purposes as all important features are clearly visible.
| Grid Size | DOS Plot |
| 5x5x5 | 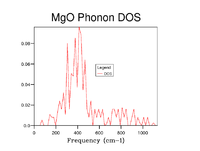
|
| 10x10x10 | 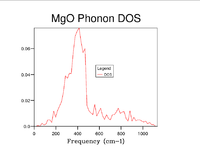
|
| 15x15x15 | 
|
| 20x20x20 | 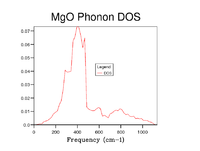
|
| 25x25x25 | 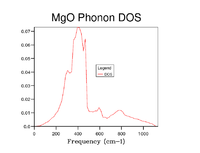
|
| 50x50x50 | 
|
The crystals size in k space will directly impact the grid size needed to accurately represent all phonon modes. Thus for calcium oxide with a very similar lattice constant – 4.800[5] to MgO’s 4.12 it can be assumed that a grid size of 20x20x20 will be sufficient to determine the density of states. Zeolites such as Faujasite have a significantly larger lattice parameter (24.7) and so in k space is significantly smaller, so may only need a grid size of 5x5x5 scale. Many metals have a smaller lattice parameter, for example lithium which forms a bcc structure with lattice parameter 3Å and so conceivably needs a much larger grid to be accurate in the range of 40x40x40.
Computing the Free Energy
The Helmholtz free energy becomes increasingly negative with increasing grid size. This is due to additional contributions to the energy being taken into consideration with the increasing number of k points. The Helmholtz free energy can be considered as an equivalent to the DOS graph because of this relationship to grid size. Thus at the grid size when no change is made to the energy as more k points are considered it can be assumed that a good approximation to the DOS and Helmholtz energy of the infinite crystal has been reached. It can be seen that the energy converges towards -40.9264 eV
| Grid Size | Helmholtz Free Energy (eV) | ΔE (eV) |
| 1x1x1 | -40.930301 | - |
| 2x2x2 | -40.926609 | 0.003692 |
| 3x3x3 | -40.926432 | 0.000177 |
| 4x4x4 | -40.926450 | 0.000018 |
| 5x5x5 | -40.926463 | 0.000013 |
| 10x10x10 | -40.926480 | 0.000017 |
| 12x12x12 | -40.926481 | 0.000001 |
| 15x15x15 | -40.926482 | 0.000001 |
| 20x20x20 | -40.926483 | 0.000001 |
| 25x25x25 | -40.926483 | 0 |
| 30x30x30 | -40.926483 | 0 |
This convergence of the Helmholtz free energy allows for simulations to be run that balance accuracy with computational time dependent on the level of accuracy needed. To achieve accuracy to 1.0 and 0.5 meV a grid of 2x2x2 will suffice, for 0.1 meV the larger 3x3x3 grid is needed because the 2x2x2 grid would instead round up to -40.9625 eV rather than the more accurate -40.9624 eV.
The size of lattice parameter is likely to impact this convergence, thus calcium oxide would likely require a very similar grid size. For a larger lattice parameter, the volume occupied in k space is smaller and so a smaller grid size would be needed to gain a representative view for Faujasite. The opposite is then true for a metal such as Lithium which would require a larger grid size.
The Thermal Expansion of MgO
Under the quasi-harmonic approximation we optimised the structure of MgO with respect to the free energy at a number of temperatures from 0 to 1000K in 100K steps. To minimise the free energy with respect to the structure, GULP computes the internal energy and phonons at a sequence of geometries. Thus, the optimal lattice parameter and Gibbs free energy change according to their dependence on Temperature. All simulations were run on a 20x20x20 grid.
Gibbs Free Energy

The plot of Gibbs free energy against temperatuare generates a negative polynomial curve. This shape was anticipated as increasing temperature increases entropy, thus making the Gibbs free energy more negative. The negative gradient of the curve shows the crystal becoming more disordered as temperature increases and the form of the trendline indicates a second order dependence.
Entropy can be considered using the equation S = kblnW[6]. As such, entropy can be considered a measure of how many microstates within a microsystem are available. As temperature increase the number of accessible vibrational energy levels increases and as such, entropy increases. This manifests as the increasingly negative free energy.
Lattice Parameter
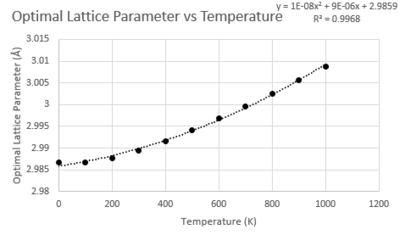
The lattice parameter increases with temperature. This is as to be expected as a response to the increase in entropy within the system. The relationship appears to be quadratic.
Coefficient of Thermal Expansion
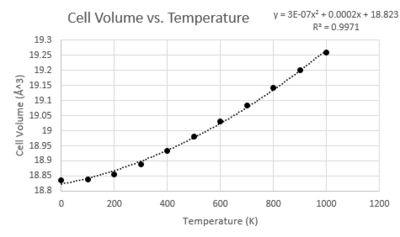
The thermal expansion coefficient can be calculated using the simple relationship to volume and temperature: α = 1/Vo(δV/δT)p
Here the gradient from the linear relationship section of the graph has been used. Inputting this value into the above equation gives a thermal expansion coefficient of 2.67x10⁻⁵ which is in relatively close agreement with the literature value of 3.57 x10⁻⁵[7].
The fundamental approximation here is that the relationship between cell volume and temperature can be assumed to be linear. There is some evidence from the graph that there is deviation from this linear relationship at both high and low temperature. These deviations likely arise from the electronic interactions not considered under the quasi-harmonic approximation which will impact the thermal expansion coefficient when they become more dominant in the vibrational modes of the system at the extremes of temperature.
Molecular Dynamics
All calculations were run on a 32 atom crystal and as such all data gained was divided by 32 to enable comparison to the primitive cell used for the Quasi-Harmonic data collection.
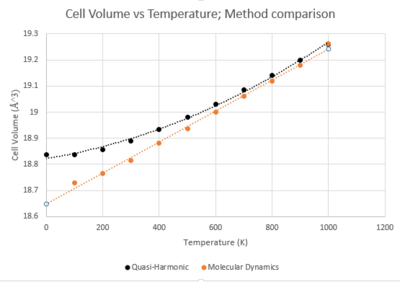
It can be seen from Figure 7 that not all aspects of the two approximations can be compared, as the very lowest range of temperatures cannot be used in Molecular Dynamics calculations. This is because molecular dynamics is based on classic quantum mechanics which assumes no energy can be present at absolute zero. This causes an error response when sampling in the very low range as there are no vibrations present to generate a reading.
The plots of the two methods converge at higher temperatures and diverge at lower ones. In this middle range of temperatures between the crystals melting point and zero point energy it can be seen that where the approximation is primarily dominated by phonon interaction it seems to be a good approximation.
A number of errors would be expected within the Molecular Dynamics plot as only an average value is taken. This could only really be overcome by taking multiple runs at each temperature and plotting as a range.
Despite this inherent error, the thermal expansion coefficient for the Molecular Dynamics plot is found to have a value of 3.22x10⁻⁵ which is much closer to the literature value of 3.57 x10⁻⁵[7] than the Quasi-Harmonic approximation.
The lower values from the quasi-harmonic approximation are due to the thermal excitations of electrons not being included. At increasingly high temperatures, the plots should follow the same relationships as previously, with quasi-harmonic proceeding quadratically and molecular dynamics proceeding with a linear relationship.
Thus, it can be seen from the data that the Quasi-Harmonic Approximation is useful in study of low range temperatures to incorporate zero-point vibrations and that Molecular Dynamics is essential to gain meaningful results at higher temperatures.
Conclusions
Overall it is apparent that each technique can be useful in certain circumstances. The Harmonic approximation provided a low computational cost method to probe the system of study to set up the basic parameters for further research. The Quasi-Harmonic Approximation and Molecular Dynamics were shown to have their own strengths and weaknesses, with neither producing exactly the results of literature and experiment but Molecular Dynamics coming very close indicating it is an incredibly powerful tool to study the thermal expansion of crystal structures.
There is great scope for further study, in particular using GULP to analyse a variety of alternative crystal structures to see how the differences between the methods manifest themselves in compounds with changing levels of electronic interaction contribution and varying lattice parameters.
References
- ↑ Inorganic Chemistry, Shriver, P Atkins, OUP, Oxford, 5th Edition, 2009.
- ↑ 2.0 2.1 How Chemistry and Physics Meet in the Solid State, R. Hoffmann, Angewandte Chemie International Edition, 1987, 26, 846-878
- ↑ C. Colvard, T. A. Gant, M. V. Klein, R. Merlin, R. Fischer, H. Morkoc, and A. C. Gossard, Phys. Rev. B, 1985 31, 2080
- ↑ K. Parlinski, J Lazewski, Journal of Physics and Chemistry of Solids, 2000, 61, 1, 87-90
- ↑ Semimagnetic Compounds, Madelung, Heidelberg, Berlin, 1999
- ↑ Physical Chemistry, P. Atkins, J. De Paula, OUP, Oxford, 9th Edition, 2009.
- ↑ 7.0 7.1 O. Anderson, K. Zou, J. Phys Chem, Ref. Data, 1990, 19
