
Rep:Mod:acc212 inorganic
Introduction & Pseudopotentials
The detailed results of the optimisations for 3 different inorganic molecules are represented below, Though, no valid comparison for energies can be made since different basis sets were used. A table contrasting their geometries is also given.
BH3 Basis set: 3-21G
| Summary of Optimisation | "Item" Table | Jmol | ||
|---|---|---|---|---|

|
Item Value Threshold Converged? Maximum Force 0.000313 0.000450 YES RMS Force 0.000179 0.000300 YES Maximum Displacement 0.001257 0.001800 YES RMS Displacement 0.000851 0.001200 YES Predicted change in Energy=-6.067163D-07 Optimization completed. |
BH3 Basis set: 6-31G(d,p)
The following molecule was re-optimised using a more accurate basis set (6-31G(d,p), from the result of the optimisation of the above molecule which was only done to a rough accuracy.
| Summary of Optimisation | "Item" Table | Jmol | ||
|---|---|---|---|---|

|
Item Value Threshold Converged? Maximum Force 0.000155 0.000450 YES RMS Force 0.000073 0.000300 YES Maximum Displacement 0.000547 0.001800 YES RMS Displacement 0.000462 0.001200 YES Predicted change in Energy=-1.205479D-07 Optimization completed. |
GaBr3 Basis set: LanL2DZ
| Summary of Optimisation | "Item" Table | Jmol | ||
|---|---|---|---|---|

|
Item Value Threshold Converged? Maximum Force 0.000000 0.000450 YES RMS Force 0.000000 0.000300 YES Maximum Displacement 0.000003 0.001800 YES RMS Displacement 0.000002 0.001200 YES Predicted change in Energy=-1.307755D-12 Optimization completed. |
BBr3 Basis set: LanL2DZ (Br atoms) and 6-31G(d,p) (B atom)
| Summary of Optimisation | "Item" Table | Jmol | ||
|---|---|---|---|---|

|
Item Value Threshold Converged? Maximum Force 0.000050 0.000450 YES RMS Force 0.000027 0.000300 YES Maximum Displacement 0.000231 0.001800 YES RMS Displacement 0.000129 0.001200 YES Predicted change in Energy=-1.162807D-08 Optimization completed. |
| Bond Length / Å | Bond Angle | Symmetry Group | |
|---|---|---|---|
| BH3 {3-21G} | 2x 1.19434 & 1x 1.19503 | 2x 119.889 & 1x 120 . 222 | C2v UNLESS symmetrised to D3h |
| BH3 {6-31G} | 2x 1.19225 & 1x 1.19241 | 1x 120.10631 & 2x 119.94590 | Cs UNLESS symmetrised to D3h |
| BBr3 | 2x of 1.93389 1x 1.93410 | 120.02014, 119.98985 & 119.99000 | Cs UNLESS symmetrised to D3h |
| GaBr3 | 2.35018 | 119.999 | D3h |
The most apparent anomalous results above are the symmetries. We would expect all the molecules above to adopt the most symmetric D3h symmetry, though only one does, the GaBr3 molecule. However, Upon using the command "symmetrize" under Gaussian's edit menu, it adopts the more symmetric D3h, which is in reality very close to the Cs or C2v which it adopts after the optimisation, given that all the bond length are very close indeed, but not quite identical. Even the higher accuracy of the 6-31G basis does not correctly predict that the symmetry should be precisely D3h, presumably because it still gets stuck in a local minimum rather than the global minimum.
Changing the ligand from H to Br gives a marked increase in bond length (factor of 1.6 from BH3, as we would expect since the valence orbitals on Br (4p) are much more diffuse than the core 1s orbitals of H. We would expect the bond angles to still be roughly (or exactly) 120 degrees however, given 3 identical ligands.
Replacing the B with Ga, which is two groups below B, again increases the bond length. This time, by a factor of 1.2 compared to the BBr3. Again this would be expected, given the diffuse nature of the Ga orbitals, which extend out further. Additionally, for the first time, a perfect D3h symmetry is given, with 3 identical bond lengths and bond angles. A curious imperfection appears in Gaussian however which gives 3 bond angles which do not precisely add up to 360 degrees. It is possible that having longer bonds, made possible with the more diffuse Ga orbitals, allows the bond lengths angles to be precisely the same, giving the exact D3h point group upon optimisation.
Questions
A bond (covalent) between two elements is an interaction which decreases their overall energy. This occurs from sharing their electron density to such an extent that a large coulombic attraction arises. This is distinct from other bonds in that the electron density belongs to neither partner, but is shared. The energies within bonds however, can vary dramatically. The strongest known covalent bond is the triple N - N bond, which has an enthalpy of 945 kJ mol-1. A medium bond could be the CH bond (413 kJ mol-1) which is still strong. A weak bond example, is the labile F-F bond (158 kJ mol-1) which readily cleaves homolytically to form radicals even at room temperature, in the dark.
The classification of a bond is arbitrary though, in the way that only certain interactions are classified as a bond if they are strong enough. Below a certain threshold, thing are considered just interactions, rather than bonds. This is reasonable however, the strength of a bond / interaction can be related to a certain time frame. For a example, if a strong bond is likely to exist for many days, it is clearly a bond. If a bond exists between two elements in a very transient fashion, perhaps for a few nanoseconds, it is not, in reality, a bond.
The way gaussian assigns bonds to things is entirely arbitrary. It only models the electron density relative to the nuclei, but has no concept of what a bond is, other than the fact that it knows there is a large electron density between two atoms. Gaussian simply assigns bonds based on interatomic distances if it thinks they should be bonded together.
Introduction to Frequency analysis
BH3
| Frequency output | "Low frequencies" Table | Jmol | |||
|---|---|---|---|---|---|

|
Low frequencies --- -0.3328 -0.0105 0.0009 15.0662 15.0699 17.9032 Low frequencies --- 1163.0908 1213.2172 1213.2174 |
|

The Frequency output in the table below shows a distinct difference between the number of theoretical virbations (6) and the number of observed peaks on the IR spectrum (3). There are two clear reasons for this discrepancy. Firstly, some of the peaks are precisely energetically degenerate, despite the vibrational mode being visually different. Therefore, this only shows a single peak on the IR spectrum. The second reason is that some of the peaks are completely IR inactive. For a peak to be IR active, the vibration must alter the diploe moment of the molecule. The vibration in the animation below clearly shows a completely symmetric vibration with respect to the centre of the molecule, so no dipole moment change occurs, and this mode corresponds to the theoretical 4th peak, with frequency of 2582.18 cm-1.

| Wavenumber / cm-1 | Intensity | IR active? | Vibration |
|---|---|---|---|
| 1163 | 93 | Yes | Bend |
| 1213 | 14 | Yes | Bend |
| 1213 | 14 | Yes | Bend |
| 2528 | 0 | No | Stretch |
| 2715 | 126 | Yes | Stretch |
| 2715 | 126 | Yes | Stretch |
GaBr3 - LanL2DZ
| Frequency output | "Low frequencies" Table | Jmol | |||
|---|---|---|---|---|---|

|
Low frequencies --- -0.3328 -0.0105 0.0009 15.0662 15.0699 17.9032 Low frequencies --- 1163.0908 1213.2172 1213.2174 |
|

| Wavenumber / cm-1 | Intensity | IR active? | Vibration |
|---|---|---|---|
| 76 | 3 | Yes | Bend |
| 76 | 3 | Yes | Bend |
| 100 | 9 | Yes | Bend |
| 197 | 0 | No | Stretch |
| 316 | 57 | Yes | Stretch |
| 316 | 57 | Yes | Stretch |
Given the identical symmetry of BH3 and GaBr3, it is expected that the vibrational spectra should be very similar in form. They have the same number of peaks (3N -6 due to equal number of atoms), the same degeneracy, and the same IR inactive mode due to the symmetric vibration. One obvious difference is the much lower frequency of the GaBr3 molecule. This is also reasonably expected, and is justified by two arguments. Firstly, the strength of the bond is slightly less given the diffuse nature of the interacting orbitals, making the effective spring constant smaller, thus lengthening the period of vibration. The other is that the atoms are also heavier, and this increase in inertia also serves to increase the period of oscillation. The relationship of the effective spring constant, k (given by the bond strength), and the mass of the atoms (m), is simply related to the frequency (f) by the following equation:
One sublte difference can be noted by viewing the exact vibronic mode corresponding to each vibration. They are slightly reordered. This could be explained from the fact that ratio of the weights of the central atom to ligand atom is different for the molecules. Therefore, the oscillation of lowest energy for BH3 (the A2" umbrella motion), is not the same as for GaBr3 , since this exact vibration may be more highly energetic for a molecule with a different weight distribution. Moreover, Ga is much heavier that B, so for to act in the same vibrating "umbrella" fashion requires more energy.
In the calculation of the above frequencies, it is crucial that the results were calculated using precisely the same method and basis set as the preceding optimisation. Partly, the energy returned from the frequency calculation will not be comparable validly to the optimisation energy. The energy returned by the frequency and optimisation must be (almost) exactly the same, and it must be possible to compare them otherwise it cannot be said whether the frequency calculation has been carried out correctly.
The purpose of carrying out a frequency analysis is to confirm that we have optimised the structure in the fashion we meant to. For an optimisation to minimum, all frequencies should be positive, with strictly no negative modes. If on the other hand we were optimising to a transition state, we necessarily need to see a negative "imaginary" frequency to confirm the transition state (a local maximum on the Potential Energy Surface [PES]) has been located.
The "low frequency" represent the modes of movement of the molecule which are NOT vibration. That is, the rotations and translations about the center of mass of the molecule, and not vibrations.
Molecular Orbitals
BH3
DOI:10.14469/ch/191034 - Link to DSpace
Link to BH3 MO population file
Below is a complete MO diagram of BH3, with D3h symmetry.

The qualitative LCAO are compared to the calculated MOs from Gaussian. The "real" MO are fairly different in form, given that Gaussian has calculated them in a very different way from the simple combination of singular atomic orbitals. However, the agreement is surprisingly good given that only the basic shapes of the atomic orbitals undergoing zero interactions have been used in the qualitative approach. This shows that, as a rough guide to figuring out the shape of the MOs, which can be used to great effect in understanding interactions, qualitative drawing of MO diagrams is a relatively good starting point. Clearly, Gaussian has created the "Natural Bonding Orbitals" which is essentially a mixing of the atomic orbitals. It is done in such a way as to replicate the realistic distribution of electron density around the molecule, as opposed to the constituent elements only shown by the LCAO approach.
NH3 - 6-31G (d,p)
Link to ammonia optimisation file
| Summary of Optimisation | "Item" Table | Jmol | |||
|---|---|---|---|---|---|

|
Item Value Threshold Converged? Maximum Force 0.000067 0.000450 YES RMS Force 0.000052 0.000300 YES Maximum Displacement 0.001066 0.001800 YES RMS Displacement 0.000520 0.001200 YES Predicted change in Energy=-1.282632D-07 Optimization completed. |
|
Link to ammonia frequency file
| Frequency output | "Low frequencies" Table |
|---|---|

|
Low frequencies --- -32.3780 -11.5154 -11.5152 -0.0011 0.0007 0.0026 Low frequencies --- 1092.7479 1694.1645 1694.1645 |

| Wavenumber / cm-1 | Intensity | IR active? | Vibration |
|---|---|---|---|
| 1093 | 144 | Yes | Bend |
| 1694 | 13 | Yes | Bend |
| 1694 | 13 | Yes | Bend |
| 3461 | 1 | Not really | Stretch |
| 3589 | 0.3 | Not really | Stretch |
| 3589 | 0.3 | Not really | Stretch |

Shown on the right is the charge distribution in an ammonia molecule. The range of the distribution is from -1.25 to +1.25, where red represents electron-rich negative areas, and green positive areas. Given nitrogen's electron density, it is expected that it would be red. The specific charge on Nitrogen in -1.125, and each of the hydrogen's is +0.375.
Two Approaches were made to optimise the NH3 molecule. In the first, Gaussian was simply allowed to try and find the optimum structure with the correct symmetry. The second method constrained the symmetry to C3v before the optimisation was run. Curiously, in the second method with constains on symmetry, the energy returned was slightly lower. The value was -56.55776860 AU compared to a slightly higher (more positive) value of -56.55776808 AU for the first method, which (incorrectly?) gave the symmetry as Cs. In this case, comparing the two energies is valid because precisely the same method and basis set were used for both (DFT, B3LYP, 6-31G (d,p) ).
NH3BH3 Analysis 6-31G (d, p)
| Summary of Optimisation | "Item" Table | Jmol | |||
|---|---|---|---|---|---|

|
Item Value Threshold Converged? Maximum Force 0.000066 0.000450 YES RMS Force 0.000031 0.000300 YES Maximum Displacement 0.001020 0.001800 YES RMS Displacement 0.000551 0.001200 YES Predicted change in Energy=-1.022744D-07 Optimization completed. |
|
| Frequency output | "Low frequencies" Table |
|---|---|

|
Low frequencies --- -0.0013 -0.0011 -0.0007 8.3603 10.2663 12.3565 Low frequencies --- 263.5970 632.7762 638.6464 |

All of the following modes are essentially IR active, except the very first (lowest frequency) vibration.
| Wavenumber / cm-1 | Intensity | Vibration |
|---|---|---|
| 263 | 0 | bend |
| 632 | 14 | stretch |
| 639 | 4 | bend |
| 639 | 4 | bend |
| 1069 | 41 | bend |
| 1069 | 41 | bend |
| 1196 | 109 | bend |
| 1204 | 3 | bend |
| 1204 | 3 | bend |
| 1330 | 113 | bend |
| 1676 | 28 | bend |
| 1676 | 28 | bend |
| 2472 | 67 | stretch |
| 2532 | 231 | stretch |
| 2532 | 231 | stretch |
| 3463 | 2 | stretch |
| 3580 | 28 | stretch |
| 3580 | 28 | stretch |
| E(NH3) / AU | E(BH3) / AU | E(NH3BH3) / AU | DeltaE (B-N Dissociation energy) |
|---|---|---|---|
| -56.5577686 | -26.6153236 | -83.2246890 | 0.0515967 (AU)
136 kJ mol-1 |
Compared to the strengths of bonds outlined in the initial "Questions" section, the N-B single bong in the above NH3BH3 molecule is definitely weak, since it is most comparable to the single F-F bond. In fact, it is even slightly weaker (~23 kJ mol-1) than the F-F bond. It could be said, therefore, that this labile bond is more of an interaction, which will be somewhat transient, and perhaps likely to break and reform readily, akin to hydrogen bonds in liquids such as water or HF. To give further perspective, H bonds to the F2H- ion (in concentrated HF) are actually stronger, with an enthalpy of 162 kJ mol -1.
Mini-prjoect: Ionic Liquids
All of the following molecules were optimised using DFT with a B3LYP 6-31G(d,p) basis set. To confirm that a local minimum had been reached for each molecule, a frequency analysis was subsequently performed. The absence of any negative (imaginary) frequencies verified that a minimum had been reached. The "item" table and "Low frequency" lines (from the optimisation and frequency *.log files respectively) are included as further evidence that both of the calculations were completed correctly. (All of the optimisation links to DSpace are appended at the end of the report).
Calculation results
[N(CH3)4]+ 6-31G(d,p)
| Summary of Optimisation | "Item" Table | Jmol | |||
|---|---|---|---|---|---|
4_SUMM.PNG)
|
Item Value Threshold Converged? Maximum Force 0.000068 0.000450 YES RMS Force 0.000027 0.000300 YES Maximum Displacement 0.000134 0.001800 YES RMS Displacement 0.000067 0.001200 YES Predicted change in Energy=-8.886825D-08 Optimization completed. |
|
| Frequency output | "Low frequencies" Table |
|---|---|
4_freq_summ.PNG)
|
Low frequencies --- -0.0004 -0.0001 0.0002 22.3897 22.3897 22.3897 Low frequencies --- 190.8400 294.1556 294.1556 |
4_IR_spec.PNG)
[P(CH3)4]+ 6-31G(d,p)
| Summary of Optimisation | "Item" Table | Jmol | |||
|---|---|---|---|---|---|
4_SUMM.PNG)
|
Item Value Threshold Converged? Maximum Force 0.000066 0.000450 YES RMS Force 0.000015 0.000300 YES Maximum Displacement 0.000151 0.001800 YES RMS Displacement 0.000112 0.001200 YES Predicted change in Energy=-3.388638D-08 Optimization completed. |
|
| Frequency output | "Low frequencies" Table |
|---|---|
4_freq_SUMM.PNG)
|
Low frequencies --- -0.0035 -0.0031 -0.0023 24.0282 24.0282 24.0282 Low frequencies --- 159.9393 194.7266 194.7266 |
4_IR_table.PNG)
[S(CH3)3]+ 6-31G(d,p)
| Summary of Optimisation | "Item" Table | Jmol | |||
|---|---|---|---|---|---|
3_Summ.PNG)
|
Item Value Threshold Converged? Maximum Force 0.000242 0.000450 YES RMS Force 0.000074 0.000300 YES Maximum Displacement 0.001149 0.001800 YES RMS Displacement 0.000396 0.001200 YES Predicted change in Energy=-7.687674D-07 Optimization completed. |
|
| Frequency output | "Low frequencies" Table |
|---|---|
3_freq_Summ.PNG)
|
Low frequencies --- -13.7091 -11.2813 -9.4809 -0.0044 -0.0038 -0.0033 Low frequencies --- 162.6447 200.2368 200.4115 |
3_IR_table.PNG)
Analysis
| [N(CH3)4]+ | Methylamine | [P(CH3)4]+ | [S(CH3)3]+ | |
|---|---|---|---|---|
| Bond Length (C-X) / Å | 1.509 | 1.464 | 1.816 | 1.822 |
| Bond Angle (C-X-C) | 109.47 | n/a | 109.47 | 102.74 |
| Point Group | TD | n/a | TD | C3V |
The geometries of each of the molecules follow what would be predicted from fairly basic arguments. The [N(CH3)4]+ and "P" equivalent both have perfect tetrahedral geometry with precisely 109.47 degree bond angle, identical to the ideal methane case. The C-P bonds are slightly longer than the C-N bonds, again in accordance with the fact that the orbitals for carbon and nitrogen are better matched in terms of size and diffuseness, thus making the C-N bonds stronger (shorter) than C-P. The sulfur compound again follows the structure which which be easily predicted using simple VSEPR theory. The bond angles are slightly compressed (by about 5 degrees) from the ideal 109.47 "methane" angle, though this again would be expected given the fact that the lone pair on sulphur offers greater repulsion to the other C-S bonds than a bonded pair of electrons would. Being in the same group as phosphorous, the C-S bond lengths are of a very similar order to C-P bonds.
Selected [N(CH3)4]+ MOs
Below are a range of the Molecular Orbitals from [N(CH3)4]+, ranging from the strongly bonding (though not the "core" orbitals, only valence) to the strongly antibonding, including the HOMO and the LUMO.
| MO No. 10 : E = -0.80743 | MO No. 21 (HOMO) : E = -0.57934 | MO No. 22 (LUMO) : E = -0.13303 |
|---|---|---|
4_MO_10_draw.jpg)
|
4_MO_HOMO.PNG)
|
4_MO_LUMOj.jpg)
|
| MO No. 26 : E = -0.06665 | MO No. 42 : E = +0.29683 |
|---|---|
4_MO_26.PNG)
|
4_MO_42j.jpg)
|
A total of 139 MOs were calculated by Gaussian. One interesting observation which is demonstrated in part above is the difference between the occupied and unoccupied MOs, with respect to their delocalisation. The difference between the HOMO and LUMO shows this. The HOMO has a somewhat unusual shape. It would be expected that the two green lobes atop the molecule should delocalise together, but they do not. This feature was also observed in many of the other (lower energy) occupied orbitals, and is well demonstrated in the 10th MO. It seems like the green lobes surrounding the methyl groups would merge, but they stay discrete. This effect may be caused by the positive charge, which may keep the electron density more contracted that in a usual molecule, thus restricting the ability of the atomic orbitals to mix in the same way. This rationale seems more promising still when compared to the charge distribution (seen below) amongst the molecule, which actually shows the carbon atoms carrying the most negative charge. Additionally, the "formally" positive nitrogen is in fact negatively charged.
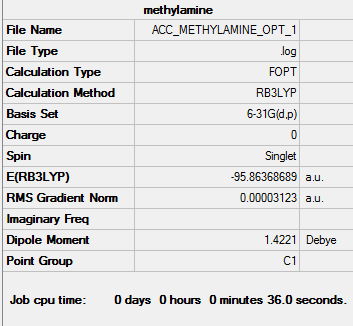
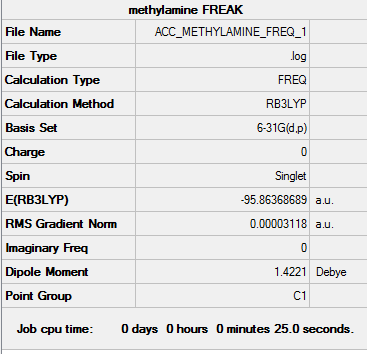
The apparent lack of atomic orbital mixing may imply that the atomic orbitals do not interact very strongly except for at short ranges therefore, in the occupied bonding MOs. The 10th MO also shows 4 apparent through-bond nodes between the C-N bonds. This implies that the methyl groups are not very strongly bonded to the nitrogen. This implication can be further backed up from a different perspective. The charge distribution below shows that both the nitrogen and the carbons carry a significant negative charge (the hydrogens carry the positive charge) which again implies that the carbons and nitrogen are not very strongly bonded. This assumes that the delta-negative C and N would electrostatically repel. As a comparison, a molecule of methylamine was optimised using exactly the same basis set and other inputs. The C-N length here is present in the table above as a comparison to the [N(CH3)4]+ molecule. Methylamine has a slightly shorter bond length. Given this, the above hypotheses that the four C-N bonds are relatively weak is further validated.
Link to methylamine optimisation file
Link to methylamine frequency file
Link to optimisation summary
Link to frequency summary
Optimised methylamine |
However, at the LUMO and above, a huge amount of delocalisation is suddenly present. The LUMO demonstrates this well, with a very large green cloud which engulfs the entire molecule. The LUMO has a very delocalised distribution, which is possibly indicative of a potentially effective ionic-liquid cation. The reasoning for this being that the cation must be a (relatively) poor electrophile in order to remain as a mobile cation, and not form ionic bonds with an anion. The diffuse nature of the LUMO infers that there is no particular electrophilic region on the cation at which it might accept an electron. Instead, this LUMO implies that the cation is able to spread out its charge to from many weak ion-ion interactions, rather than one strong bond (forming) one. The other slightly higher energy unoccupied MO (26) also shows a very delocalised character.
Orbital 26 is beginning to show some antibonding character (although it still has a negative energy according to Gaussian). The MO appears to be interwoven through the molecule, which implies a small amount of antibonding character, although the orbital is fairly diffuse and both the positive & negative lobes go through all the central bonds between them. The very high energy MO (42) is the only orbital shown with a positive energy indicating that it is strongly anti-bonding. The two outlined nodal planes through the center of the molecule exemplify the strong destabilising nature of this orbital, although it is very unlikely to be occupied given it is so much higher in energy than many other orbitals.
NBO Charge Distribution
Link to "N" NBO population log file
Link to "P" NBO population log file
Link to "S" NBO population log file
Below is a depiction of the charge distribution of the 3 cationic molecules. The colour ranges for all three was set at -1.00 to +1.00, where bright red is most negative and bright green is most positive.
| [N(CH3)4]+ | [P(CH3)4]+ | [S(CH3)3]+ |
|---|---|---|
4_charge.PNG)
|
4_charge.PNG)
|
3_charge.PNG)
|
| Atomic Charge Distribution | [N(CH3)4]+ | [P(CH3)4]+ | [S(CH3)3]+ |
|---|---|---|---|
| X | -0.295 | 1.667 | 0.918 |
| C | -0.483 | -1.060 | -0.846 |
| H | 0.269 | 0.298 | 0.297 |
In all of the molecules, the hydrogens (collectively) carry the majority of the positive charge of the molecule. Given that each molecule contains 12 (or 9 with S) hydrogens which are symmetrically arranged around the molecule, they serve to spread out the positive charge in a diffuse manner around the full surface of the molecule. This effect is ideal for an ionic liquid cation. It does appear anomalous that in [N(CH3)4]+, the each carbon should carry more negative charge than the nitrogen, given nitrogen is more electronegative. The nitrogen does nominatively have a positive charge though, which would explain why it doesn't posses the relative electron density (compared to carbon) that one would normally expect (i.e more negative).
For the two molecules with group 3 atoms, the central P and S are highly positive. It is well known that P and S, when bonded to carbon, produce very acidic hydrogens, as they allow the carbons adjacent to them to carry a negative charge well. A common example would be the precursor to a Wittig reaction, which has a phosphorous ylide where the carbon carries a negative charge. Therefore, the highly negative carbon on these two molecules is easily rationalised. Considering the range of 3 cations, the hydrogens have a very narrow range with respect to the positive charge charge which they may take on, despite the charge at the center being very significantly different. It seems reasonable to assume that hydrogen therefore may only be able to adjust to the surrounding electron density very minimally. In the P cation, it is the carbons which hold the huge amount of extra negative charge (compared to the N cation), due to the very positive central atom. The carbons are in fact over twice as negative compared to the N analogue, but the charge on the hydrogens is affected unsubstantially. The distribution in the case of sulphur is similar to the P cation, though it appears to be less electropositive. It seems very odd that the carbons should have such a high negative charge, where it is known that an anionic carbon center in organic chemistry is rare. However, it can be rationalised by the fact that it would be very tightly bound (with a bond length of only 1.09 Å) to the delta-positive hydrogens surrounding it which, all told, almost totally cancel the negative charge.
NBO Data
A section from the natural bond orbital (NBO) analysis section of the *.log file for [N(CH3)4]+ is shown below.
  1. (1.98451) BD ( 1) N   1 - C   2
                ( 66.35%)   0.8146* N   1 s( 25.00%)p 3.00( 74.97%)d 0.00(  0.03%)
                                            0.0000  0.5000 -0.0007  0.0000  0.4999
                                           -0.0001  0.4999 -0.0001  0.4999 -0.0001
                                            0.0103  0.0103  0.0103  0.0000  0.0000
                ( 33.65%)   0.5801* C   2 s( 20.78%)p 3.80( 79.06%)d 0.01(  0.16%)
                                            0.0003  0.4552 -0.0237  0.0026 -0.5129
                                           -0.0218 -0.5129 -0.0218 -0.5129 -0.0218
                                            0.0234  0.0234  0.0234  0.0000  0.0000
This directly states that 66.35 % of the contribution to one of the C-N bonds (and therefore all of them, as they are equivalent) is derived from the nitrogen's atomic orbitals, and the rest (33.65%) is derived from the carbon's AOs. This is quite counter-intuitive given the results of the charge distribution, since the carbon carries approximately double the negative charge as the nitrogen. It might be reasonably expected that the carbon would contribute a greater amount to the bond, therefore, if it appears to possess a greater density of electrons. An apparent trend becomes clear, however, when the results for the other molecules are compared.
Below is the same section for the P and S cations, outlined the same proportional contributions to the C-X bond.
  4. (1.98031) BD ( 1) C   1 - P  17
                ( 59.58%)   0.7719* C   1 s( 25.25%)p 2.96( 74.67%)d 0.00(  0.08%)
                                            0.0002  0.5022  0.0171 -0.0020 -0.4988
                                            0.0091 -0.4988  0.0091 -0.4988  0.0091
                                            0.0168  0.0168  0.0168  0.0000  0.0000
                ( 40.42%)   0.6358* P  17 s( 25.00%)p 2.97( 74.15%)d 0.03(  0.85%)
                                            0.0000  0.0001  0.5000 -0.0008  0.0000
                                            0.0000  0.4971 -0.0007  0.0000  0.4971
                                           -0.0007  0.0000  0.4971 -0.0007  0.0533
                                            0.0533  0.0533  0.0000  0.0000
  4. (1.98631) BD ( 1) C   1 - S  13
                ( 48.69%)   0.6978* C   1 s( 19.74%)p 4.06( 80.12%)d 0.01(  0.14%)
                                           -0.0003 -0.4441 -0.0139  0.0033  0.0000
                                            0.0000  0.8178 -0.0063 -0.3637 -0.0099
                                            0.0000  0.0000  0.0240  0.0266  0.0096
                ( 51.31%)   0.7163* S  13 s( 16.97%)p 4.86( 82.40%)d 0.04(  0.63%)
                                            0.0000 -0.0001 -0.4119  0.0076 -0.0012
                                            0.0000  0.0000  0.0000  0.0000 -0.8118
                                            0.0358  0.0000  0.4036  0.0260  0.0000
                                            0.0000  0.0621  0.0495  0.0051
In the P cation, the case is reversed with respect to the N cation, as the heteroatom (P) here contributes the least (only 40.42%) to the P-C bond. This does appear to match with thew charge density though. The central P atom is so positively charged here that the picture of it having a "formal" positive charge is actually relatively correct, and it cannot possibly contribute greatly to the C-P bond, given that it has released so much of its electrons density to the surrounding molecule (namely the hydrogens). For the S cation, the contribution to the C-S bond is essentially equally split between the C (48.69%) and S (51.31%). The emerging trend between all three of the results is that the proportion to which the heteroatom contributes to the C-X bond is (in some way) proportional to its electronegativity. That is, the most electronegative atoms contribute most to the bond (N) and the most electropositive (P) contribute least. Approximate (Pauling) electronegativity values are N = 3.02, S = 2.58, P = 2.19. In this way, the charge distribution does match to the contribution to the C-X bond, given that nitrogen also has the most negative center, and phosphorous the most positive one.
The concept that the nitrogen possesses a positive charge is useful for mechanistic and pictorial purposes. It is thought of in such a way because the nitrogen must lose one electron from its valence shell if it is to make 4 single bonds but simultaneously maintain its necessary 8 valence electron configuration. In reality, however, electrons are clearly not strictly bound to the atoms at which they would be drawn on a VSEPR diagram. They delocalise as directed by the relative electronegativies of the atoms and/or driven to certain location in order to gain stability from resonance forms, aromatic or otherwise. In the real case for [N(CH3)4]+, since nitrogen is the most electronegative atom in the molecule, it draws much of the electron density towards it. The result is a nitrogen which unambiguously possesses a delta negative charge. The positive charge within the molecule is solely delocalised equally between the 12 hydrogens.
Functional Group Influence
[N(CH3)3(CH2OH)]+ - 6-31G(d,p)
| Summary of Optimisation | "Item" Table | Jmol | |||
|---|---|---|---|---|---|

|
    Item               Value     Threshold  Converged?
 Maximum Force            0.000032     0.000450     YES
 RMS     Force            0.000009     0.000300     YES
 Maximum Displacement     0.001226     0.001800     YES
 RMS     Displacement     0.000276     0.001200     YES
 Predicted change in Energy=-2.416860D-08
 Optimization completed.
    -- Stationary point found.
|
|
| Frequency output | "Low frequencies" Table |
|---|---|

|
Low frequencies --- -7.8868 -5.3599 0.0008 0.0010 0.0012 1.1596 Low frequencies --- 131.1743 213.6651 255.7715 |

[N(CH3)3(CH2CN)]+ - 6-31G(d,p)
| Summary of Optimisation | "Item" Table | Jmol | |||
|---|---|---|---|---|---|

|
  Item               Value     Threshold  Converged?
 Maximum Force            0.000046     0.000450     YES
 RMS     Force            0.000011     0.000300     YES
 Maximum Displacement     0.001339     0.001800     YES
 RMS     Displacement     0.000285     0.001200     YES
 Predicted change in Energy=-3.513057D-08
 Optimization completed.
    -- Stationary point found.
|
|
| Frequency output | "Low frequencies" Table |
|---|---|

|
Low frequencies --- -2.0173 -0.0005 0.0002 0.0007 7.3298 9.5419 Low frequencies --- 91.8405 154.0999 210.9923 |

Link to "R-OH" NBO population log file
Link to "R-CN" NBO population log file
Charge Distribution
| [N(CH3)3(CH2OH)]+ | [N(CH3)3(CH2CN)]+ |
|---|---|

|

|
Since the OH group is electron releasing, and the CN withdrawing, it would be expected that the remainder of the molecule would become more nagetive or positive, respectively. The interest lies in which atoms in the molecule hold this difference. The expected result is unsubstantial, but present. In the "R-CN" cation, the central nitrogen and its 3 adjacent unfunctionalised carbons all carry a less negative (more positive) charge compared to the "R-OH" cation. It is apparent though that the effects of electron withdrawal / release are in no way related to the distance from the functional group. That is, directly adjacent to the electron releasing oxygen is a very positively charged carbon. Again, in adjacent to the electron withdrawing CN, where a positive carbon might reasonably be expected, a fairly delta negative carbon is present.
HOMO & LUMO Comparison
| MO Comparison | [N(CH3)4]+ | [N(CH3)3(CH2OH)]+ | [N(CH3)3(CH2CN)]+ |
|---|---|---|---|
| HOMO |
|

|

|
| Energy | -0.57934 | -0.48763 | -0.50048 |
| LUMO |
|

|

|
| Energy | -0.13303 | -0.12460 | -0.18184 |
The most dramatic difference can be seen in the HOMOs, probably because the occupied valence orbitals are more strongly affected by the withdrawing/donating effects of the functional groups. The most obvious feature of change is the distorted and asymmetric HOMO of the "R-OH" molecule, though this probably has little real significance or implication, given it if a function of the particular conformation of the molecule. That is, the OH group is pointing in such a direction as to break all symmetry in the molecule. Ignoring this, the HOMO does does seem too different in form though. It still has a relatively even distribution around the molecule, and there is still plenty of weakly anti-bonding through-space interaction. A stark difference is seen with the "R-CN" molecule however, whose form is clearly a function of the electron withdrawing CN functionality. It is clear because almost all of the MO is centred around this functional group, having been drawn away from the rest of the molecule. Perhaps surprisingly, even the central nitrogen possesses zero electron density in this HOMO. This is not indicated at all from the charge distribution, which shows only a slightly more positive central nitrogen in the "R-CN" cation.
The effect of withdrawal of the MO away from the molecule is not seen at all in the LUMO of the R-CN cation. There does however appear to be a less delocalised LUMO. The green phase which is so diffuse in the first LUMO is somewhat contracted all over the molecule in the R-CN functionalised cation. The R-OH cation's LUMO is more comparable to the [N(CH3)4]+ LUMO, ignoring again the symmetry is skewed. It possesses the same diffuse green orbital, and the red lobs which cap the methyl groups.
Both of the functionalised HOMOs have been raised quite significantly in energy, with the R-OH cation possessing the least stable one. This is probably true for both cases since both functional groups restrict in some way the ability of the electron density to spread evenly. As a result of this, it appears that there are pockets of more tightly packed electrons which is obviously electrostatically unfavourable. Even though the R-CN possesses a very contracted HOMO, which is almost solely localised around the CN bond, the fact that it is still slightly more stable that the R-OH cation can be rationalised by the fact that it stabilises the very strong triple bond which desires a large electron density. Overall, the HOMO - LUMO gap for the R-OH cation has contracted by 0.08328, whereas the R-CN cation's gap only contracted by 0.03005.
Interestingly, the energies of the two functionalised LUMOs disproportionate from the [N(CH3)4]+ LUMO. That is, the CN stabilises the LUMO while the OH raises its energy (more positive). However, in the context of ionic liquids, it seems that the raising of energy of a cation should be an advantage. That is, the OH functionalised cation may make for a better Ionic liquid. This hypothesis is reasoned with the fact that, for an ionic liquid, is must be unfavourable for the cation to accept an electron, and the electron density it does possess must be evenly and diffusely spread out. This is because it is of course unfavourable to form any actual ionic bonds with anions, but rather to have many weak ion-ion interactions. The R-OH cation possesses a very diffuse LUMO orbital too, so makes promise for use in Ionic liquids. One further advantage over the [N(CH3)4]+ is that it is asymmetric, which is a favourable property for any ionic liquid ion.
DSpace Links
[N(CH3)4]+ Optimisation DOI:10.14469/ch/191112
[S(CH3)3]+ Optimisation DOI:10.14469/ch/191122
[P(CH3)4]+ Optimisation DOI:10.14469/ch/191121
[N(CH3)3(CH2OH)]+ Optimisation DOI:10.14469/ch/191116
[N(CH3)3(CH2CN)]+ Optimisation DOI:10.14469/ch/191119
Methylamine Optimisation DOI:10.14469/ch/191114