Rep:Mod:ac4610b
Module 1: Techniques of molecular mechanics and semi-empirical molecular orbital methods for structural and spectroscopic evaluation
Week 1
In this lab various aspects of of organic structure and reactivity were modeled. This modelling is not only useful to confirm experimental data but can also be used to predict data for molecules that might otherwise be difficult to synthesise. A combination of ChemBio 3D and Gaussian were used to run the calculations on the molecules studied.
Modelling using Molecular Mechanics
In this part of the lab MM2 was the modelling technique used to calculate the optimised geometries. The calculation produces an energy value however this value isn't directly related to any thermodynamic quantity. This method uses already know data of other molecules to calculate properties of molecules that are only slightly different therefore this is an interpolativetechnique since new chemistry cannot be predicted. Any kinetics effects or investigations on new different molecules are hence beyond the scope of this method since it relies on stored data.
Dimerisation of Cyclopentadiene
Cyclopentadiene dimerises through a [4+2] cycloaddition to produce the endo dimer as the major product in the reaction below:
| Dimer | Energy / kJ mol-1 |
|---|---|
| Exo dimer | 31.8765 |
| Endo dimer | 33.9975 |
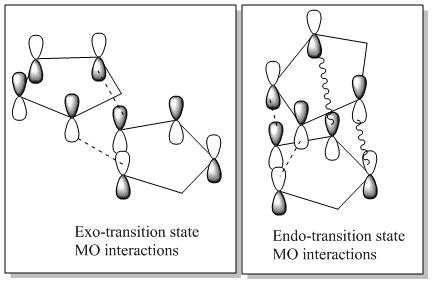
The Exo dimer has a lower energy than the Endo dimer therefore it is more thermodynamically stable. However the endo dimer is exclusively formed this therefore means the reaction is under kinetic control. As the reaction is under kinetic control the reaction must be irreversible. The endo dimer is the isomer produced since it has a lower transition state which means the activation energy to produce it is lower and therefore is the fastest isomer and in this case the only one to form. The stability of the endo transition state is due to favourable interactions between the orbitals as shown in the diagram below.
To form new bonds the pi orbitals overlap as shown by the dashed lines. As we can see above in the endo transition state there are additional through space attractive interactions that do not form bonds but that stabilise the transition state hence lowering its energy, these interactions are shown by the wavy lines. [1]
Hydrogenation of Cyclopentadiene Dimer
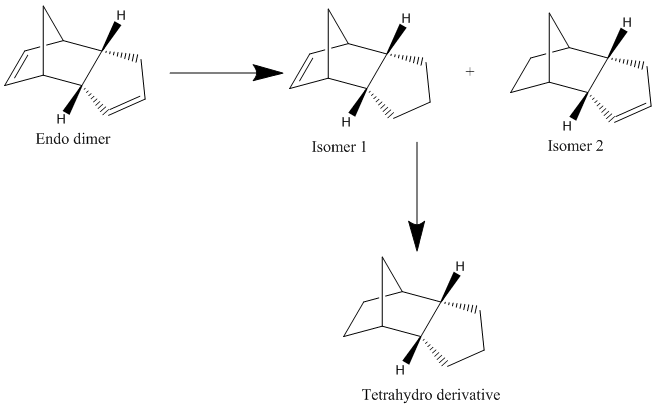
Hydrogenation of the endo dimer above produces one of the following dihydro-derivatives. Only after an extended period of time of hydrogenation the dihydro-derivative converts into the fully hydrogenated derivative as shown in the scheme below.
In order to determine which isomer is more stable, and therefore formed, MM2 calculations were run to optimise the geometries giving the results shown below.
| Energy Modes | Isomer 1 (kcal/mol) | Isomer 2 (kcal/mol) |
| Stretch | 1.2352 | 1.0963 |
| Bend | 18.9340 | 14.5243 |
| Torsion | 12.1292 | 12.4979 |
| 1,4-VDW | 5.7291 | 4.5118 |
| Dipole-Dipole | 0.1631 | 0.1406 |
| Total Energy | 35.9266 | 31.1521 |
From the energies above we can see that isomer 2 has a lower energy. Therefore the second isomer is more thermodynamically stable this is consistent with literature reports of the mechanism for the reaction.[2] The greatest difference in energy is between the bending energies of isomers 1 and 2 with a difference of 4.5 kcal/mol. The bond angles for the alkenes are: 107.6° for isomer 1 and 113.0° for isomer 2. From this we can see that the angle in the second isomer is closer to the optimum angle of 120° for an sp2 carbon, this therefore explains why isomer 2 has a lower energy. Since the alkene on the noroborene ring is more strained releasing this strain is the driving force for the reaction and explains why isomer 2 is the only one observed. This reaction is under thermodynamic control as the more stable isomer is the one formed also meaning this reaction is a reversible reaction.
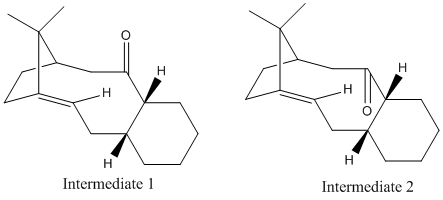
In the synthesis of Taxol one of the two isomers show below is a key intermediate. When the isomer is left standing it switches to the the alternative carbonyl. To find out which structure is the one that will be the ultimate product the structures were optimised in order to obtain their relative energies.
An MM2 calculation was run yielding the following results.
| Energy Modes | Intermediate 1 | Intermediate 2 |
| Stretch | 2.6984 | 2.4669 |
| Bend | 15.7886 | 12.3853 |
| Torsion | 19.5209 | 16.2272 |
| 1,4-VDW | 13.7914 | 12.4480 |
| Dipole-Dipole | -1.7511 | -1.5848 |
| Total Energy | 48.7375 | 40.1481 |
From the structures shown in the molecules we can see that the cyclohexane rings have adopted a chair configuration. This is the most stable configuration as it is a minima in the energy diagram shown below.
The same calculation can also be run with the different force field MMFF94 which is a similar minimising energy technique. These results are shown below.
| Intermediate | Final Energy kcal/mol |
| 1 | 67.8923 |
| 2 | 60.0533 |
From the results above we can see that isomer 2 is more thermodynamically stable since it has a lower energy in comparison. Since isomer two is more stable it is the isomer that all of the product will eventually convert to. Isomer 2 can then be reacted further through alkene functionalisation reactions however this reaction is very slow and this is due to the alkene being hyperstable. Normally we would expect alkenes next to a bridge to be unstable due to strain but it has been found that in large polycyclic systems an alkene favours being at a bridgehead, such is the case in this molecule.[3] This is because adding an alkene at the bridgehead releases strain as the molecule adopts a tetracyclic ring structure which stabilises the molecule. Also the addition of an alkene reduces the number of hydrogens and therefore also reduces steric hindrance.
Modelling Using Semi-empirical Molecular Orbital Theory
In this part of the lab we use a method called MOPAC to optimise the geometries of molecules. This method, in comparison to the MM2 method we were using previously, incorporates quantum mechanics which can account for the secondary molecular orbital interactions discussed before in the endo isomer. This method considers the probability distributions of electrons and can break bonds if the electronic interactions are more favourable with a different bonding structure. It can also predict the spectroscopic properties as a result the positions of the electrons.
Regioselective Addition of Dichlorocarbene to a diene
In this part of the lab the reactivity of an unsymmetric diene with electrophilic reagents is investigated. In order to do this the structure was minimised initially with an MM2 calculation and then a MOPAC calculation was run to obtain the energy of the molecular orbitals. The calculations were used to explain why the dichlorocarbene reacted with the alkene, on the less hindered side, endo to the Cl atom as shown below.
| Energy Modes | Energy (kcal/mol) |
| Stretch | 0.6181 |
| Bend | 4.7380 |
| Torsion | 7.6603 |
| 1,4-VDW | 5.7940 |
| Dipole-Dipole | 0.1123 |
| Total Energy | 17.8945 |
MOPAC Calculation
Heat of Formation = 22.82755 Kcal/Mol
MO and Electrostatic influences on reactivity of unsymmetric diene
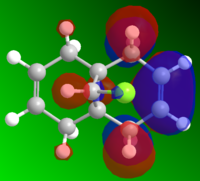
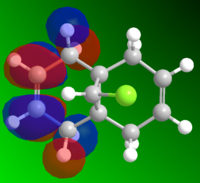
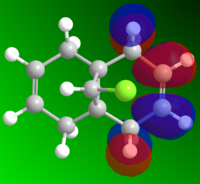
| HOMO-1 | HOMO | LUMO | LUMO+1 | LUMO+2 |
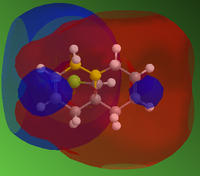
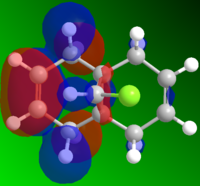
From the electrostatic density distribution diagram (left) we can see that the electrostatic potential is greater on the left hand side. This means it has more negative charge available to donate to the electrophilic reagents. In the MO diagrams we can see that in the HOMO there is a large electron density on the alkene endo to the Cl atom. This is in agreement with what we found for the electrostatic density distribution, there is more negative charge so the electrophile attacks more readily at this position.
In contrast if we look at the LUMO we can see there is a higher electron density contribution from the exo-alkene. Therefore this alkene would preferentially react with nucleophiles.
Overlayed Molecule of MOPAC and MM2 calculations |
Overlay of MOPAC and MM2 calculations
C(11)-C(36) 0.0581
C(6)-C(31) 0.0722
C(9)-C(34) 0.1935
C(8)-C(33) 0.0354
Cl(37)-Cl(12) 0.0450
From the overlay of the two molecules we can see they are quite similar however the biggest difference is between C(9)-C(34) this is the alkene endo to the chlorine atom. This therefore shows that the MM2 calculation doesn't predict the through space interactions between the chlrorine and the endo alkene whereas the MOPAC calculation does hence creating a difference is the structure at this point.
| Bond | Stretching frequency cm-1 | Intensity |
|---|---|---|
| C-Cl | 795 | 34 |
| endo-C=C | 1775 | 2 |
| exo-C=C | 1760 | 3 |
As we can see the stretching frequency of the exo alkene is less than that of the endo alkene. This means this is a weaker, this is consistent with the information found from the electron density distribution and the MO diagrams. Since there is a greater electron density on the endo alkene this means the bond is stronger. In the HOMO molecular orbital diagram we can see that the C-Cl orbital donates electron density to the п* of the exo-C=C bond hence increasing the anti-bonding character of the bond and therefore decreasing it's strength.
Monosaccharide Chemistry
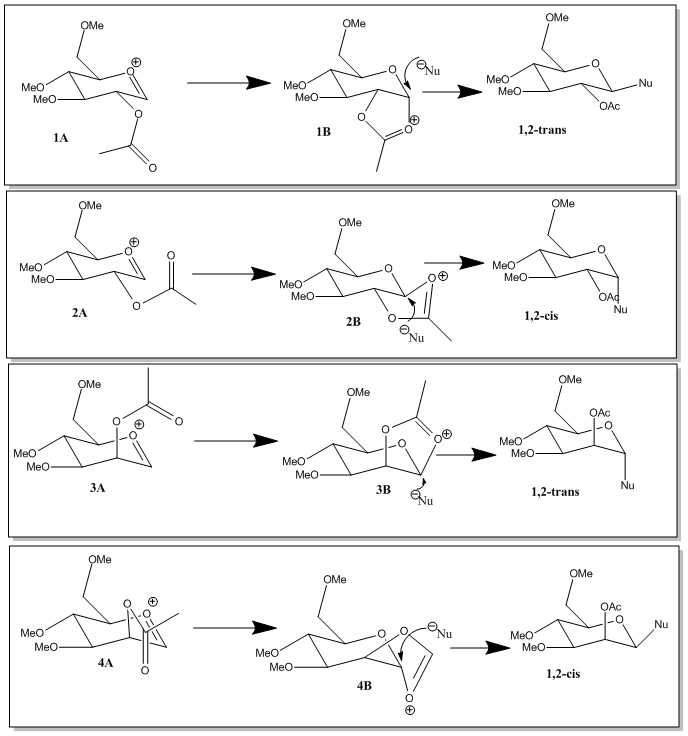
Glycosidation is when a nucleophile replaces the group X shown in the diagram below through a stereospecific reaction. The positioning of the C-OAc group governs the streoselective outcome of the reaction with the attacking nucleophile.
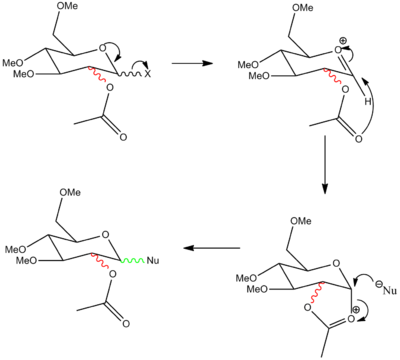
In this reaction an acetal group is placed on the 2-position, this forms an oxenium cation intermediate which is resonance stabilised and can be substituted by a nucleophile attacking from either the top or bottom face. The face on which the cation is connected governs which side the nucleophile attacks since the nucleophile will always attack from the less hindered side.[4]
The main reaction pathways are the ones that produce the trans products. In order to explain this selectivity the energies of the starting materials and the transition states were calculated the results are shown in the table below. Two different calculations were run the MM2 and the MOPAC calculation (the difference between these was discussed before).
| Anomer Number | Stretching (kcal/mol) | Bending (kcal/mol) | Torsion (kcal/mol) | Van der Waals (kcal/mol) | Dipole/dipole (kcal/mol) | Total Energy (kcal/mol) | MOPAC energy (kcal/mol) |
|---|---|---|---|---|---|---|---|
| 1A | 2.7931 | 10.6053 | 1.7969 | 18.5080 | 8.2017 | 25.0705 | -86.77375 |
| 2A | 2.6141 | 12.1602 | 1.1670 | 18.3550 | 4.4153 | 31.4981 | -71.15316 |
| 3A | 2.5902 | 10.3084 | 2.6020 | 19.1036 | 7.6064 | 19.2521 | -84.07461 |
| 4A | 2.4422 | 13.8501 | 1.4596 | 19.0197 | 6.3282 | 24.6802 | -73.78062 |
| 1B | 1.8796 | 14.2471 | 7.3459 | 18.1527 | -1.3369 | 39.9530 | -91.66047 |
| 2B | 2.9181 | 19.4204 | 5.4985 | 18.6653 | -0.0613 | 42.6160 | -66.85429 |
| 3B | 1.8622 | 13.8412 | 6.8417 | 18.2114 | 0.0643 | 41.5727 | -90.51237 |
| 4B | 2.6608 | 16.8357 | 7.7269 | 19.4911 | -0.7875 | 43.3771 | -66.66980 |
From the table above we can see that the trans products both have lower energy intermediates and therefore have lower energy pathways. From the table this difference is present in the MM2 calculations however when the MOPAC calculation was used this difference is much more apparent. To rationalise this we can look at the distance between the oxygen and the carbon.
| Anomer Number | Distance in MM2 calculation (Å) | Distance in MOPAC calculation (Å) |
|---|---|---|
| 1A | 2.6 | 1.6 |
| 2A | 3.0 | 1.6 |
| 3A | 2.5 | 1.6 |
| 4A | 3.0 | 2.7 |
As we can see from this table the distance between the carbon and the oxygen is much less when the MOPAC calculation was run. This is because in the MM2 calculation it only considers optimum bond lengths from well known molecules, whereas in the MOPAC calculations through space interactions are also taken into account. In the MOPAC calculation bonds can be made or broken and so the 2-acetylpyranose structure can be altered more extremely and so the oxygen is placed closer to the carbon in order to increase the neighboring group interaction and hence lowering the energy of the molecule more.
Therefore from this we can conclude that the 2 trans-products will be the most favourable reaction pathways making this reaction highly selective.
Week 2
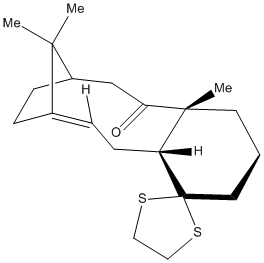
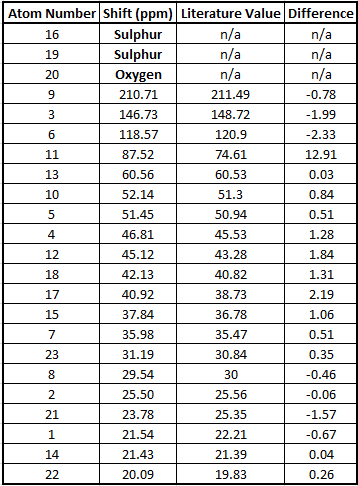
In this part of the lab a derivative of the Taxol molecule discussed earlier was optimised and then its 13C NMR predicted. The NMR prediction was run using a Mpw1pw91(d,p) method with a 6-31G basis set the results are shown in the table below.
To see the atom labels click here then right click go to style, labels, with atom number.
Table to show the 13C NMR Frequencies
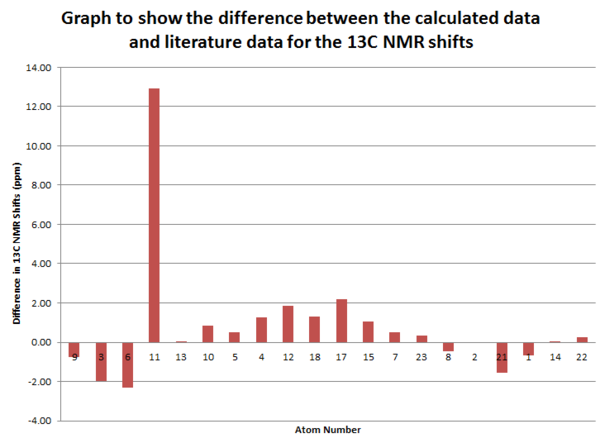
As we can see from the table above there is a good correlation between the calculated data and the literature values.[5] The only difference is in the shift of carbon number 11. This is the carbon that is bonded to the dithiane group. This is because if a carbon is attached to a heavier atom (in this case sulphur) during the calculation errors arise due to spin orbit coupling. Apart from this disparity the other shifts are all within 3ppm. This suggests that this prediction method is very powerful for molecules that don't contain heavy atoms as it produces accurate results.
Spectroscopy of a literature molecule
The reaction I have chosen to study is the direct aza-Diels–Alder reaction of 3 components: aromatic aldehyde, aromatic amine, and 2-cyclohexen-1-one that is catalysed by hen egg white lysozyme. This produces a mixture of an endo-isomer (isomer 1) and an exo-isomer (isomer 2). This reaction can be performed to a 98% yield and stereo-specificity with ratios for endo to exo isomer production of 90:10. Since a cyclohexenone derivative is used is this reaction, which is less reactive than the usual dienes used, a catalyst is necessary. In this reaction Hen egg white Lysozyme is used this has many advantages as a catalyst including mild reaction conditions, simple separation, good selectivity and high yields.[6]
An optimisation of both structures was run, from this the energy of these structures was compared.
| Type of energy | Isomer 1 | Isomer 2 | Difference |
|---|---|---|---|
| Electronic energy (kJ/mol) | -54820.920 | -54820.907 | 0.0132 |
| Enthalpy (kJ/mol) | -54820.109 | -54820.096 | 0.0134 |
| Gibbs free energy (kJ/mol) | -54822.841 | -54822.828 | 0.0134 |
From the energies of the two isomers we can see that isomer one is very slightly more stable. However the difference in the energy is so small it is negligible and therefore this cannot account for the selectivity of the reaction. The selectivity of the reaction must arise from the type of enzyme used. The hens egg Lysozyme must have a very specific affinity for the endo-conformation hence producing the selectivity observed.
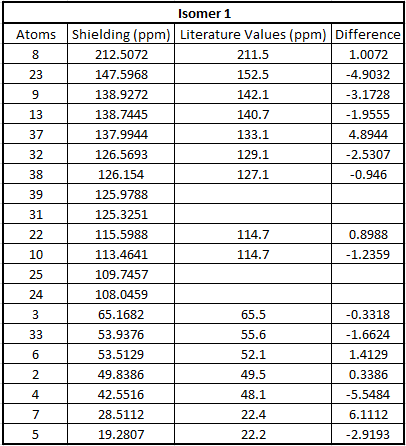
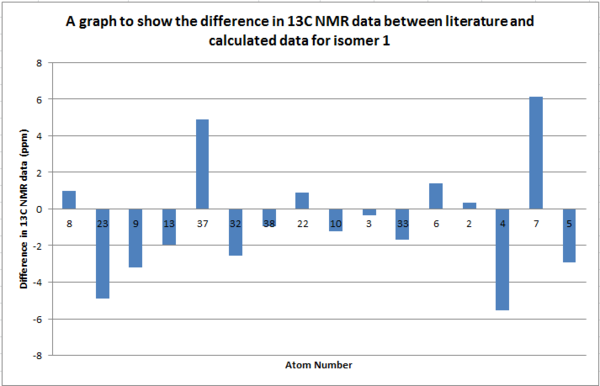
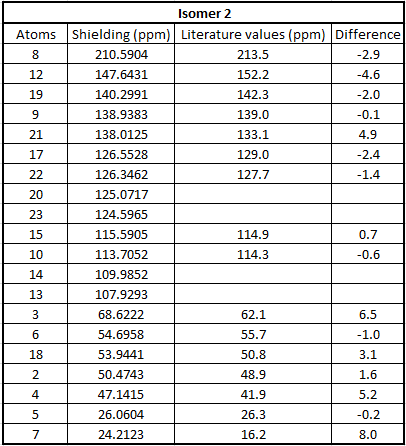
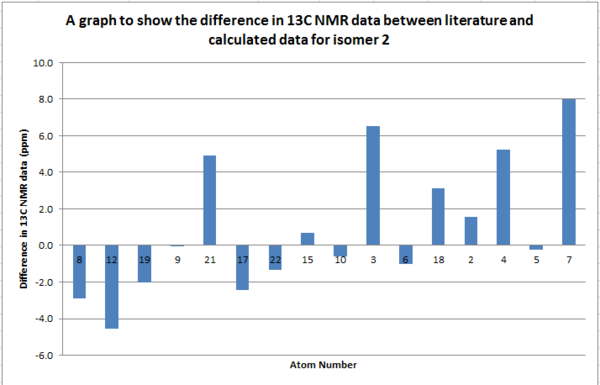
A 13C NMR was calculated for each isomer and compared to literature. The basis set used was 6-31g(d,p). The data is quoted in the tables below.
Table to show 13C NMR data for Isomer 1
Table to show 13C NMR data for Isomer 2
From the tables above we can see that the shifts calculated are very similar to those quoted in literature therefore confirming that in literature they have been assigned correctly. What we can see however is that in literature less peaks are quoted than were calculated. This is because in a carbon NMR the integrals are not representative of the number of carbon atoms therefore some atoms can easily be missed out in literature if their shifts are very close together. In a calculation however we don't miss any carbons and therefore even though the shifts are sometimes very similar we can accurately assign all the carbons. In the future, before publishing NMRs in literature, calculating the spectra computationally would be a good idea to give further understanding of molecules.
Even though most of the peaks are very similar there are a 5 atoms that have a difference of over 5 ppm. From looking at the molecule the atoms that correspond to those that have a difference of over 5ppm are 4 and 7 in isomer 1 and 21, 3 and 7 for isomer 2. This is due to limitations in the basis set used; 6-31g(d,p) uses information from other molecules and fits this to new molecules. Isomer 1 and 2 are unusual molecules since they have very rigid structures and have various functional groups attached to them. Gaussian is unable to compute environments these different accurately when using such a weak basis set hence causing the deviations from the values literature measured. In order to reduce these deviations we could run the molecules at a higher basis set which would give a better fit to a wider range of environments.
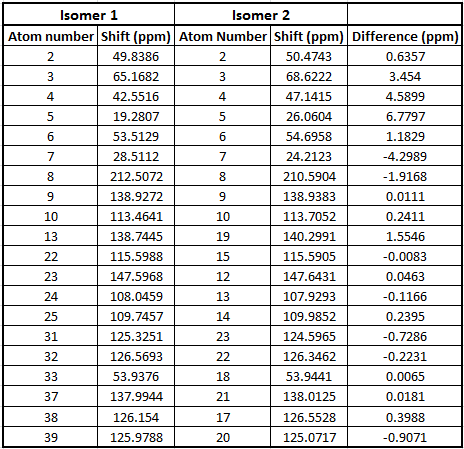
The 13C NMR spectra were compared for both isomer in order to determine if this was a viable way of distinguishing each isomer.
Table to show the difference in the 13C NMR between isomer 1 and isomer 2
From the comparison of the HNMR data for the different isomers we can see that there isn't a significant difference between the shifts. The greatest difference is for atom 5 which is only 6ppm. Therefore this technique wouldn't be sufficient to distinguish the isomers as the error related to the measurements are of the same order as the difference between the spectra (aprox.5ppm).
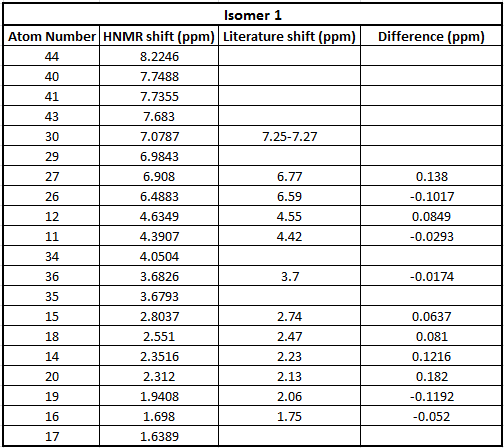
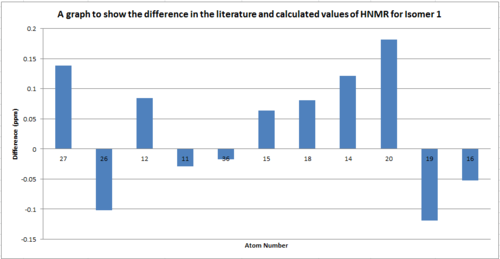
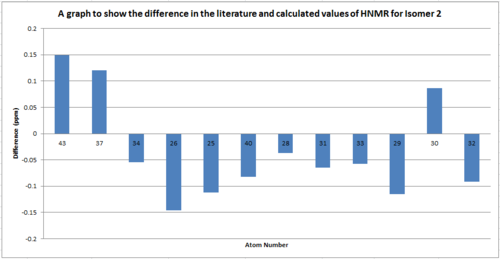
A 1H NMR was also calculated for each isomer and compared to literature. The basis set used was 6-31g(d,p). The data is quoted in the tables below.
Table to show 13C NMR data for Isomer 1
Table to show 13C NMR data for Isomer 2
In these tables we can also see that there is a good correlation between the literature values and the calculated values therefore confirming that in literature they have been assigned correctly. In addition what we can see is the peaks that are caculated are much more specific. In the literature spectra the hydrogens are grouped together since the resolution of the spectra isn't good enough to see the difference between each hydrogen.
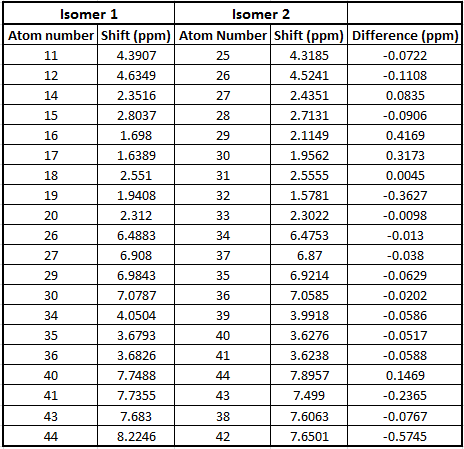
In order to determine whether HNMR could be used to differentiate between the isomers the two spectra were compared.
As we can see the difference between the shifts is indistinguishable and therefore this technique wouldn't be useful to determine which isomer was which. One possibility would be to deuterate certain parts of the isomer to determine how each group changed the spectra and hopefully from this determine a possible way of distinguishing between the isomers.
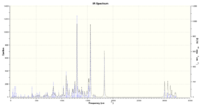
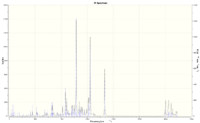
The IR spectra were also calculated for the molecules in an attempt to determine if there were any major differences between the isomers however as we can see from the spectra below there is no clear way of determining between these spectra either. Therefore this method is also not useful for assigning the isomers.
Conclusion
In conclusion from the three spectroscopic methods investigated none of the were sufficient to adequately distinguish between the two isomers. The isomers themselves are not highly different in energy either so the selectivity of this reaction is due to the enzyme used. A possible way of distinguishing between the isomers could be x-ray crystallography.
References
<references>
- ↑ Organic Chemistry J. Clayden, N. Greeves, S. Warren and P. Wothers Oxford University Press(2001) p. 916-917
- ↑ D. Skala and J. Hanika, Petroleum and Coal 2003, 45, 105-108
- ↑ A. McEwen and P. von Rague Schleyer, Journal of the American Chemical Society 1986, 108, 3951-3960, DOI:10.1021/ja00274a016
- ↑ WD. M. Whitfield, T. Nukada, Carbohydr. Res., 2007, 342, 1291
- ↑ L. Paquette, N. Pegg, D. Toops, G. Maynard and R. Rogers, Journal of the American Chemical Society, 1990, 112, 1, p. 277–283, DOI:10.1021/ja00157a043
- ↑ Y. He, Z. Guan and W. Hu, Jornal of Organic Chemistry 2012, 77, 200-207, DOI:10.1021/jo2016696


