Rep:Mod:abc456
Third Year Computational Laboratory - Module 1: Structure and Spectroscopy (Molecular Mechanics/Molecular Orbital Theory)
1.2.1 The Hydrogenation of Cyclopentadiene Dimer
In this section, the formation and hydrogenation of the Cyclopentadiene dimer will be investigated. A variety of products will be analysed in order to determine if the reactions are kinetically or thermodynamically controlled. The results of structure optimisation using an MM2 force field will also allow the individual contributions to the overall molecular energy to be analysed.
Using ChemBio 3D, the structure of compounds 1-4 (Figure 1) were optimised with an MM2 force field. Molecules 1 and 2 are possible products for the dimerisation of cyclopentadiene whereas molecules 3 and 4 are possible products of hydrogenation of the cyclopentadiene dimer (molecule 2).

These structures were optimised to show the relative stability between compounds 1/2 and 3/4. The results of the optimisation calculations can be found below.
Molecule 1 - Dimerisation of Cyclopentadiene, Exo product
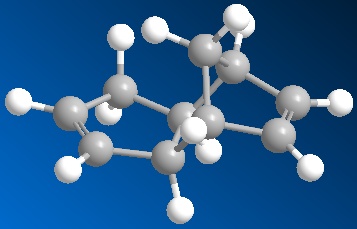
 MM2 Minimization
 Note: All parameters used are finalized (Quality = 4).
 Iteration  123: Minimization terminated normally because the gradient norm is less
 than the minimum gradient norm
 Stretch:                1.2852
 Bend:                  20.5839
 Stretch-Bend:          -0.8351
 Torsion:                7.6621
 Non-1,4 VDW:           -1.4239
 1,4 VDW:                4.2288
 Dipole/Dipole:          0.3778
 Total Energy:            31.8788 kcal/mol               133.48 kJ/mol
Molecule 2 - Dimerisation of Cyclopentadiene, Endo product
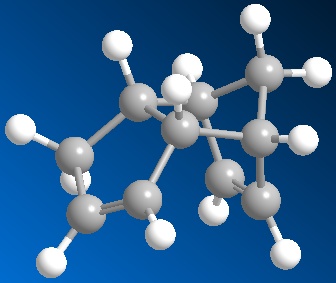
 MM2 Minimization
 Note: All parameters used are finalized (Quality = 4).a
 Iteration  144: Minimization terminated normally because the gradient norm is less
 than the minimum gradient norm
 Stretch:                1.2561
 Bend:                  20.8662
 Stretch-Bend:          -0.8348
 Torsion:                9.5027
 Non-1,4 VDW:           -1.5239
 1,4 VDW:                4.2966
 Dipole/Dipole:          0.4453
 Total Energy:            34.0083 kcal/mol              142.39 kJ/mol
The above data shows that exo and endo products of dimerisation have total energies of 133.48 kJ/mol and 142.39 kJ/mol
respectively. This suggests that if the dimerisation reaction is thermodynamically controlled, then the exo product (1) would be favoured over the endo product (2) as the exo product has a lower energy than the endo. From figure 1 it can be seen that the two hydrogens shown are anti to the bridging methyl group in molecule 1. This orientation is sterically favourable, leading to a lower molecular energy.
However literature 1 shows that the endo product (2) is the the only dimerisation product of the reaction. This shows that the dimerisation of cyclopentadiene is kinetically controlled, where the endo product is produced via a more stable transition state.
Molecules 3 and 4 can now be compared to discuss the expected outcome for the hydrogenation of the cyclopentadiene dimer, molecule 2. As above each molecular structure was optimised using an MM2 force field. Please find the results below.
Molecule 3
 MM2 Minimization
 Note: All parameters used are finalized (Quality = 4).
 Iteration    2: Minimization terminated normally because the gradient norm is less than the minimum gradient norm
 Stretch:                1.2759
 Bend:                  19.9008
 Stretch-Bend:          -0.8367
 Torsion:               10.7692
 Non-1,4 VDW:           -1.2231
 1,4 VDW:                5.6403
 Dipole/Dipole:          0.1621
 Total Energy:            35.6884 kcal/mol          149.33 kJ/mol
Molecule 4
 MM2 Minimization
 Note: All parameters used are finalized (Quality = 4).
 Iteration   59: Minimization terminated normally because the gradient norm is less than the minimum gradient norm
 Stretch:                1.0963
 Bend:                  14.5074
 Stretch-Bend:          -0.5493
 Torsion:               12.4972
 Non-1,4 VDW:           -1.0507
 1,4 VDW:                4.5124
 Dipole/Dipole:          0.1407
 Total Energy:            31.1540 kcal/mol          130.33 kJ/mol
Comparison of the total energies of molecules 3 and 4 show that molecule 4 is the most stable as it has the lowest energy. This means that if the hydrogenation of the cyclopentadiene dimer is thermodynamically controlled, the major product would be molecule 4. This suggests that in a thermodynamic sense, the double bond on the left hand side of the molecule (as shown in figure 1) is the easiest to hydrogenate.
The above data shows the total energy value calculated for each molecule is a summation of different contributions. The stretching, bending, torsion, Van der Waals and Hydrogen bonding (dipole-dipole) contributions can be compared between 3 and 4 to justify the total energies.
| Contributing factor | Molecule 3 | Molecule 4 |
|---|---|---|
| Stretching / kcal/mol | 1.10 | |
| Bending / kcal/mol | 19.90 | 14.51 |
| Torsion / kcal/mol | 10.77 | 12.50 |
| Van der Waals / kcal/mol | 4.42 | 3.46 |
| Hydrogen Bonding | 0.16 | 0.14 |
In the above table, the Van der Waals contributions were calculated by combining the '1,4 VdW' and 'non-1,4 VdW' values. The Dipole-dipole values are termed Hydrogen Bonding here.
From the table above it can be seen that molecule 3 has high positive values for stretching, bending and Van der Waals. These values suggest that the bonds in molecule 3 have a larger stretching and bending actions than we would expect under normal conditions. The same is seen for the Van der Waals contribution, where this values is positive, showing more deviation from ideality in comparison to molecule 4. Table 1 also shows, a higher contribution from hydrogen bonding for molecule 3. However as the difference in the hydrogen bonding contribution between molecules 3 and 4 is small (0.02 kcal/mol), this factor shows slight favourability for molecule 3.
However molecule 4 shows a larger deviation from ideality with respect to torsional strain (and in comparison to molecule 3). Despite of the increased torsion for molecule 4, the increased contributions for molecule 3, mean that this structure is less stable (higher energy).
Jmol models of optimized molecules 1, 2 ,3 and 4
Figure 4 - Molecule 1
Figure 5 - Molecule 2
Figure 6 - Molecule 3
Figure 7 - Molecule 4
References
1.Clayden, Greeves, Warren and Worthers; Organic Chemistry
1.2.2 Stereochemistry of Nucleophilic additions to a pyridinium ring (NAD+ analogue)
Again using ChemBio 3D, the stereochemistry of the molecules in the reaction schemes below were optimised using an MM2 force field.

Reactant 5 was first analysed, investigating the orientation of the C=O group with respect to the pyridinium ring. In order to do this, the structure was drawn manipulating the C=O orientation and then optimised. The variation principle can then be used, to justify that the orientation which gives the lowest molecular energy, will correspond to the true structure.
Optimization of molecule 5 - Conformation 1
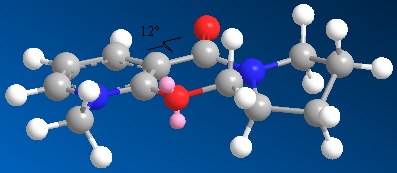
 MM2 Minimization
 Pi System:    1   2   3   4   6   5  12  13
 Warning: Some parameters are guessed (Quality = 1).
 Iteration  247: Minimization terminated normally because the gradient norm is less than the minimum gradient norm
 Stretch:                2.0768
 Bend:                  14.3106
 Stretch-Bend:           0.1643
 Torsion:                6.0996
 Non-1,4 VDW:           -0.5042
 1,4 VDW:               16.7022
 Charge/Dipole:          9.7206
 Dipole/Dipole:         -3.9576
 Total Energy:            44.6123 kcal/mol          186.65 kJ/mol
The dihedral angle between the C=O and aromatic ring was calculated as 12oC.
Optimisation of molecule 5 - Conformation 2
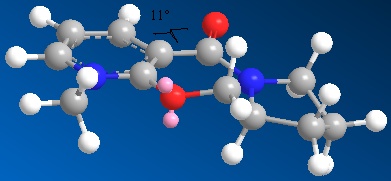
 MM2 Minimization
 Pi System:    1   2   3   4   6   5  12  13
 Warning: Some parameters are guessed (Quality = 1).
 Iteration  193: Minimization terminated normally because the gradient norm is less than the minimum gradient norm
 Stretch:                2.0324
 Bend:                  14.2509
 Stretch-Bend:           0.1342
 Torsion:                5.1303
 Non-1,4 VDW:           -0.5571
 1,4 VDW:               16.5196
 Charge/Dipole:          9.6301
 Dipole/Dipole:         -3.9967
 Total Energy:            43.1436 kcal/mol          180.50 kJ/mol
The dihedral angle of the carbonyl with respect to the aromatic pyridinium ring was calculated as 11oC.
The above data shows that changing the conformation of the 5 membered ring causes little change in the overall molecular energy. However using the variation principle, conformation 1 will correspond more to the true structure. Also in both cases here, the carbonyl group lies on the top face of the pyridinium ring. This helps us rationalise the stereospecificity of the reaction. In this reaction the methyl group is added specifically to the same face as the carbonyl group. Therefore it can be deduced that the carbonyl group interacts with the Grignard reagent ensuring reaction on the top face. This is justified by literature[1].
Here it is shown that the carbonyl oxygen donates electron density (via it's lone pair) to the δ+ magnesium. This co-ordination fixes to Me-Mg-I to the top face of the reactant (molecule 5) therefore forcing reaction from this position. This results in the specific stereochemistry shown in molecule 6.
The next reaction to be investigated is that found in the figure below.

Optimisation of molecule 7 - 7 membered ring conformation 1
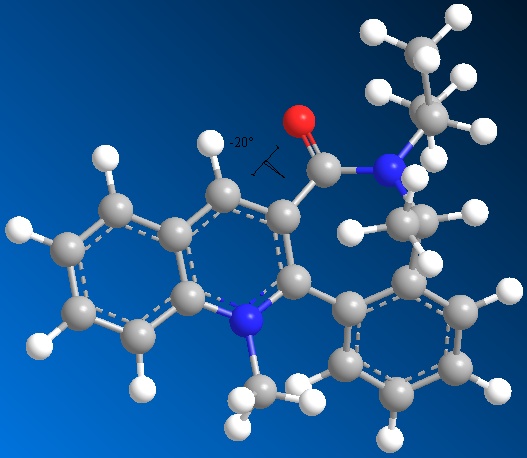
 MM2 Minimization
 Pi System:   23  17  16  10   6   1   2   3   5   4   7   9   8  22  12  13  24  25
 Warning: Some parameters are guessed (Quality = 1).
 Iteration  426: Minimization terminated normally because the gradient norm is less than the minimum gradient norm
 Stretch:                3.9589
 Bend:                  11.5848
 Stretch-Bend:           0.3981
 Torsion:                9.6622
 Non-1,4 VDW:            3.5204
 1,4 VDW:               29.4502
 Charge/Dipole:          9.0092
 Dipole/Dipole:         -4.8889
 Total Energy:            62.6949 kcal/mol          262.29kJ/mol
Dihedral angle of C=O in relation to pyridinium ring system: -20oC.
Optimisation of molecule 7 - 7 membered ring conformation 2
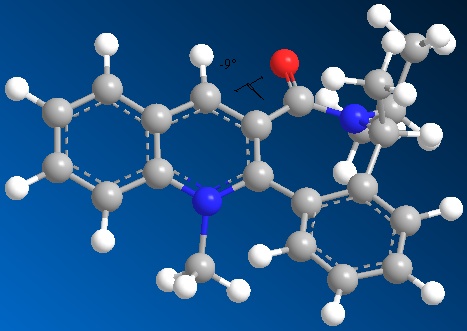
 MM2 Minimization
 Pi System:   15  20   1   2   3   4   5   9   8  18   7  10   6  14  11  12  16  21
 : Some parameters are guessed (Quality = 1).
 Iteration    2: Minimization terminated normally because the gradient norm is less than the minimum gradient norm
 Stretch:                5.5405
 Bend:                  16.7393
 Stretch-Bend:           0.4451
 Torsion:               17.6610
 Non-1,4 VDW:            6.5108
 1,4 VDW:               30.2611
 Charge/Dipole:          8.6223
 Dipole/Dipole:         -4.9628
 Total Energy:            80.8172 kcal/mol          338.15 kJ/mol
Dihedral angle of C=O in relation to plane of conjugated system: -9oC.
For conformation 2 of molecule 7, the minimisation results (using an MM2 force field) show that this conformation is higher energy than conformation 1 and therefore it's formation is less energetically favourable. However the dihedral angle of C=O with respect to the fused ring system, matches in sign with that of conformation 1 (i.e. negative) This shows the C=O is still on the same side of the molecule.
From the dihedral angles, the mechanism which causes the stereospecificity of this reaction can be discussed. It is noted that the -NHPh group is added anti to the C=O (i.e. on the opposite face). In this reaction, the ring (containg N+) acts as an electrophile and is attached by nucleophilic NH2Ph. In the first reaction, we saw the reagent (MeMgI) being stablised through electron donation from the O lone pairs, forcing attack on the same face as the C=O (syn). However in this case, as the reagent (NH2Ph) is nucleophilic, stabilisation in this way is not favourable. Therefore in this case the sterics of the product must be considered. There are 3 groups of lone electron pairs which could sterically clash in product 8. These are the two lone pairs on the O and also the N lone pair, of the added -NHPh group. If these two groups (-NHPh and C=O) were present on the same face (syn), there would be large steric clashes between the lone pairs, resulting in a sterically unfavourable conformation and high energy product. Though when present on opposite faces (anti) this steric clash would be reduced, forming a more stable and favourable product. This is the result seen in this reaction and therefore, it can be suggested that the stereospecificity of the reaction is largely due to sterics.
This model could be improved by incorporating solvent effects as the solvent present can stabilise or destabilise molecules in the reaction. The intermediates and transition states for the reaction could also be minimised, this would give more information on the lowest energy reaction route. Using a MOPAC/PM6 calculation would also give more accurate values.
It was also noted that when an MM2 minimisation was completed on two molecules, the calculation did not run.
References'
- ↑ Regio- and Stereoselective Control in the Addition of Grignard Reagents to the Pyridine ring system DOI:10.1021/ja00356a016
1.2.3 Stereochemistry and Reactivity of an Intermediate in the Synthesis of Taxol
Molecules 9 and 10 (below) are both intermediates formed during Taxol synthesis. The structures of the molecules will be investigated here and the relatively slow reaction of the alkene functionality justified.
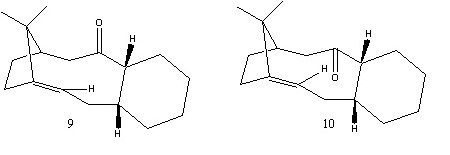
The above structures were minimised using and MM2 force field. The results for this can be found below.
Optimisation of Molecule 9
 MM2 Minimization
 Note: All parameters used are finalized (Quality = 4).
 Iteration   38: Minimization terminated normally because the gradient norm is less than the minimum gradient norm
 Stretch:                3.0115
 Bend:                  18.9005
 Stretch-Bend:           0.2609
 Torsion:               18.8234
 Non-1,4 VDW:           -0.0946
 1,4 VDW:               13.6247
 Dipole/Dipole:          0.0645
 Total Energy:            54.5909 kcal/mol          228.40 kJ/mol
Optimisation of Molecule 10
 MM2 Minimization
 Note: All parameters used are finalized (Quality = 4).
 Iteration   41: Minimization terminated normally because the gradient norm is less than the minimum gradient norm
 Stretch:                2.4922
 Bend:                  12.8680
 Stretch-Bend:           0.2890
 Torsion:               17.6927
 Non-1,4 VDW:           -0.7822
 1,4 VDW:               12.1441
 Dipole/Dipole:          0.2551
 Total Energy:            44.9589 kcal/mol          188.11 kJ/mol
From the above calculation results it can be seen that Molecule 10 is the most stable isomer. This can be further justified by looking at the molecular structure. For isomer 10 there are less steric interactions between the carbonyl group and noted H atoms and these functionalities are on opposite faces. This results in a lower molecular energy.
The alkene functionality reacts slowly, this can be explained by describing these alkene functionalities as hyperstable alkenes[1][2]
Alkenes are defined as hyperstable when they have a negative olefin strain value. This can be calculated by comparing the torsion (strain) values for the alkene and compare that with the torsion of it's hydrogenated counterpart. In order to carry out this calculation, the torsion values were calculated for the hydrogenated versions of isomers 9 and 10. This can be found below.
Isomer 9 - Hydrogenated
 MM2 Minimization
 Note: All parameters used are finalized (Quality = 4).
 Iteration  124: Minimization terminated normally because the gradient norm is less than the minimum gradient norm
 Stretch:                3.0189
 Bend:                  14.1254
 Stretch-Bend:           0.5457
 Torsion:               21.1065
 Non-1,4 VDW:           -0.0336
 1,4 VDW:               14.4696
 Dipole/Dipole:          0.0000
 Total Energy:            53.2325 kcal/mol         222.71 kJ/mol
The olefin strain for isomer 9 can be deduced as:
Torsion(Alkene)-Torsion(Hydrogenated product) = 18.8-21.1 = -2.3 kcal/mol = -9.62 kJ/mol(Torsion due to alkene functionality (Olefin strain))
Isomer 10 - Hydrogenated
 MM2 Minimization
 Note: All parameters used are finalized (Quality = 4).
 Iteration  136: Minimization terminated normally because the gradient norm is less than the minimum gradient norm
 Stretch:                2.9766
 Bend:                  14.0755
 Stretch-Bend:           0.5424
 Torsion:               21.1431
 Non-1,4 VDW:           -0.0294
 1,4 VDW:               14.5002
 Dipole/Dipole:          0.0000
 Total Energy:            53.2084 kcal/mol          222.63 kJ/mol
The olefin strain of isomer 10 can be deduced as above:
17.7-21.1 = -3.4 kcal/mol = -14.23 kJ/mol
Therefore as for both isomers, the strain due to the alkene functionality is negative and so the molecule is further stabilised through the presence of the alkene. This allows us to define these isomers (9 and 10) as hyperstable and are therefore expected to have low reactivities due to the reduced torsional strain.
References
- ↑ Hyperstable Olefins: Further Calculational Explorations and Predictions: DOI:10.1021/ja00274a016
- ↑ Evaluation and prediction of the stability of bridgehead olefins: DOI:10.1021/ja00398a003
1.2.4 Regioselective Addition of Dichlorocarbene
In this section, Semi-empirical Molecular Orbital Theory will be used to justify the regioselective addition of dichlorocarbene to molecule 12.
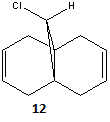
For this investigation, the structure of molecule 12 (above) was first minimised using an MM2 force field. The results of this calculation can be found below.
Optimisation of Molecule 12
 MM2 Minimization
 Warning: Some parameters are guessed (Quality = 1).
 Iteration  123: Minimization terminated normally because the gradient norm is less than the minimum gradient norm
 Stretch:                0.6222
 Bend:                   4.6581
 Stretch-Bend:           0.0412
 Torsion:                7.7167
 Non-1,4 VDW:           -1.0687
 1,4 VDW:                5.8182
 Dipole/Dipole:          0.1127
 Total Energy:            17.9003 kcal/mol          74.89 kJ/mol
The orbitals of molecule 12 were then calculated using a MOPAC/PM6 method, which gives an approximation to the molecular orbital wavefunction. The HOMO-1, HOMO, LUMO, LUMO+1 and LUMO+2 orbitals were modelled and diagrams of these can be found below.
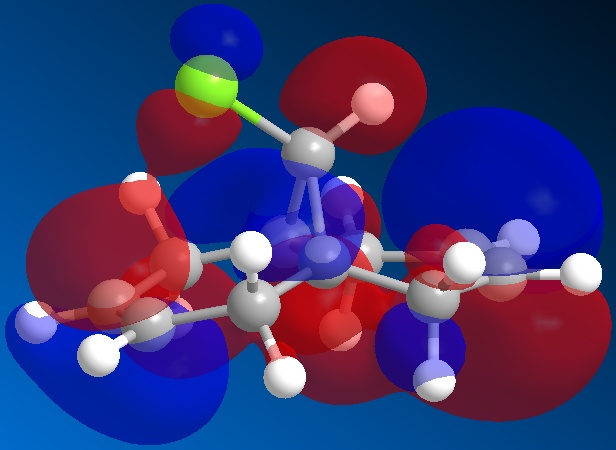
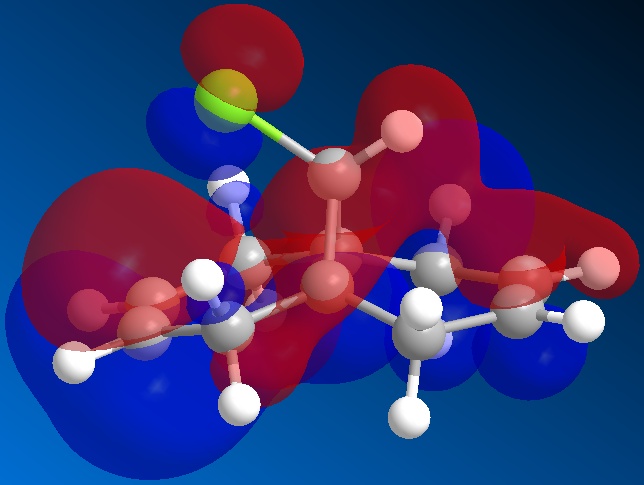
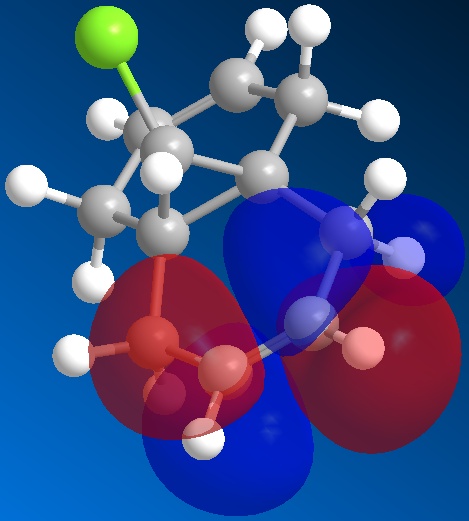
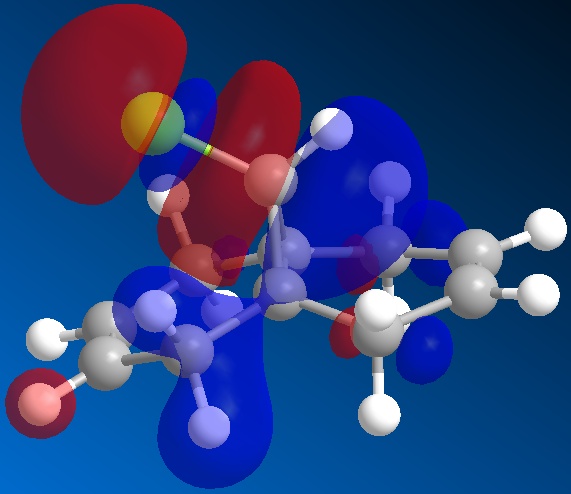
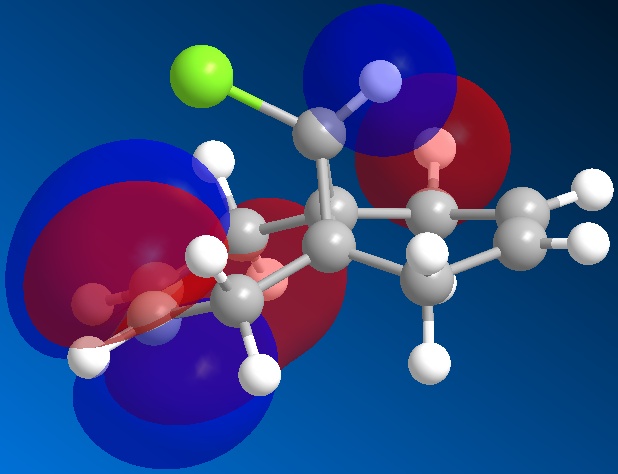
The molecular orbital calculations were then repeated using the Gaussian interface (what kind of) method. The results of these calculations can be found in the figures below.
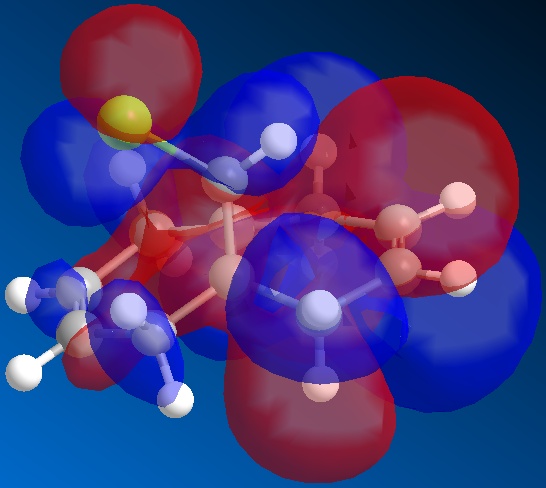
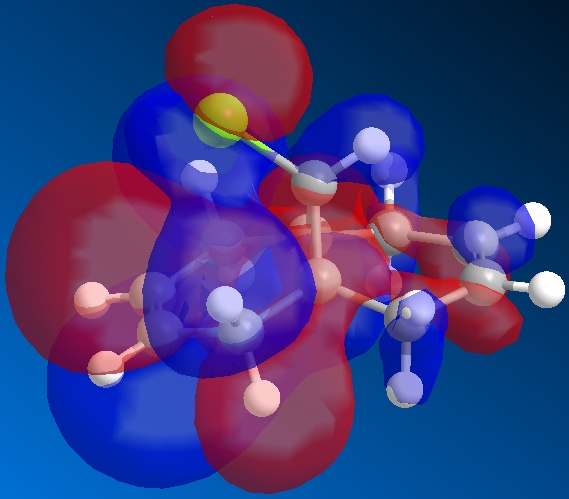
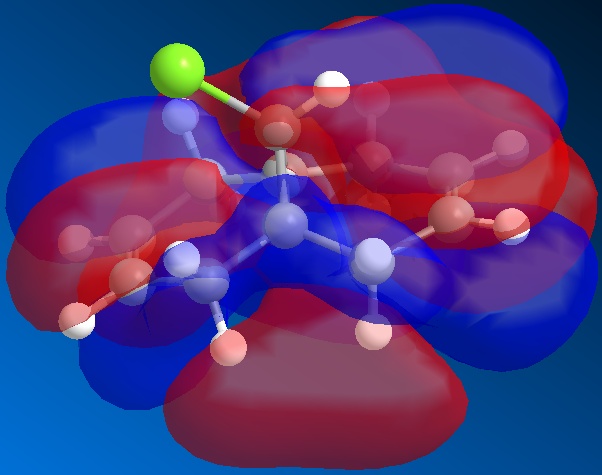
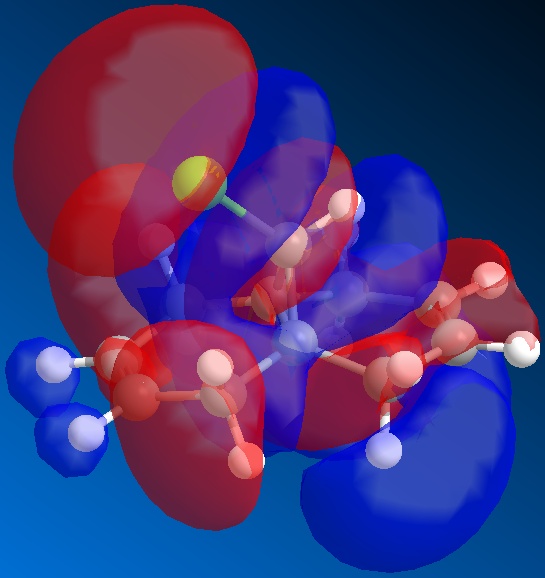

From the above figures, the relative reactivity of the two alkene groups towards electrophiles and nucleophiles can be justified. By Looking at the LUMO of the molecule, it can be seen this orbital is present only on the anti alkene. This means that if the molecule were to be attacked by a nucleophile, to electrons would be donated into this orbital and therefore attack would occur at the ant alkene. This would be seen under reaction of molecule 12 with dichlorocarbene (a nucleophile).
By looking at the HOMO of molecule 12, calculated using the more accurate gaussian interface, it can be seen there is more electron density (symbolised by larger orbitals) over the syn alkene. This denotes an area of high electron density. Therefore under reaction with an electrophile, the reaction would take place on the syn alkene as donation is more likely to occur from this earea, due to it's increased electron density in comparison to other areas of the molecule, particularly the anti C=C bond.
This justification can be summarised by saying that the syn alkene is reactive towards electrophiles, whereas the anti alkene is reactive towards nucleophiles.
Vibrational Spectra
The next section of this investigation looks at the vibrational (infrared) spectra of molecule 12 and it's dihydro derivative, molecule 13 which is pictured below.
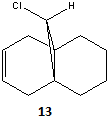
The molecular vibrations were calculated by optimising the geometry, firstly with MM2 force field, followed by MOPAC/PM6 and finally the Gaussian B3LYP/6-13G(d,p) method.
The results from this analysis then allowed the infrared spectra of each molecule to be predicted and relative frequencies and intensities of the C=C and C-Cl bonds to be noted.
Vibrational frequency analysis of molecule 12
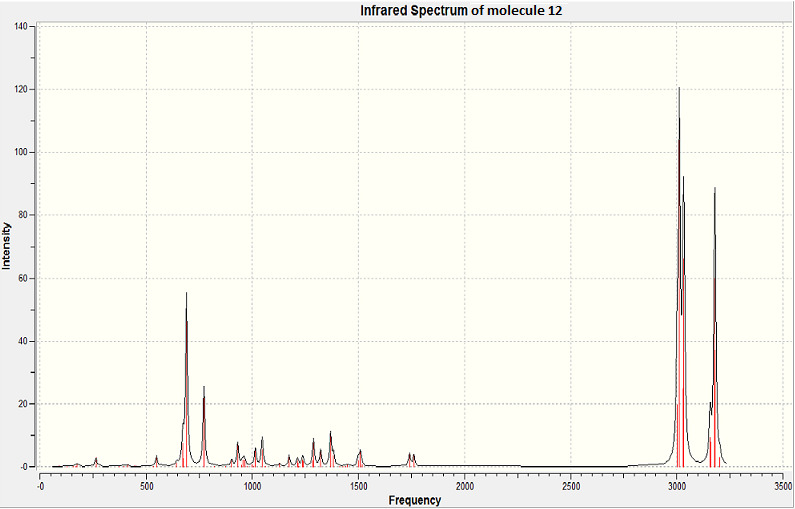
| Bond | Frequency / cm-1 | Intensity / arbitrary |
|---|---|---|
| C=C Anti | 1740 | 4.14 |
| C=C Syn | 1760 | 3.91 |
| C-Cl | 773 | 25.5 |
Vibrational frequency analysis of molecule 13
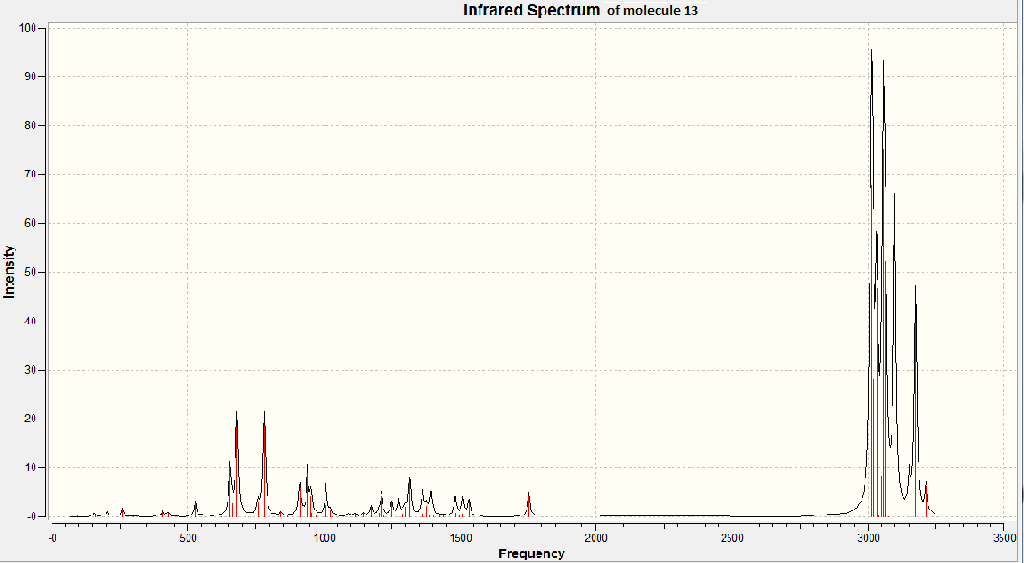
| Bond | Frequency / cm-1 | Intensity / arbitrary |
|---|---|---|
| C=C | 1750 | 5.04 |
| C-Cl | 780 | 21.4 |
Conclusions
From the above data it can be seen that there is a clear relationship between the C=C bond frequency and it's orientation with respect to the C-Cl bond. Through the analysis completed for molecule 12, it can be seen that the syn C=C bond has a higher vibrational frequency, than the C=C anti to the C-Cl bond. This trend can be explained using the electronegative nature of Cl. The syn alkene is closer to the electronegative Cl atom, which means more electron density is withdrawn from the syn C=C bond in comparison to the anti C=C bond. This reduction in electron density around the bond, leads to a reduction in bond strength, which in turn leads to a higher vibrational frequency for the syn C=C bond.
The intensity of the C=C and C-Cl peaks can also be evaluated. The intensity of an infrared vibrational peak is dependant on how often the vibration is allowed to occur and also on the change in dipole moment of the vibration. Looking at the first point, the very low intensity of the C=C bond vibrations can be justified. In both molecules (12 and 13) the C=C bonds are fixed in a ring. This hinders the amount of vibration which can be induced. This results in a very low intensity vibration. This effect if not seen for the C-Cl bond as this is nto fixed conformationally. Therefore rapid vibration can occur, resulting in a large intensity for this peak in both cases.
The second point shows that largely polar bonds will have higher vibrational intensities, as the vibration of the bond will result in a large change in the dipole moment. This change in dipole moment will be proportional to the height of the peak. This effect if seen for the C-Cl bond as the difference in electronegativity between C and Cl results in a large dipole moment (in comparison to the C=C bond). Because of the theory, as explained above, a large peak intensity is seen for the C-Cl bond. This effect is not seen for the C=C bond as the bond is not polar.
Structure based Mini project using DFT-based molecular orbital methods
In this project, two isomers (taken from literature) will be analysed. The 13C NMR and IR spectra will be predicted along with 1H J coupling constants. These values can then be compared to those stated in the literature and therefore the accuracy of the literature assignments can be tested. The optical properties of the isomers will also be calculated along with the nOe of highlighted protons.
The two isomers investigated can be found below. Molecules 14 and 15 are isomers of 2,3,4-Trimethoxy-5,6,9,9a-tetrahydrobenzo[α]azulene-7,10(4bH,8H)-dione, the synthesis and analysis of these molecules can be found in the following journal - P. A. Wender, R. T. Stemmler and L. E. Sirois, J. Am. Chem. Soc., 2010, 132, DOI:10.1021/ja910696x . The production of these isomers is the result of a [5+2] cycloaddition followed by Nazarov cyclisation.
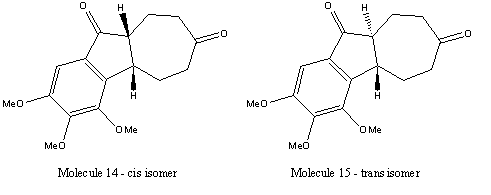
By comparing the two isomers, a list of spectroscopic and analytical techniques can be devised, which could be used to distinguish between these two isomers. Firstly 13C and 1H NMR could be used, however there is little change between the environments of the C and H atoms of the two isomers. This means little difference would be detected via NMR. This is similiar with vibrational spectra. The main technique for differentiation would result from calculation of the optical rotation of each molecule. As each isomer contains two chiral centres and only one chiral centre changes on conversion from cis to trans or vice versa. This means that the optical rotation measurements would be equal in magnitude but opposite in sign for the two isomers. NOe measurement (Nuclear Overhauser Effect) would also give an indication of which isomer was present in a sample.
The cis isomer was investigated first. The structure was minimised using an MM2 force field followed by a MOPAC/PM6 optimization. This optimized structure was then further optimized using a Gaussian interface with a DFT- mpw1pw91 method and 6-31G basis set. This method increases the accuracy of the molecular optimization stepwise, so to avoid any long job times. The increased accuracy of the geometry also reduces the time needed to calculate the NMR and vibrational spectra.
'NMR calculation for cis isomer
The 13C NMR spectra for the cis isomer (above) was calculated using a gaussian interface. The data can be found at DOI:10042/to-5657 and the produced spectra can be found below. This spectra was produced defining the reference as TMS mpw1pw91/aug-cc-pvdz CDCl3 GIAO.
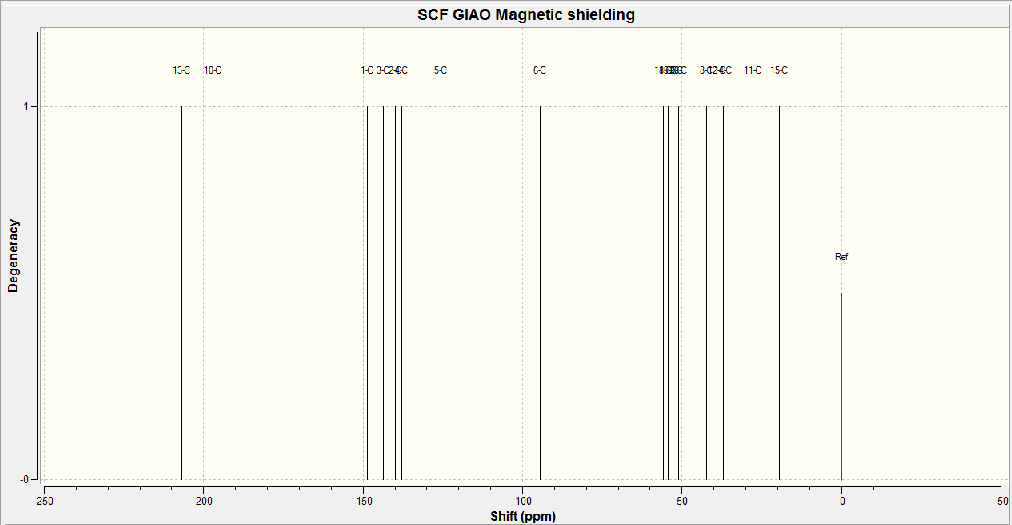
The peaks in the spectra above were also assigned to the cis isomer structure, thsi assignment and peak values can be found below.
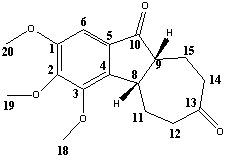
13C NMR (CDCl3): δ 20.0(C15) 28.0(C11) 37.2(C14) 39.2(C12) 42.5(C8) 51.2(C20) 51.8(C9) 54.3(C19) 55.1(C18) 94.2(C6) 125(C5) 138(C4) 140(C2) 143(C3) 148(C1) 197(C10) 207(C13) ppm
All data is quoted to 3 significant figures, to account for the error in the calculations.
These values can now be compared to literature. The literature 13C NMR data is as follows.
13C NMR (CDCl3, 100MHz): 21.3 25.1 40.4 42.0 42.1 51.3 56.2 60.8 61.0 100.4 131.5 142.7 148.2 150.3 154.7 205.8 211.5ppm
Comparing the above two sets of data it can be seen that there is good correlation between them, taking into account the error of the calculated NMR as 3-5ppm. This shows there is a good agreement between the data and the correct isomer was characterised in this case.
Vibrational spectrum of the cis isomer
The IR (vibrational) spectrum and vibrational frequencies and intensities of the cis isomer can be found at DOI:10042/to-5661
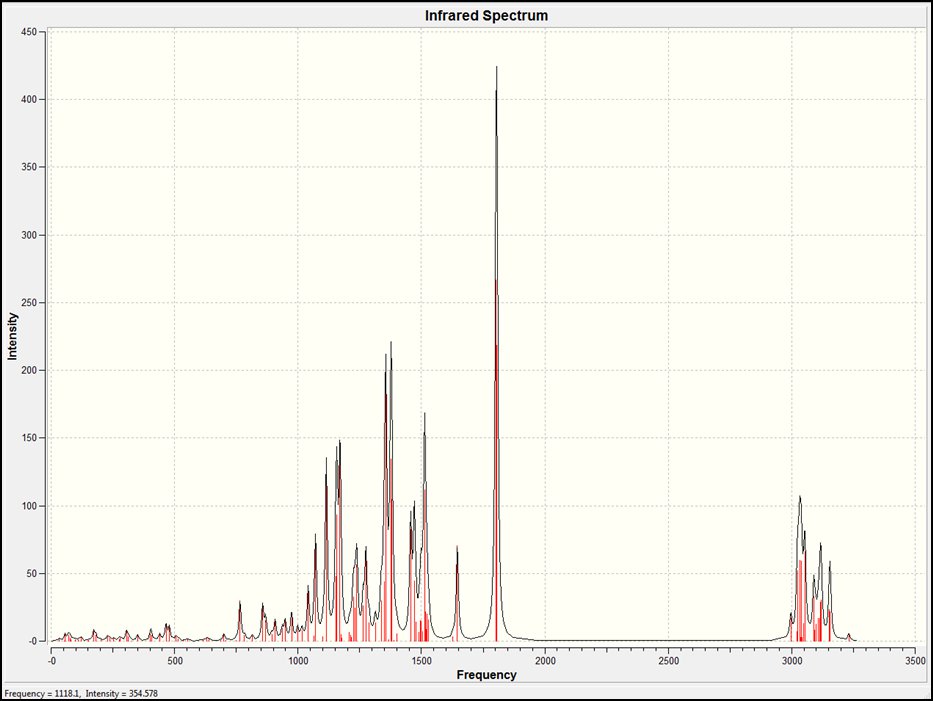
Using GaussView and the data produced by this calculation, the frequencies were analysed. It was first noted that all the bond vibrations were positive. This shows an optimised structure of the isomer was formed as opposed to a transition state.
13C NMR calculation of trans isomer
The 13C NMR spectra for the trans isomer was calculated also using a gaussian interface. The data can be found here DOI:10042/to-5658 and the produced spectra can be found below. This spectra was produced defining the reference as TMS mpw1pw91/aug-cc-pvdz CDCl3 GIAO.
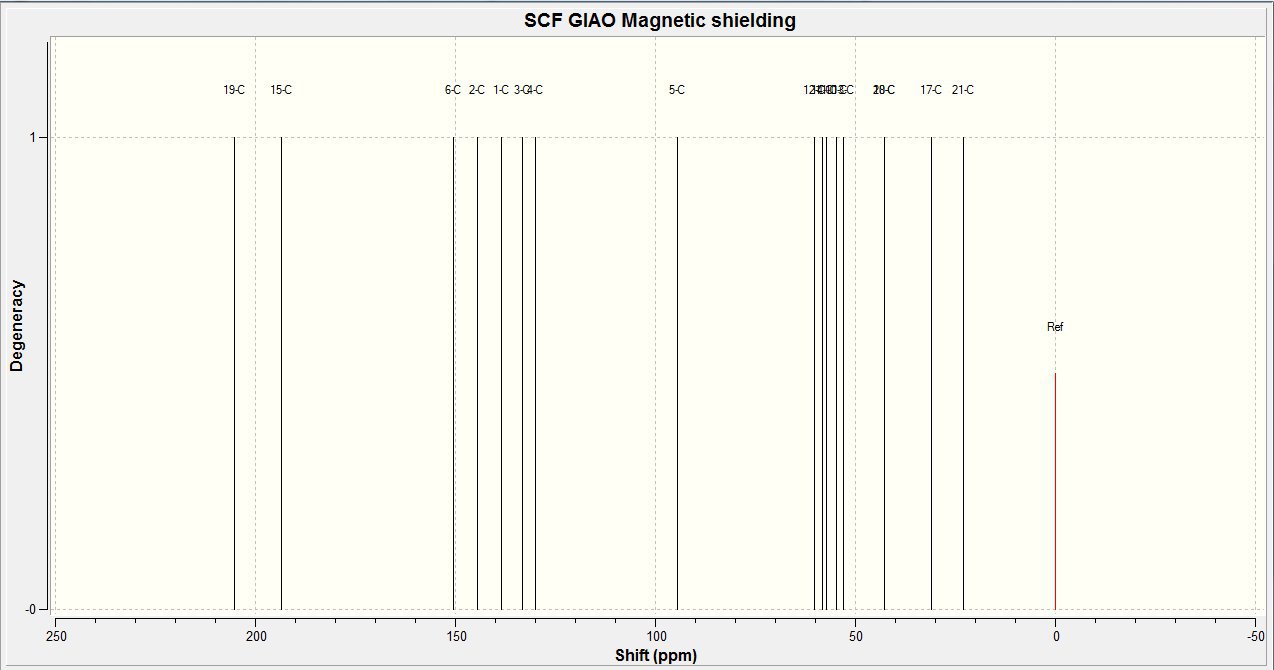
This spectra can also be assigned, as follows:
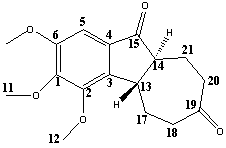
13C NMR(CDCl3): δ 22.5(C21) 30.7(C17) 42.7(C18) 42.8(C20) 52.3(C13) 54.7(C10) 57.3(C11) 58.2(C14) 60.3(C12) 94.8(C5) 130(C4) 133(C3) 138(C1) 145(C2) 150(C6) 193(C15) 205(C19) ppm
These values can now be compared to literature. The literature 13C NMR data is as follows.
13C NMR (CDCl3, 100MHz): 22.1 27.8 42.9 43.1 45.1 56.0 56.3 60.8 61.0 100.1 131.8 139.9 148.4 151.0 154.6 203.5 213.2ppm
From this it can be seen that there is a good relationship between the literature and calculated NMR data. As specific assignments are nto given in the literature, it is difficult to make further comparisons. However the spectra similarities suggests the correct isomer was identified here.
IR of trans isomer
The IR data for the trans isomer can be found at: DOI:10042/to-5662 . The spectrum can be found below.
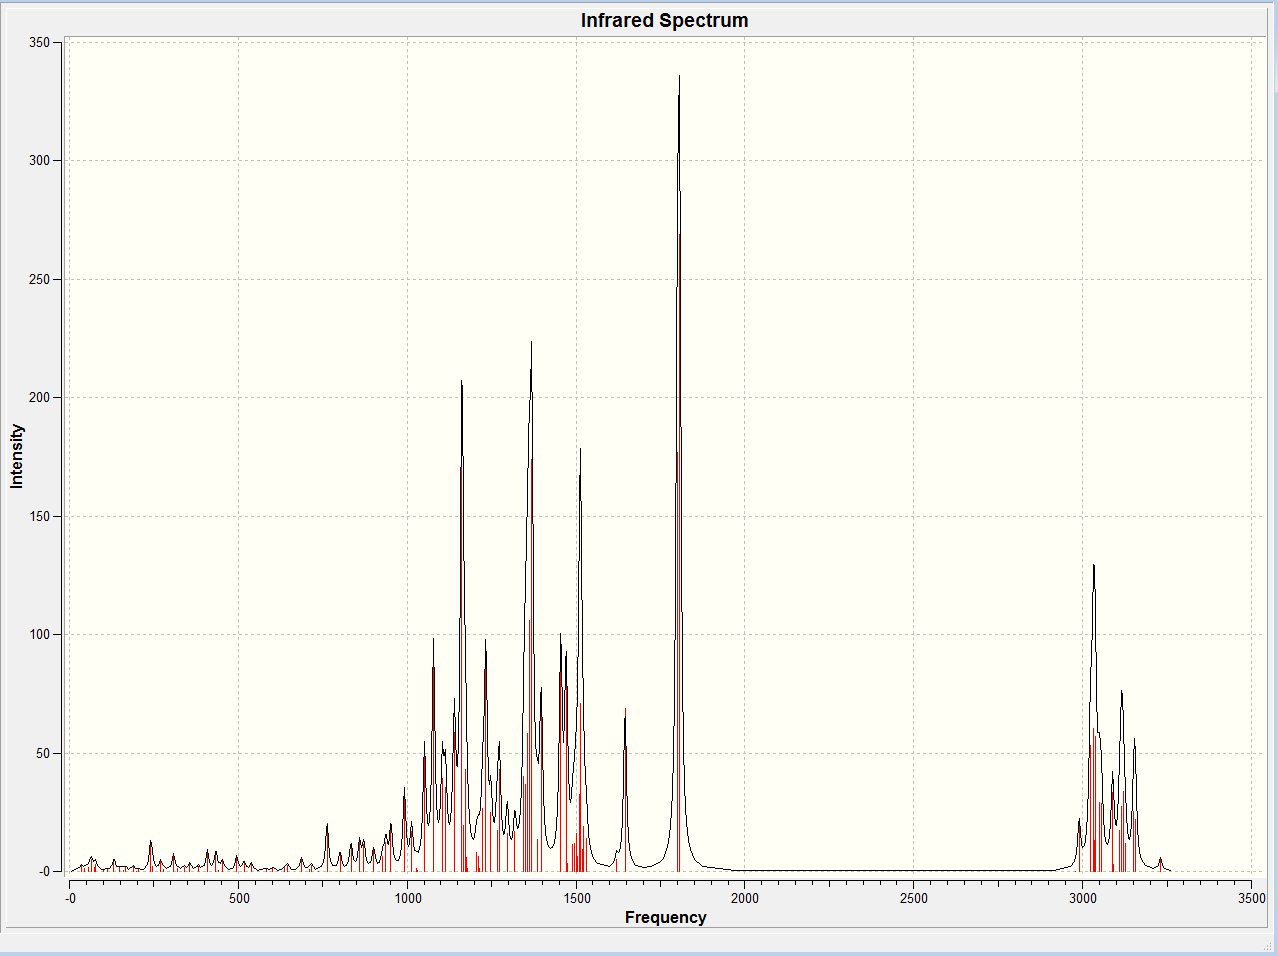
Again the vibrational frequencies were investigated. The bonds which undergo a change in orientation or conformation when converting between isomers are defined below.
| Bond | Frequency / cm-1 | Intensity / arbitrary |
|---|---|---|
| C-C (with cis H) | 936,857, 765 | 8.96, 26.0, 29.6 |
| C-C (with trans H) | 1104 | 39.2 |
| 2x C-H (cis) | 2996 | 16.8 |
| 2x C-H (trans) | 2980, 2990 | 0.089, 19.0 |
In the case of table 4 above, when multiple values are given the frequency and intensities are given respectively (i.e. Freq(1), Freq(2), Freq(3); Intensity(1), Intensity(2), Intensity(3).
Table... Also shows there is a small change in the vibrational frequencies of the concerned bonds between the cis and trans isomers.
These data sets can now be compared to the literature, please find the literature IR results for the cis and trans isomers below.
IR (cis, cm-1): 2942, 2838, 1704, 1698, 1471, 1418, 1343, 1318, 1245, 1200, 1122, 1093, 1039, 954, 927, 849, 767, 734.
IR (trans, cm-1): 2941, 2871, 2839, 1712, 1704, 1698, 1600, 1470, 1455, 1428, 1417, 1354, 1336, 1246, 1203, 1121, 1084, 1043, 1019, 970, 929, 850, 734.
Looking at the C-C vibration in the cis molecule, there are correlating vibrations seen in the literature (namely: 954, 849 and 767 cm-1). In the cis IR literature there is only one peak which correlates to the cis C-H vibration given by the calculation (2942cm-1)this value is at lower energy than the one calculated, however the vibrations are 40-50cm-1 apart which could be due to both the error of the experimental IR and the error of the calculated IR. Comparing the important vibrations of the trans isomer to literature, there are some vibrations in the same region, however similar to that explained about, this may be due to error.
From the IR data sets, it is clear that there is little difference between the IR results for the cis and trans isomers. This supports previous statements that IR would not be a useful technique to distinguish between these two isomers. The main distinguishing factor between the literature spectra are the increased number of vibration seen for the trans isomer.
Nuclear Overhauser Effect1
The nOe value for the cis isomer is stated in the supporting material of the journal investigated (P. A. Wender, R. T. Stemmler and L. E. Sirois, J. Am. Chem. Soc., 2010, 132, DOI:10.1021/ja910696x ). Because of this, the nOe value for the concerned protons will also be predicted.
The Nuclear Overhauser Effect involves the transfer of spin polarisation between two atoms through space, which occurs via cross-relaxation. This process differs from spin coupling, as NOE is dependant on spacial distance, whereas spin coupling is dependant on the distances through bonds.
Using Janocchio, the distances and nOe % values for the cis and trans protons highlighted in the cis and trans isomers can be calculated.
The results for these can be found below in table 5, where the results are also compared to the literature.
| Isomer | Spatial distance / nm | Janocchio nOe / % | Literature nOe / % |
|---|---|---|---|
| Cis | 0.231 | 3.98 | 5-7 |
| Trans | 0.31 | 0.69 | not reported |
The above table shows the calculated and experiment nOe value for the cis isomer is in agreement with the literature value. However the small difference may be due to error. For the trans isomer an nOe value was not given in the literature, however the calculated value shows that this value is very small as expected. A small value if expected for the trans isomer and the two trans protons are spatially far apart in comparison to the cis isomer, shown by the spatial distance reported above. As the Nuclear Overhauser Effect occurs through space, this results in a severe reduction in the nOe value between the cis and trans isomers.
Optical Rotation
As previously discussed, the optical rotation would be an accurate method to use to distinguish between the two isomers investigated here. However due to the size of the isomers (i.e. They are considered large as there are >20 non H atoms), the calculation was not attempted due to long running times. Although by comparing the isomers a definite change of sign for the optical rotation would be expected, however the magnitude should stay the same.
Relative stabilities of products
Using a MM2 force field. The isomeric products were also minimised to give the energy of the molecules. This will show whether the reaction is thermodynamically controlled for kinetically controlled.
It is noted in the supporting material of the journal investigated, that the cis: trans product ratio is 3.7:1.
We can now use the results of the optimisations of the cis and trans isomers to investigate this.
Minimisation of cis isomer
 MM2 Minimization
 Pi System:    6   1   2   3   5   4  15  16
 Warning: Some parameters are guessed (Quality = 1).
 Iteration    2: Minimization terminated normally because the gradient norm is less than the minimum gradient norm
 Stretch:                2.0722
 Bend:                  13.7281
 Stretch-Bend:           0.0020
 Torsion:                7.1055
 Non-1,4 VDW:           -5.2977
 1,4 VDW:               20.5878
 Dipole/Dipole:          0.6887
 Total Energy:            38.8866 kcal/mol          162.72 kJ/mol
Minimisation of trans isomer
 MM2 Minimization
 Pi System:    6   1   2   3   5   4  15  16
 Warning: Some parameters are guessed (Quality = 1).
 Iteration  261: Minimization terminated normally because the gradient norm is less than the minimum gradient norm
 Stretch:                2.3462
 Bend:                  15.9471
 Stretch-Bend:           0.1086
 Torsion:                3.9807
 Non-1,4 VDW:           -1.9707
 1,4 VDW:               19.3797
 Dipole/Dipole:          0.0898
 Total Energy:            39.8815 kcal/mol          166.86 kJ/mol
The above results show there is little difference in the overall energy of the two isomers. However the product ratio (cis 3.7: 1 trans) shows the cis isomer is considerably favourable. However the lower energy of the cis isomer shows that this reaction is controlled thermodynamically.
A way in which the cis isomer would be formed in larger quantities, would be by leaving the product mixture to stand. As the trans isomer is the kinetic product, and there is little energy difference between the isomers, overtime the trans product may equilibrate back into the products, allowing these to then re-react down the thermodynamic pathway. Therefore this would increase the ratio of cis:trans present in the solution.
References
1. Laurence M. Harwood and Timothy D. W. Claridge, Introduction to Organic Spectroscopy ISBN:978-0-19-855755-
