Rep:Mod: These aren't the droids your looking for
Tom Waugh
Module 2: Bonding
Small molecules: Borane, BH3
Geometry Optimisation
A BH3 molecule was drawn and optimised using Gaussian (B-H bond lengths set to 1.50 Å). This involved using the B3LYP method (approximations used) and 3-21G basis set (accuracy of obtained data). The optimisation involves two parts: firstly the SCF part which assumes a given position for the nuclei (e.g. B's and H's) and using the Schrodinger equation to solve for the electrons (or the electron density and energy). The second part involves solving for the position of the nuclei and is known as the OPT part of the calculation. During this calculation the position of the nuclei is varied and the SCF cycle is repeated at each geometry to obtain the geometry with the lowest energy. The key results are reported below in the table.
| Property | Value |
|---|---|
| B-H bond length (Å) | 1.193 |
| H-B-H bond angle (o) | 120 |
| Calculation type | FOPT |
| Calculation method | RB3LYP |
| Basis set | 3-21G |
| Final energy (a.u.) | -26.462 |
| RMS Gradient Norm (a.u.) | 0.000207 |
| Point group | D3h |
| Dipole Moment/ Debye | 0.00 |
| Structure |
|
Log File: DOI:/10042/to-7484
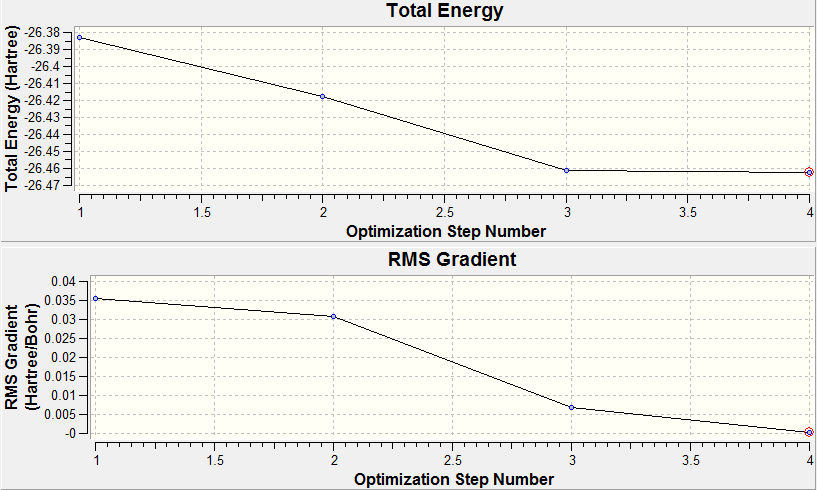
The table shows the optimised bond length and angle were found to be 1.19Å and 120o respectively. This is in good agreement with the values obtained by Galbraith et al[1] , as well as the values expected from VSEPR theory. The value of the gradient indicates the optimisation has been successful since the value should be ideally 0 (RMS gradient will be zero at the minimum energy). A value less than 0.001 is sufficient and shows the value of the energy doesn't change with small variations in geometry. The graphs below show the optimisation plots, first showing the total energy against optimisation step number which lowers to a minimum energy value. Below this is the RMS (root mean square) gradient change against optimisation step number which again converges to a minimum value (zero).
When the equilibrium bond distance between two atoms is found the energy of the molecule is at its minimum value whereby the nuclear repulsion potential energy (positive) is counter acted by the nuclear-electron attraction potential energy (negative). On the potential energy surface the equilibrium bond distance is the minimum in the potential energy well. Since the potential energy and force are related in the following equation F= -dU/dr, whereby F is the force, U is the potential energy and r is the internuclear separation. Whilst at equilibrium the force acting upon the molecule is zero, therefore the gradient (change in potential energy with respect to internuclear distance) of the potential energy surface is also zero i.e a minimum.
Molecular and Natural Bonding Orbitals
The molecular orbitals for BH3 were generated using Gaussian from the optimised geometry. This time however the method used was energy rather than optimisation in the "additional keywords" section "pop=full" was used to effectively switch on the population (MO) analysis. The eight lowest energy MO's are shown below and also compared visually to their corresponding MO's derived from the linear combination of atomic orbitals (LCAO).Log File: DOI:/10042/to-7491
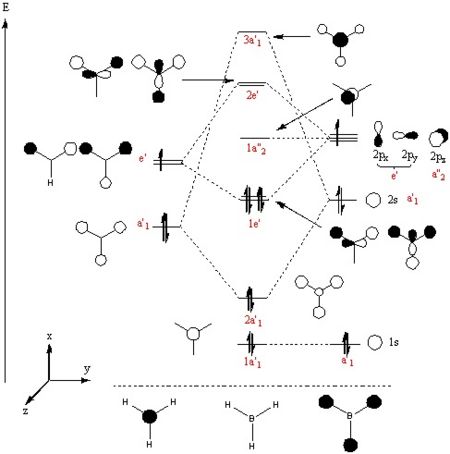
As it can be seen form the above table the MO's predicted from the LCAO approach match fairly well to their corresponding calculated MO's generated from Gaussian in terms of the shape, relative electron density and phase. There was only really one discrepancy found with the ordering of the MO's compared to those in Dr Hunt's 2nd year lecture course. The two highest energy levels 2e' and 3a'1 had slightly different orderings. The reason for this stems from a severe limitation of MO theory in that it is more of a qualitative approach and as a result it cannot accurately calculate the exact energies of the orbitals. This becomes a particular problem when non-degenerate MO's are close in energy, and hence where computers can help predict the correct ordering of the MO's. In the notes it was found that the 3a'1 orbital was lower in energy than the 2e' level (although there was no values given for relative energies of the molecular orbitals) although both arrangements are clearly possible depending on the energies of the two fragments (H3 and B fragment orbitals). The closer the two fragments are in energy the stronger the interaction of the orbitals, however it is difficult to quantify this and therefore make an estimate as to whether this interaction would raise the energy of the 3a'1 orbital above the 2e'. On the other hand Gaussian calculated the 3a'1 MO to be slightly higher in energy than the 2e'. Therefore MO theory is useful for predicting the size, shape and relative electron density of the lobes but Gaussian is able to give a much more quantitative picture of MO's and as a result is better for predicting their exact energy particularly when they are close in energy.
Below is the corrected MO diagram based upon the corrected energies of the MO's of BH3 built from the H3 and B fragment orbitals.
A Natural Bond Orbital (NBO) analysis was also carried out to better understand the charge distribution in the molecule. This is best shown in the diagram below.
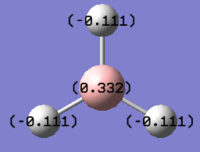
As it can be seen the charge distribution was found to be B= 0.331, H= -0.110. This is expected because of the molecules symmetry therefore each hydrogen atom is equivalent and the overall charge cancels to 0. Furthermore the positive value for boron also agrees that the boron centre is lewis acidic and therefore the more electropositive atom. Also form the resulting output information about the nature of the bonds could be extracted, for example it was found that the B-H bonds consisted of 44.5% from the boron atom and 55.5% came from the hydrogen atoms. the hybridisation could also be deduced from the data as it indicated that the bonding orbital from boron had 33.3% s character and 66.6% p character strongly suggesting sp2 hybridisation which is again in agreement with the expected result.
Vibrational Frequency Analysis
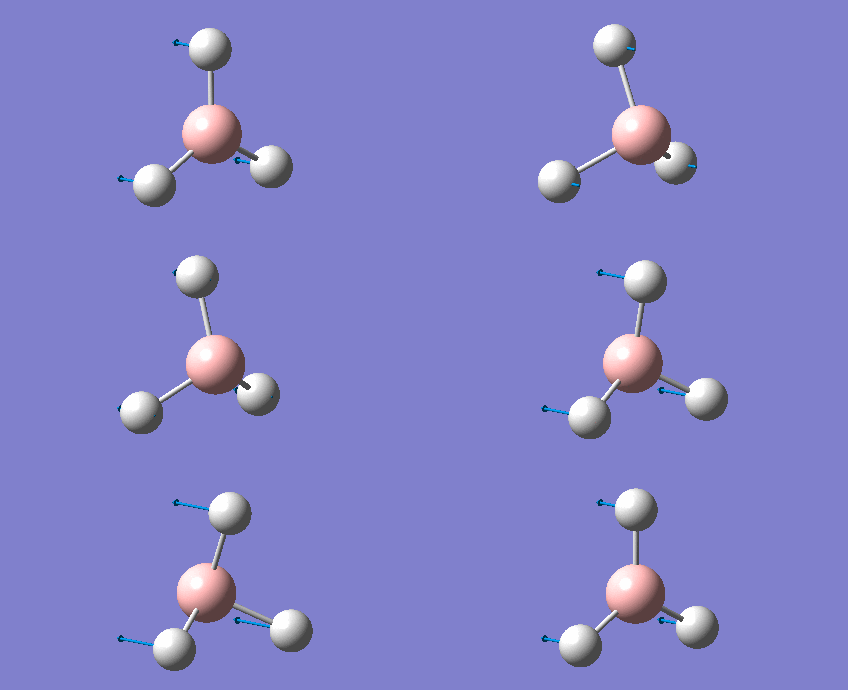
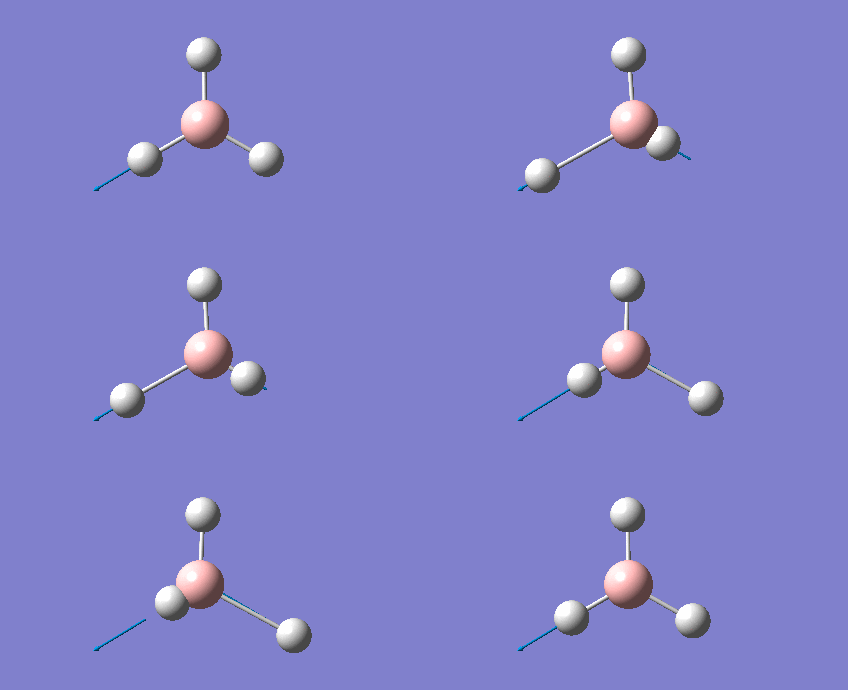
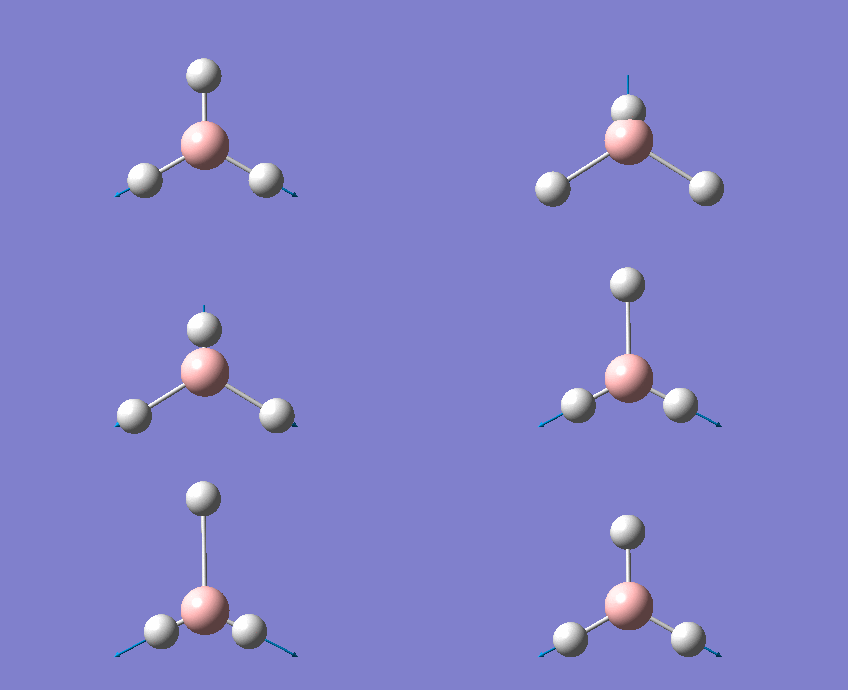
A frequency analysis was carried out upon the optimised BH3 structure, the resulting vibrations have been animated and the IR spectrum has been predicted. Log File: DOI:/10042/to-7516
The frequency analysis was carried out on the optimised BH3 molecule to test that a minimum in the potential energy surface had been calculated rather than a transition state (maximum). The frequency analysis therefore effectively calculates the second derivative (d2U/dr2 = k, rate of change of the restoring force as the internuclear distance changes) or essentially the curvature of the potential energy surface. For an energy minima it would expected that the vibrations should all be positive, if a negative frequency vibration had been calculated then this would suggest a transition state had been found. From the resulting output it was found that there were a total of six vibrations found all of which were positive therefore this confirms that optimised structure is a minima on the potential energy surface. From the output file it can be seen the 'low frequencies' were also calculated and were expected to be 0, however from the imprecision of the calculations some of the values for the frequencies were an order of magnitude smaller.
The molecule of BH3 (point group D3h) is expected to have 3N-6 vibrations (where N is the number of atoms), therefore a total of 6 vibrations were expected and 6 vibrations were calculated. However this would mean there should be 6 peaks observed in the predicted IR spectrum, as it can be seen below there were only 3 peaks observed and this is also the case experimentally. The reason for this is because vibrations 2 and 3 (1204cm-1) as well as 5 and 6 (2737cm-1) are degenerate and therefore have the same vibrational frequency so overlap. Furthermore vibration 4 was calculated to have an intensity of 0 therefore is not observed on the IR spectrum since there is no overall change in dipole moment (symmetric vibration) and is therefore not IR active.

TlBr3, Thallium Bromide
Geometry Optimisation
A molecule of TlBr3 was drawn in Gaussview 3 and optimised using a similar method as for BH3 with some slight modifications. A DFT-B3LYP method was used but this time the point group D3h was restricted to a high tolerance (0.0001). A LanL2DZ basis set which is a medium level basis set that involves pseudo-potentials. A higher level basis set was utilised to account for the heavier atoms having a more complicated electronic structure, LanL2DZ uses D95V on first row atoms and Los Alamos ECP on heavier atoms. The important results from the optimisation process are shown below.Log File: DOI:/10042/to-7517
| Property | Value |
|---|---|
| Tl-Br bond length (Å) | 2.65 |
| Br-Tl-Br bond angle (o) | 120 |
| Calculation type | FOPT |
| Calculation method | RB3LYP |
| Basis set | LANL2DZ |
| E(RB3LYP) (a.u.) | -91.21812851 |
| RMS Gradient Norm (a.u.) | 0.0000009 |
| Point group | D3h |
| Dipole Moment/ Debye | 0.00 |
| Structure |
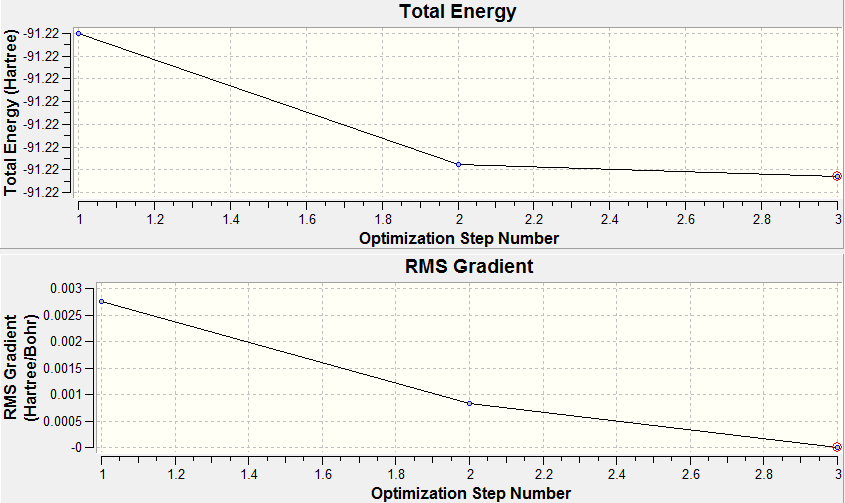
As it can be seen from the table the optimised (Tl-Br) bond length was found to be 2.65Å with the Br-Tl-Br bond angle of 120o. This is in good agreement with the results found by by Glaser et al[2] who found the following Tl-Br bond length =2.52Å and Br-Tl-Br bond angle = 120o. The differences observed between the calculated and the literature values probably originates from the errors associated with the approximations used, one way to improve the accuracy would be to use a larger basis set which takes into account all of the core electrons. Unfortunately however this would take a lot longer to calculate (hence why the core electrons are modelled using pseudo potentials). Both the optimisation plots shown below confirm that the energy calculated was a minimum as the total energy has converged to a minimum value and the RMS gradient has converged to zero at the same point the minimum energy was obtained.
Vibrational Frequency Analysis
Again a vibrational frequency analysis was carried out to confirm that the optimised geometry was a minimum. However this time the method and basis sets were kept the same as for the optimisation again taking the second derivative of the potential energy curve. If a different method or basis set was used in the vibrational frequency analysis then it would not be possible to compare the data as the data from the frequency analysis would be for a different potential energy surface. The most important properties are listed below from the output file. Log File: DOI:/10042/to-7536
| Low frequencies cm-1 | Normal or "real" Frequencies cm-1 |
|---|---|
| -3.4213 | 46.4289 |
| -0.0026 | 46.4292 |
| -0.0004 | 52.1449 |
| 0.0015 | 165.2680 |
| 3.9367 | 211.6950 |
| 3.9367 | 211.6950 |
The low frequencies and the lowest "real" normal modes are shown above in the table and although the values are quoted to 4 decimal places it is important to note that the vibrational frequencies have quite a substantial error associated with them of around 10%. They are simply written this way to show the very small differences. A it can be seen from the table above the "real" or normal modes are all positive confirming that the geometry obtained from the initial optimisation is a minima on the potential energy surface (and hence not a transition state). Furthermore from the summary output the total energy was identical to that found from the initial optimisation this leads to the conclusion that the vibrational analysis results are valid. Finally the low frequencies calculated are very close to zero and are all much smaller than the real vibrational frequencies, some are negative due to small errors associated with the method and basis set but nonetheless show that they are to set to an acceptable level.
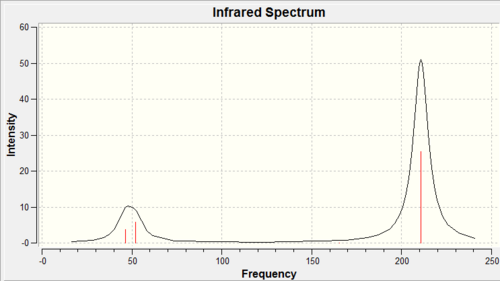
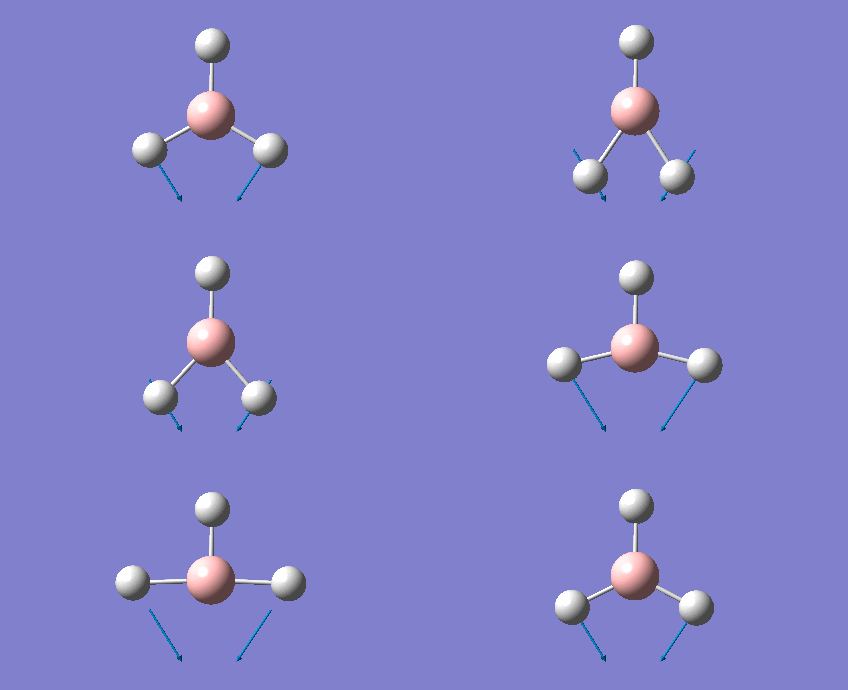
Like BH3, TlBr3 is a symmetric molecule and thus it would be expected to have 3N-6 vibrations (where N is the number of atoms). Indeed this is what is observed from the resulting output file as 6 vibrations were calculated, however only two peaks were observed in the predicted IR spectrum. For the same reasons as BH3 the degeneracies of the vibrations at 46cm-1 and 211cm-1 overlap and the vibration at 165cm-1 which had a calculated intensity of zero. The reason for this was due to the fact this was a symmetric stretch of all three Br atoms in the TLBr3 plane and therefore there was no overall change in dipole moment and thus IR inactive. The reason only two peaks were observed was due to the close proximity of the degenerate vibrational frequencies at 46cm-1 and the frequency at 52cm-1 which merge to give a broad peak.
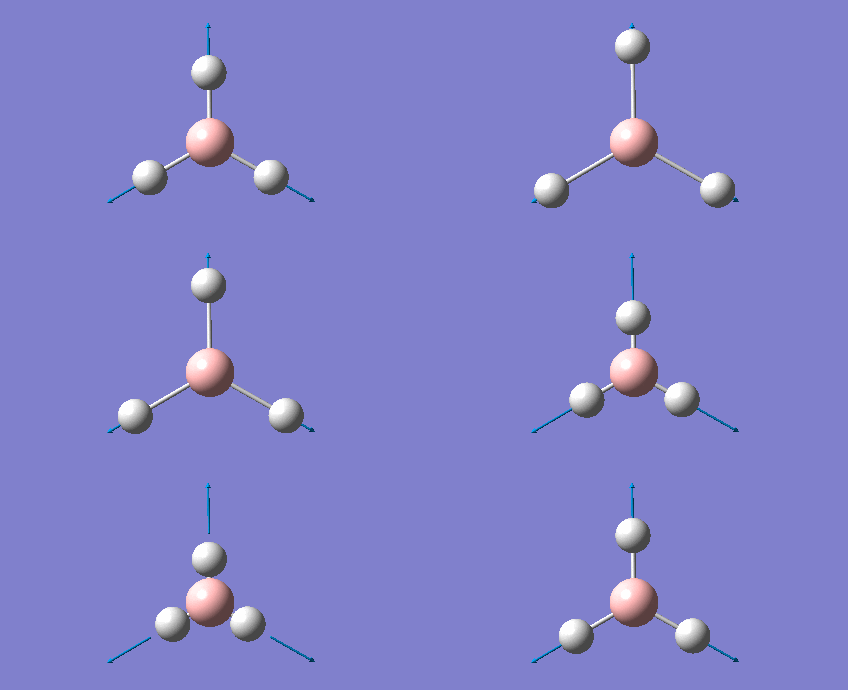
Sometimes Gaussview does not draw chemical bonds as expected. This is because Gaussview has a set of pre-determined parameters that define a chemical bond. It also has a maximum for the bond length so as to distinguish between a bond and an interaction. From the optimised geometry if the bond length exceeds the maximum value set by Gaussview then it does not draw bonds between atoms but instead a bonding interaction. This does not mean there is not a bond there as demonstrated in the vibrational frequencies shown above. However in BH3 when the bond lengths were set to 1.5 Angstroms the bonds disappeared as this separation was not considered a bond by Gaussview.
A bond is not a visible line between two atoms, instead it is a region of electron density between two nuclei. This interaction leads to a lower energy than either of the two nuclei separated. These interaction can include ionic, covalent, Van der Waals, H bonding, dipole-dipole etc. the interaction is a result of electromagnetic force attraction between opposite charge for example nuclei and electrons or even dipole interactions. Finally it can be difficult to truly know when a bond distance is too long to be considered a bond since the nature of the bond is heavily dependant upon the two atoms involved.
Isomers of Mo(CO)4L2
Geometry Optimisation
Mo(CO)4(PPh3)2 can exist in both cis and trans forms. If time and computing power was not an issue then the optimised geometries would have been calculated as well as the frequency analysis for both molecules. As a result the bulky Ph3 groups were modified and replaced with chlorine atoms which in themselves are quite large but also have interesting electronic characteristics. Therefore the cis and trans forms of Mo(CO)4(PCl3)2 were investigated starting with optimising their geometries. This was done in two separate stages (to account for the differing electronic structures of all the atoms present) firstly both structure were drawn in Gaussview and their geometries were optimised by using the DFT-B3LYP method. Initially the low level basis set LANL2MB was used to get a rough geometry using the key words "opt=loose". This calculation gave generally good bond lengths and angles but was less accurate in calculating dihedral bond angles.
| cis-Mo(CO)4(PCl3)2 | trans-Mo(CO)4(PCl3)2 | |
|---|---|---|
| File type | .log | .log |
| Calculation Type | FOPT | FOPT |
| Calculation Method | RB3LYP | RB3LYP |
| Basis Set | LANL2MB | LANL2MB |
| E(RB3LYP)a.u. | -617.5250 | -617.5220 |
| RMS Gradient Norm /a.u. | 0.00007137 | 0.00003587 |
| Dipole Moment/ Debye | 8.46 | 0.00 |
| Point Group | C1 | C1 |
| D-space link | DOI:10042/to-7558 | DOI:10042/to-7559 |
| Structure |
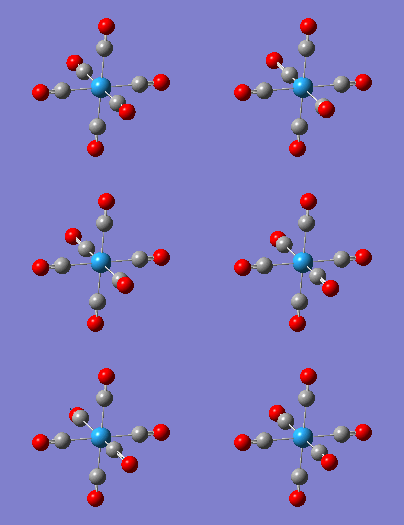
After the first optimisation it was observed from the resulting output file the P-Cl bond had disappeared, this made it difficult to rotate the PCl3 into their preferred orientations. Therefore the the P-Cl bonds were redrawn in and rotated as follows. For the cis isomer it was made sure one of the Cl points up parallel to the axial bond (dihedral 0o) whilst a Cl on the other P atom points down parallel to the axial bond. By redrawing all the bonds this made rotating all the Cl atoms much easier. Finally for the trans isomer it was ensured that both PCl3 groups were eclipsed and that one Cl of each group lied parallel to one Mo-C bond. By starting from this geometry it made it easier to find the minima with the lowest energy and importantly not the wrong minima. Afterwards the new geometries were optimised again using the DFT-B3LYP method with the LANL2DZ pseudo-potential and basis sets with the key words "int=ultrafine scf=conv=9" ( this increases the electronic convergence since a much better pseudo-potential and basis set are used). The results of the second optimisation are shown below.
| cis-Mo(CO)4(PCl3)2 | trans-Mo(CO)4(PCl3)2 | |
|---|---|---|
| File type | .log | .log |
| Calculation Type | FOPT | FOPT |
| Calculation Method | RB3LYP | RB3LYP |
| Basis Set | LANL2DZ | LANL2DZ |
| E(RB3LYP)a.u. | -623.5771 | -623.5760 |
| RMS Gradient Norm /a.u. | 0.00000310 | 0.00003072 |
| Dipole Moment/ Debye | 1.31 | 0.31 |
| Point Group | C1 | C1 |
| D-space link | DOI:10042/to-7613 | DOI:10042/to-7614 |
| Structure |
During all the optimisations the RMS gradient norms were all less than 0.0001 a.u. indicating that all the calculations converged to a minimum. The table shows that with each optimisation the total energy fell as expected (since better basis set and pseduo-potentials were used). The total energies from the second optimisation indicate the cis isomer is lower in energy by 2.89kJ mol-1 (1 Hartree = 2625.5 kJ mol-1). However the calculated energies have an associated error of 10 kJ mol-1 and since the difference in energy between the isomers is less than the error it is difficult determine which isomer is most stable based on these values. Both products have been synthesised whereby the cis isomer was the kinetic product and the trans isomer was the thermodynamic product. In the literature[3] it was found that the trans isomer was lower in energy than the cis product. This makes sense because when bulky PR3 ligands were used (where R=Cl or even more sterically demanding Ph)in the trans isomer the two ligands would be furthest from one another so this would reduce the steric strain between the groups. Furthermore the dipole moment in the trans isomer (0.31) is lower than the dipole moment found in the cis isomer (1.31), again this is due to the orientation of the bulky ligands. In the trans isomer the effect of each group cancels each other out since the dipole is almost zero whereas in the cis isomer the groups are right next to one another and therefore effect the electron distribution more.
Finally by changing the substituents on the phosphorus atom i.e. using more bulky groups (R=Ph) could increase the stability of the trans isomer with respect to the cis form since in the since isomer the high steric strain between the Ph groups would raise the energy of the cis isomer making the trans isomer (which would relieve the steric strain) more stable. Also by using a more electronegative atom (e.g. F)in place of Cl may increase the dipole moment of the cis isomer therefore making it more unstable relative to the trans isomer. On the other hand by using smaller ligands that may H bond to one another may lower the energy of the cis form due to this stabilising interaction which would not be possible in the trans form.
Structural Analysis
The bond lengths and bond angles for the two optimised geometries of Mo(CO)4(PCl3)2 are reported in the following tables and compared to literature where appropriate (literature values were calculated from X-ray crystallography).
| Bond | Calculated /Å | Literature[4] /Å |
|---|---|---|
| Mo-C (eq) | 2.012 | 1.972 |
| Mo-C (ax) | 2.058 | 2.059 |
| Mo-P | 2.512 | 2.576 |
| C-O (eq) | 1.176 | 1.158 |
| C-O (ax) | 1.173 | 1.136 |
| Angle | Calculated /o | Literature[4] /o |
| P-Mo-P | 94.2 | 104.6 |
| C-Mo-C | 178.4 | 174.1 |
| P-Mo-C | 176.1 | 173.2 |
| Bond | Calculated /Å | Literature[5] /Å |
|---|---|---|
| Mo-C | 2.060 | 2.005 |
| Mo-P | 2.445 | 2.500 |
| C-O | 1.173 | 1.164 |
| Angle | Calculated /o | Literature [5] /o |
| P-Mo-P | 177.4 | 180.0 |
| C-Mo-C (cis) | 90.5, 89.5 | 92.1 |
| C-Mo-C (trans) | 180.0, 179.0 | 180.0 |
| P-Mo-C | 91.3, 88.7 | 87.2, 92.0 |
The structural data from the optimised geometries of the Mo(CO)4(PCl3)2 structure is summarised above, it is important to note that the literature values quoted are for the closely related complex Mo(CO)4(PPh3)2. The bond angles and lengths can be compared because as mentioned earlier they have similar properties, although some bond lengths/angles were not mentioned due to the different atoms involved. As it can be seen from both tables bond lengths and angles match reasonably well with the literature and certain trends were observed. For example in the cis isomer the Mo-P bonds were longer than in the trans isomer, this was probably due to the cis isomer trying to minimise the steric clash between the bulky ligands (Al or Ph). On the other hand some of the bond angles in particular for the cis isomer do not match very well to the literature this was clearly demonstrated by the P-Mo-P bond angle which was ~10o out from expected. The main reason for this was probably due to the differences in size between the Cl and Ph groups, since the Ph group is slightly larger the bond angle would also be expected to be slightly larger i.e. to minimise the steric clash between the groups. A less likely reason for this difference in bond angle could be that due to having to rotate the PCl3 groups it may be possible that the wrong minima and not the true minima has been found, therefore altering the structure may be necessary to find the actual lowest energy geometry for the cis isomer. Finally another reason why the bond angles differ from those in the literature may be because the low lying d orbitals of the phosphorus atom were not taken into account and therefore the hypervalency of phosphorus was also not included in the calculations.
There were several general trends observed from the tables reported above, firstly the literature implies that the Mo(CO)4(PPh3)2 has a more strained structure than the calculated complex since the bond lengths and angles were usually larger and as previously mentioned this was due to the larger steric strain of the Ph groups compared to Cl. Also the tables show that the bond angles/ lengths differ for axial and equatorial positions in both isomers, this was as expected since the geometry of both isomers changes from true octahedral geometry because of the bulky ligands (PCl3/PPh3).
Vibrational Frequency Analysis
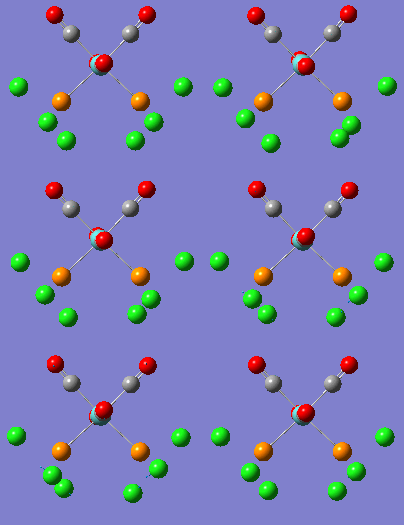
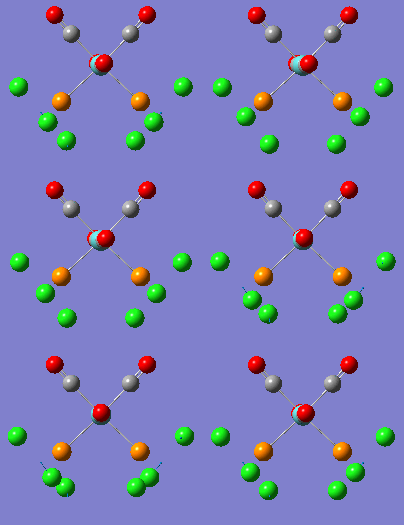
A vibrational frequency analysis was carried out to confirm the optimised geometries where a minimum and not a transition state, it was found for both isomers that there were no negative vibrations and therefore confirmed a minimum had been calculated. It is important to note that not all vibrations were reported here instead only the low frequency vibrations and CO stretches were reported.
| Cis isomer DOI:10042/to-7641 | Trans isomer DOI:10042/to-7642 | ||||||||
|---|---|---|---|---|---|---|---|---|---|
| Vibration | Frequency cm-1 | Intensity | Description | Symmetry (C1) | Vibration | Frequency cm-1 | Intensity | Description | Symmetry (C1) |
 |
11 | 0.0264 | Conrotation of the PCl3 groups, whereas the Mo(CO)4 fragment is virtually stationary | a |  |
5 | 0.0941 | PCl3 groups rotate in the same direction opposite to the Mo(CO)4 fragment | a |
 |
18 | 0.0073 | Disrotation of the two PCl3 whereas the Mo(CO)4 fragment is virtually stationary | a |  |
6 | 0.0000 | PCl3 groups rotate in opposite directions | a |
The low frequencies calculated correspond to the rotations of the PCl3 groups around the Mo-P axes. The thermal energy at room temperature (298K) is given by KBT = 2.5kJ mol-1 this translates to ~210cm-1 and since all the vibrational frequencies calculated above were below 20cm-1 this means that at room temperature the molecules will have more than enough energy (>10x) to allow these rotations to occur.
| Cis isomer | Trans isomer | ||||||
|---|---|---|---|---|---|---|---|
| Frequency/ cm-1 | Intensity | Literature[6] frequency Mo(CO)4PCl3/cm-1 | Symmetry | Frequency cm-1 | Intensity | Literature[6] frequency Mo(CO)4PCl3/cm-1 | Symmetry |
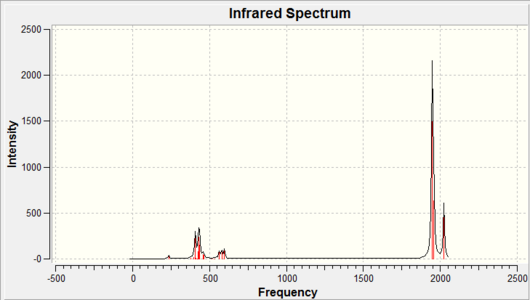
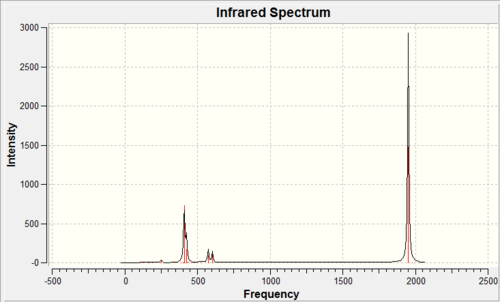
| 1945 | 762.9 | 1986 | B2 | 1950 | 1475.4 | 1896 | EU |
| 1949 | 1498.4 | 1994 | B1 | 1951 | 1466.8 | 1896 | EU |
| 1958 | 632.8 | 2004 | A1 | 1977 | 0.6 | - | B1g |
| 2023 | 597.8 | 2072 | A1 | 2031 | 3.8 | - | A1g |
 |
| ||||||
As it can be seen above the calculated IR spectrums match fairly well to the literature values reported for the CO stretching vibrations. The cis isomer shows four stretching vibrations whereas the trans isomer displays a single vibrational frequency on the IR spectra. The reason for this can be deduced from the symmetry of the molecules, as the cis isomer has apparent C2v symmetry with the irreducible representation 2A1 + B2 + B1. All of these are IR active so should be expected to be calculated, also the trans isomer had D4h (assuming the PCl3 groups rotate rapidly) symmetry so has the irreducible representation B1g + A1g+ EU whereby only EU is IR active. Therefore it would be expected from the calculations that the cis isomer should give rise to four carbonyl peaks whereas the trans isomer should give a single peak, unfortunately this is not the case. The cis isomer does give four calculated CO IR vibrational frequencies whereas the trans isomer was also calculated to have four carbonyl peaks. The reason for this is because the point group of the trans isomer was not restricted to the D4h symmetry therefore distortions have modified the symmetry of the molecule giving rise to four carbonyl stretching frequencies. For the trans isomer the stretching frequencies observed at 1950cm-1 and 1951cm-1 should be degenerate and hence overlap giving a single peak whereas the the vibrations at 1977cm-1 and 2031cm-1 have a very low intensity since the geometry was not restricted to D4h symmetry and are therefore not observed on the spectrum.
As it can be seen from the above tables the calculated IR frequencies for the cis isomer are around 50cm-1 lower than the literature values whereas the in the trans isomer the calculated vibrational frequencies are ~50cm-1 higher than the literature values. However since the error associated with the calculation of the vibrational frequencies is ~10% this correspond to ~200cm-1 either way of the literature values. Therefore the calculated IR frequencies are reasonably accurate to within experimental error. The reason for this large error is because the vibrations are treated as harmonic oscillations rather than using the more realistic anharmonic approximation.
Mini Project- Hexacarbonyl complexes
Introduction
M(CO)6 complexes where the central metal is a group 6 transition metal (M= Cr, Mo and W) are useful starting precursors for many organic and inorganic reactions due to the differing lability of the carbonyl ligands. All three complexes are white compounds which are both volatile and air stable derivatives of the metal in its zero oxidation state. During this investigation the geometries were optimised using a mixed basis set and pseudo-potentials. The vibrational frequency analysis was calculated to first prove the optimised geometries were minima's on the potential energy surface and to also highlight the vibrational modes and compare them to literature. Finally the molecular orbitals and NBO analysis was also carried out to try and rationalise the observed structural and vibrational characteristics of each complex.
Geometry Optimisation
The geometry of the three metal carbonyl complexes Cr(CO)6, Mo(CO)6 and W(CO)6 were optimised using the same method in each case. Different basis sets were used on different atoms to account for the difference in electronic structure of the heavy transition metals as well as the delocalisation of the carbonyl moiety. All the molecules were first drawn in Gaussview 3and in all calculations the method used was DFT-B3LYP. The basis set in all optimisations were originally set to "GEN" using the additional keywords "pseudo=cards gfinput", the resulting output file was not submitted to SCAN but instead edited to add the psuedo potentials. In each case the LanL2-DZ pseudo-potential and basis sets were used for the heavy metal centres and the for the carbon and oxygen atoms the 6-31G(d) basis set was used (notice no "p" present since there are no H atoms). The new modified input file containing the mixed basis sets was submitted to SCAN, giving the following output.
| Cr(CO)6 | Mo(CO)6 | W(CO)6 | |
|---|---|---|---|
| DOI:10042/to-7742 | DOI:10042/to-7743 | DOI:10042/to-7744 | |
| Structure | |||
| File Type | .log | .log | .log |
| Calculation Type | FOPT | FOPT | FOPT |
| Calculation method | RB3LYP | RB3LYP | RB3LYP |
| Basis set | GEN | GEN | GEN |
| E(RB3LYP) (a.u.) ±0.004 | -766.368 | -747.628 | -747.931 |
| RMS Gradient Norm (a.u.) | 0.0000983 | 0.0000385 | 0.0001039 |
| Dipole Moment (Debye) | 0.00 | 0.00 | 0.00 |
| Point Group | Oh | Oh | Oh |
| Job cpu time | 6 mins 54 secs | 7 mins 21 secs | 7 mins 4 secs |
From the above table it can be seen that the all of the RMS gradients were less than than 0.001 and therefore all optimisation calculations converged to a minimum (RMS gradient should be zero at the minimum energy). It can also be observed from the tables above that the geometry of the optimisations stayed the same between all three complexes as expected giving the overall point group symmetry Oh. Finally all calculations took roughly the same amount of time to fully optimise the geometry.
Structural Analysis
The M-CO bond lengths and OC-M-CO bond angles are reported below and compared to that reported in the literature[7].
| Bond | Cr(CO)6 | Lit[8].Cr(CO)6 | Mo(CO)6 | Lit[7].Mo(CO)6 | W(CO)6 | Lit[7].W(CO)6 | |
|---|---|---|---|---|---|---|---|
| M-CO /Å | 1.915 | 1.918 | 2.079 | 2.063 | 2.069 | 2.058 | |
| C-O /Å | 1.149 | 1.141 | 1.149 | 1.145 | 1.151 | 1.148 | |
| Angle | |||||||
| OC-M-CO (ax+eq)/o | 90.000 | 90.000 | 90.000 | ||||
| OC-M-CO (ax/eq+ax/eq)/o | 180.000 | 180.000 | 180.000 | ||||
As it can be seen from the table above the calculated M-C bond lengths agree strongly with the reported literature[7]. For example as observed in the literature there was a trend that the CO bond length would increase and this is what is observed from the data above (although values only quoted to 3 decimal places). The reason for this is probably better explained after consideration of the calculated molecular orbitals and vibrational frequency analysis. However more interesting to note about the data in the above table is the general trend of the M-CO bond in that it follows the exact same trend observed in the literature i.e. that the Mo-CO bond is longest and the W-CO bond is slightly shorter. This was not initially expected since as you go down the group the atomic radii increase since more and more shells are added, and since the metal centres being investigated here are all in the same group (six) and consequently have the same d occupancy- d6. Therefore it was expected that the charge on the metal centre would not vary drastically and only the size of the atomic radii would increase and as a result the M-C bond would also increase to minimise the steric interaction between the two. However this is not the case and observed both in the calculated data and those reported in the literature both show that the Mo-CO bond is the longest. Unfortunately in the original literature the reason form this was explained but in another piece of literature Ziegler et al[9] reported almost identical bond lengths to that of the original literature and the trend was also noticed. Ziegler[9] attributes this strange trend to a relativistic stabilisation of the M-CO bond (CO is a π* acceptor) whereby the "relativistic destabilization"[9] of the 5d metal orbitals increases the back-donation to the CO ligand. The 5d levels(in tungsten) are destabilized as relativity contracts the core orbitals and lowers the effective nuclear charge, therefore the lanthanide contraction (since tungsten has filled 4f orbitals) contracts the size of the atomic radii and as a result forms a shorter M-CO bond but in turn lengthens the CO bond from back-donation.
The calculated bond angles do not really explain much about the molecule and as calculated above were identical in each of the three molecules, even in the literature there was no much distortion from octahedral symmetry as reported by Whitaker et al[10] who found that for example the Cr-C-O bond angle was collinear to within 1.8o.
Vibrational Frequency Analysis
A vibrational frequency analysis was originally carried out to confirm the optimised geometries calculated were in fact minimas. Since there were no calculated frequencies for any of the three hexacarbonyl compounds it was concluded that the structures calculated were indeed minimas and not transition states. The vibrational frequency analysis was carried out using the same pseudo-potential and basis sets that were used in the optimisation calculations to mimic the original potential energy surface and thereby making the results comparable. For ease of comparison to literature only the CO and M-CO stretching frequencies are reported and were compared to the trend in the corresponding bond lengths found earlier.
| Cr(CO)6 DOI:10042/to-7755 | Mo(CO)6 DOI:10042/to-7756 | W(CO)6 DOI:10042/to-7757 | ||||||
|---|---|---|---|---|---|---|---|---|
| Frequency cm-1 | Intensity | Lit[11]. frequency Cr(CO)6 | Frequency cm-1 | Intensity | Lit.[11] frequency Mo(CO)6 | Frequency cm-1 | Intensity | Lit.[11] frequency W(CO)6 |
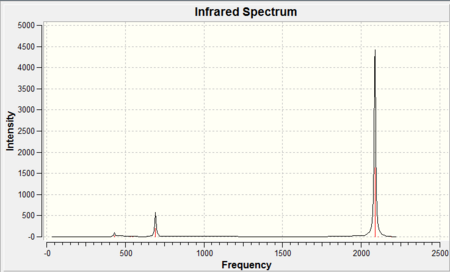
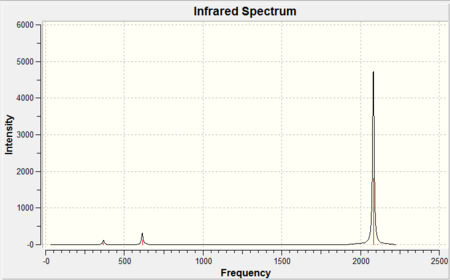
| 2087 | 1637 | 1993 | 2081 | 1810 | 1991 | 2075 | 1932 | 1986 |
| 2087 | 1637 | - | 2081 | 1810 | - | 2075 | 1932 | - |
| 2087 | 1637 | - | 2081 | 1810 | - | 2075 | 1932 | - |
| Cr(CO)6 | Mo(CO)6 | W(CO)6 | ||||||
|---|---|---|---|---|---|---|---|---|
| Frequency cm-1 | Intensity | Lit.[11] frequency Cr(CO)6 | Frequency cm-1 | Intensity | Lit.[11] frequency Mo(CO)6 | Frequency cm-1 | Intensity | Lit.[11] frequency W(CO)6 |
| 430 | 34 | 444 | 368 | 46 | 364 | 383 | 50 | 369 |
| 430 | 34 | - | 368 | 46 | - | 383 | 50 | - |
| 430 | 34 | - | 368 | 46 | - | 383 | 50 | - |
 |
 |
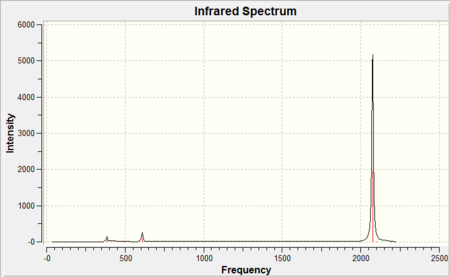 | ||||||
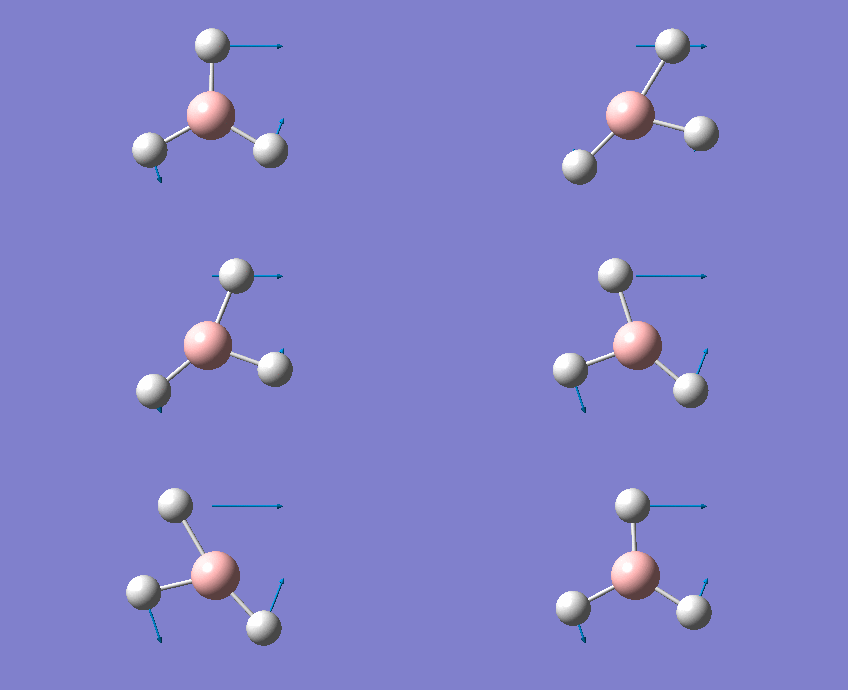
As it can be seen from each IR spectra there were only three peaks observed in the spectrum however as it can be seen from the tables there were three stretching frequencies calculated for both CO and M-CO. This is because from the 3N-6 rule it was expected since there were 13 atoms in each molecule that there would be a total of 33 vibrational modes, and this is exactly the case but the majority of the stretching frequencies calculated were symmetric stretches therefore there was no change in dipole moment and as a result they were not IR active so have an intensity of 0. The reason there were three stretching frequencies calculated for each vibration was due to the asymmetric stretch occuring in each of the x,y and z planes respectively. As it can be seen from the reported stretching CO frequencies they don't completely overlap due to the inherent approximation made in their calculation previously discussed giving the vibrational frequencies an error of ~10%. Be that as it may all the calculated CO stretching frequencies were within this 10% error but more importantly they also show the same trend observed from the calculated bond lengths . Since as you go down the group the CO bond distance increased (found both in the literature and experimentally) this corresponds to a weaker CO bond (longer) therefore it would be expected that the bond would vibrate at a lower wavenumber (to the left on the IR spectrum) and again this is exactly what is observed. It is also noticeable that the literature only quotes a single CO peak this is because the three CO stretching frequencies calculated were degenerate and therefore overlap to give one signal. It should be noted that all literature[11] IR frequencies were recorded using cyclohexane as the solvent.
Furthermore the M-CO vibrational frequencies also fit the expected trend based on the calculated M-CO bond distances. It was expected that since Mo-CO was found to have the largest bond distance this would imply that the M-CO bond would be weaker and hence appear at a lower wavenumber in the IR spectrum and it does compared to both the Cr-CO and W-CO bonds. Finally as expected the W-CO bond was calculated to be slightly longer than the Cr-CO bond and as a result would vibrate at a lower wavenumber 383cm-1 compared to 430cm-1. This would indicate the the 5d orbitals on tungsten were closer in energy (since the geometrical overlap is the same for each molecule as the symmetry and bond angles remained constant) to the π* CO orbital than Mo and allow for better back donation and hence a shorter M-CO bond. The reason for this is the same as before which attributed for the trend in M-CO bond lengths, the "relativistic destabilization"[9] of the 5d metal orbitals increases the back-donation to the CO ligand. The 5d levels(in tungsten) are destabilized as relativity contracts the core orbitals and lowers the effective nuclear charge, therefore the lanthanide contraction (since tungsten has filled 4f orbitals) contracts the size of the atomic radii and as a result forms a shorter M-CO bond but in turn lengthens the CO bond from back-donation. The metal centre donates electron density from filled d orbitals to empty antibonding pπ* orbitals on the CO ligand, this in turn increases the M-CO bond order hence the bond vibrates at higher wavenumber whereas the the CO bond order is decreased and vibrates at a lower wavenumber.
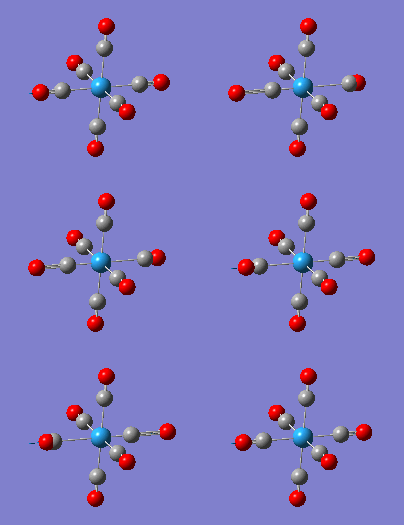
Below is a set of three degenerate CO stretches (M=W)
Molecular Orbital Analysis
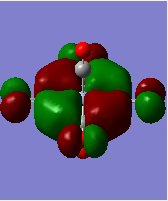
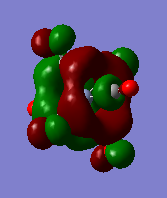
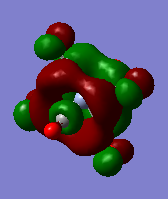
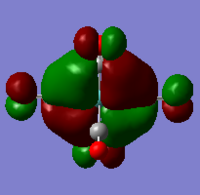
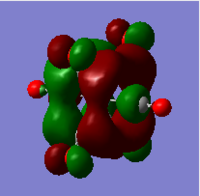
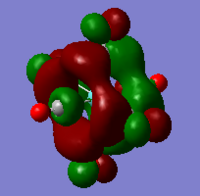
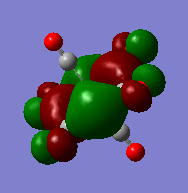
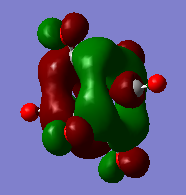
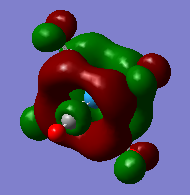
The molecular orbitals (HOMO-1-LUMO+1)were calculated for each of the Cr(CO)6, Mo(CO)6, W(CO)6 complexes, each time an energy calculation was run using the exact same pseudo potentials and basis sets as used in the optimisation and vibrational frequency analysis.
| orbital | HOMO-1 | HOMO | LUMO | LUMO+1 |
|---|---|---|---|---|
| diagram |  |
 |
 |
 |
| Energy/ a.u. | -0.25303 | -0.25303 | -0.16013 | -0.16013 |
| orbital | HOMO-1 | HOMO | LUMO | LUMO+1 |
|---|---|---|---|---|
| diagram |  |
 |
 |
 |
| Energy/ a.u. | -0.22834 | -0.22834 | -0.12419 | -0.12419 |
| orbital | HOMO-1 | HOMO | LUMO | LUMO+1 |
|---|---|---|---|---|
| diagram | 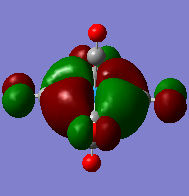 |
 |
 |
 |
| Energy/ a.u. | -0.25359 | -0.25359 | -0.07417 | -0.07417 |
Firstly we can see from the above MO diagrams that as you go down the group the size of the metal d orbitals increases (3d<4d<5d). Therefore a better overlap is observed between the metal d-orbitals and the antibonding pπ* orbitals on the CO ligands, this is best shown in the HOMO-1 and HOMO MO's (also the HOMO-2 although not shown it was degenerate in energy and looked identical to the both its degenerate orbitals only in a different plane) since the occupied metal d orbitals back bond to the antibonding pπ* orbitals shown by the merging of the lobes on the metal with the antibonding orbital on the carbon atom of the carbonyl fragment. As it can be seen from the above diagrams as you descend the group the d orbitals become more diffuse hence the degree of overlap is greater allowing more backbonding. Therefore using this rationale it would expected that the M-CO bond length would decrease down the group which is not the case (as the atom size also determines the bond distance larger atoms-longer bond) however this does account for longer and hence weaker CO bond as the group is descended. However tungsten is the exception because it has filled f orbitals these do not effectively shield the valence electrons very well from the nuclear charge therefore the atomic radii for tungsten is slightly smaller than expected. Or to put it another way the "relativistic destabilization" of the 5d metal orbitals increases the back-donation to the CO ligand. The 5d levels(in tungsten) are destabilized as relativity contracts the core orbitals and lowers the effective nuclear charge. As a result the dπ-pπ* back donation in tungsten is better than in molybdenum since molybdenum does not have filled f orbitals. This theory suggested could be backed up by comparison of the HOMO-1/HOMO energies of the three complexes since these orbitals represent the synergic back boding effect. As it can be seen from the table above the energies of these orbitals are fairly similar in the case of Cr and W whereas in the Mo case the energy of its corresponding orbitals is slightly higher (again this could also be suggesting a weaker M-CO bond). Although in reality it is not possible to really compare the energies of the molecules since they are not isomers.
NBO/Charge Distribution
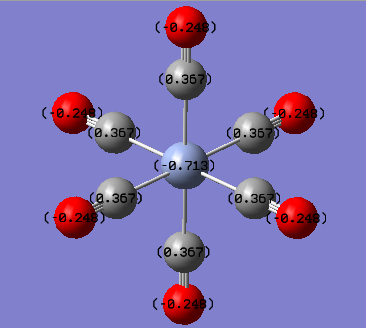
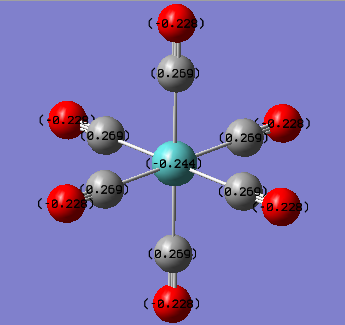
The NBO and charge distribution analysis was obtained from the .log file of the MO analysis for the three complexes studied. The natural charges associated with each atom is best shown pictorially below.
| Cr(CO)6 | MO(CO)6 | W(CO)6 |
|---|---|---|
 |
 |
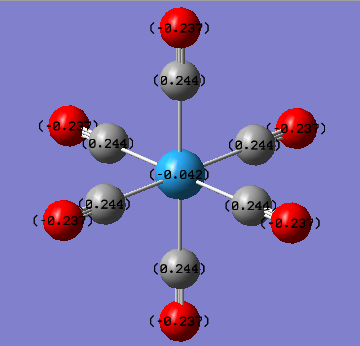 |
From the charge distribution diagrams shown above it is clear to see that the effective negative charge localised on the central metal atom decreases (i.e. becomes less negative) as the group is descended. This would indicate that Cr(CO)6 would have a greater expansion of its d-orbitals therefore greater overlap of the metal (dπ) with CO (π*) i.e. greater back bonding. From this it was expected that the Cr-CO bond would be the shortest bond (which it was both experimentally and from literature, also expected due to being the smallest metal centre so it was expected to have the shortest bond). However as well as having a shorter M-CO bond the greater back bonding would expect to give rise to a longer CO bond which was not the case in both experimental and literature. The reason for this is because it is relative since it is not technically possible to compare the energies, charge distributions etc of the three complexes since they are not isomers and hence have different atoms. On the other hand it could be rationalised that with the greater back bonding to the carbonyl ligands as the group is descended based upon the charge of the central metal atom, for example the positive charge increases which fits the expected result since as central metal gets larger the valence orbitals become more diffuse and polarisable. Also the increased positive charge on the central metal may be explained from the increased back bonding effect as you go down the group, although the calculated charges do not fit the trend that was observed in both the structural analysis as well as the vibrational frequency analysis. This trend was that tungsten has a greater back bonding effect than molybdenum due to the relativistic destabilisation of the 5d orbitals due to poor shielding from the f electrons. Therefore it would have been expected that the negative charge on the W atom would have been more negative than the corresponding value for Mo (although you cant really compare the two as previously mentioned).
Conclusion
This lab module has demonstrated how different compounds can be analysed computationally and allowed an insight into the precision of the approximations used to accurately describe molecules. Firstly it demonstrated how the geometry of molecule can be optimised using various levels of accuracy to obtain a minimum energy geometry. Vibrational frequency analysis was also used firstly to show that the optimised geometries obtained were in fact minimas on the potential energy surface as well as calculate the vibration modes. The molecular orbitals of some molecules were calculated and along with the NBO/charge distribution a qualitative understanding of the bonds was rationalised. The vibrational frequency analysis was carried out upon two optimised structures for two isomers and it was found that the carbonyl stretching frequencies matched fairly well with the literature in terms of trend but due to the large error associated with their calculation (~10%) this shows one of the limitations to computational chemistry. Finally in the mini project all of the methods previously discussed were used to investigate the bond lengths, angles, geometries, stretching frequencies (CO and M-CO), molecular orbitals and NBO/charge distribution of three group 6 hexacarbonyl complexes Cr(CO)6, Mo(CO)6 and W(CO)6. It was discovered that the majority of the bond lengths, angles and stretching frequencies matched very well with the literature sources. Also a similar strange trend was observed that was consistent with the literature was partially explained using the calculated molecular orbital and NBO analysis.
References
- ↑ J.M. Galbraith et al, J. Mol. Strut, 1993, 300, 281-288: DOI:10.1016/0022-2860(93)87024-4
- ↑ J. Glaser, G. Johansson. Acta Chemica Scandinavica A 36 (1982) 125-135[1]
- ↑ D. J. Darensbourg, Inorg. Chem., 1979, 18, 14 - 17 DOI:10.1021/ic50191a003
- ↑ 4.0 4.1 F. A. Cotton, D. J. Darensbourg, S. Klein, B. W. S. Kolthammer Inorg. Chem., 1982, 21 (1), 294–299 DOI:10.1021/ic00131a055
- ↑ 5.0 5.1 G. Hogarth, T. Norman Inorganica Chimica Acta 1997, 254, 1, 167-171 DOI:10.1016/S0020-1693(96)05133-X
- ↑ 6.0 6.1 ELmer C. Alyea and Shuquan Song, Inorg. Chem., 1995 34, 3864-3873 DOI:10.1021/ic00119a006
- ↑ 7.0 7.1 7.2 7.3 Jost, A.; Rees, B Acta Crystallogr, 1975, 831, 2649
- ↑ Jost, A.; Rees, B Acta Crystallogr, 1975, 831, 2649
- ↑ 9.0 9.1 9.2 9.3 T. Ziegler Can. J. Chem., 1995, 73, 743-761
- ↑ A. Whitaker,J.W.Jeffery Acta Cryst., 1967, 23, 977-984 doi:10.1107/S0365110X67004153
- ↑ 11.0 11.1 11.2 11.3 11.4 11.5 11.6 R. J. H. Clark and B. Crociani Inorganica Chimica Acta, 1967, 12-16

