Rep:Mod:ZZY15 TS
Transition States and reactivity
Introduction
A potential energy surface (PES) is a plot of the energy of a system against certain parameters such as the positions of the atoms. In computational chemistry, PES gives the energy as a function of its geometry. Born-Oppenheimer approximation is used to separate electronic and nuclear motion. The nuclei are considered to be stationary relative to electron motion. This helps simplify the Schrödinger equation. Without any other external fields, the potential energy of a molecule doesn’t change as it is translated or rotated in space. Hence the potential energy only depends on the internal coordinates of a molecule. In Cartesian terms, there are 3 internal coordinates for each atom: x, y and z. Thus, there will be 3N total coordinates for the molecule. Eliminate 3 translations and 3 rotations, the PES has 3N-6 degrees of freedom, where N is the number of atoms (N>2).
At T = 0K, the system will always want to be at the lowest possible potential energy. A minimum point on the PES has positive curvatures (i.e. the second derivative: ) in all degrees of freedom. As the reaction proceeds, it goes from one minimum point on the PES, i.e. the reactant, to another minimum point, the product, through the lowest energy path. As the reaction goes along this path, it would pass through one degree of freedom for which the energy is a maximum. This is the saddle point of the PES, i.e. maximum point on the minimum energy pathway. This saddle point is defined as the transition state. It has negative curvature in only one degree of freedom and positive curvatures in all others. At the minima and saddle point, the slope of the PES is zero (i.e. the first derivative: ).
In the lab, we use computer simulation for determining molecular structure by geometry optimization in Gaussian. The energy of the system is determined by solving the Schrödinger equation. The first and second derivatives of the energy with respect to all degrees of freedom are calculated. This allows locating of stationary points. Moreover, the vibrational frequencies of the system can be predicted by the second derivatives, which can be all organized in the Hessian matric. The frequencies are related to the eigenvalues of the Hessian matrix in the harmonic approximation.[1]

The eigenvalues are the squared normal mode frequencies. If all the eigenvalues are positive, the frequencies are all real, indicating a minimum point on the PES. If one eigenvalue is negative, there is one imaginary frequency, indicating a TS.
Nf710 (talk) 16:02, 9 March 2018 (UTC) Really good understanding here. The eiegenvectors of the hessian are the normal modes which are liner combinations of the degrees of freedom. Hence when you move along this vector they look like vibrations
Two different quantum chemical methods are used in this lab: Density functional method B3LYP (DFT) and Semi-empirical method PM6. The semi-empirical methods makes many approximations and obtain some parameters from empirical data, therefore it is much quicker. However, the optimization is less prefect. The DFT method doesn't include any empirical or semi-empirical parameters in their equations. It derives those parameters directly from theoretical principles, no experimental data needed. This method is more accurate, but it is slower as greater computational effort is required. It is also necessary to choose a basis set, which is a set of functions used to represent the electronic wave function within the linear combination of atomic orbitals.[2]
Results and Discussion
(Fv611 (talk) Excellent work across this whole section. Very well done :) )
Exercise 1: Reaction of Butadiene with Ethene

This is a Dials-Alder reaction. The ethene acting as the dienophile, reacts with the s-cis butadiene. Cyclohexene is formed.
Optimization Results
| Ethene | Butadiene | Transition State | Product | ||||||||
|---|---|---|---|---|---|---|---|---|---|---|---|
Bond Length Analysis
| sp3 C- sp3 C | sp2 C- sp2 C (Double bond) | sp2 C- sp2 C (Single bond) | sp2 C- sp3 C | VDW radius of C | |
|---|---|---|---|---|---|
| Typical Bond Length (Å) | 1.54 | 1.33 | 1.47 | 1.50 | 1.70 |
 |
 |
 |
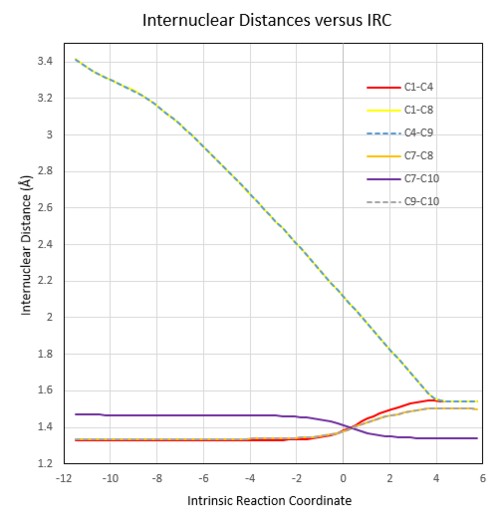
The length of the partially formed C-C sigma bonds (C1-C8, C4-C9) in the TS is shorter than 2 x Van Der Waals radius of carbon, indicating formation of bonds between them. As the reaction proceeds, their length shortens and reaches the typical sp3 C-sp3C single bond length at the end of the reation. The bond length between C7-C10 in the TS is shorter compared to the typical sp2 C-sp2C single bond length. This indicating the formation of C-C pi bond between them. The bond length between C1-C4 at TS is longer than the typical C-C double bond length, indicating the pi bond breaking during the reaction. The bond length between C7-C8, C9-C10 is longer than the typical C-C double bond length, indicating the breaking of pi bond between them. It reaches the typical sp2 C-sp3C bond length at the end.
Frequency and IRC Analysis
| TS Bond Forming/Breaking Vibration | Frequency Calculation |
|---|---|
 |
 |
| Trajectory | IRC Path |
|---|---|
 |
 |
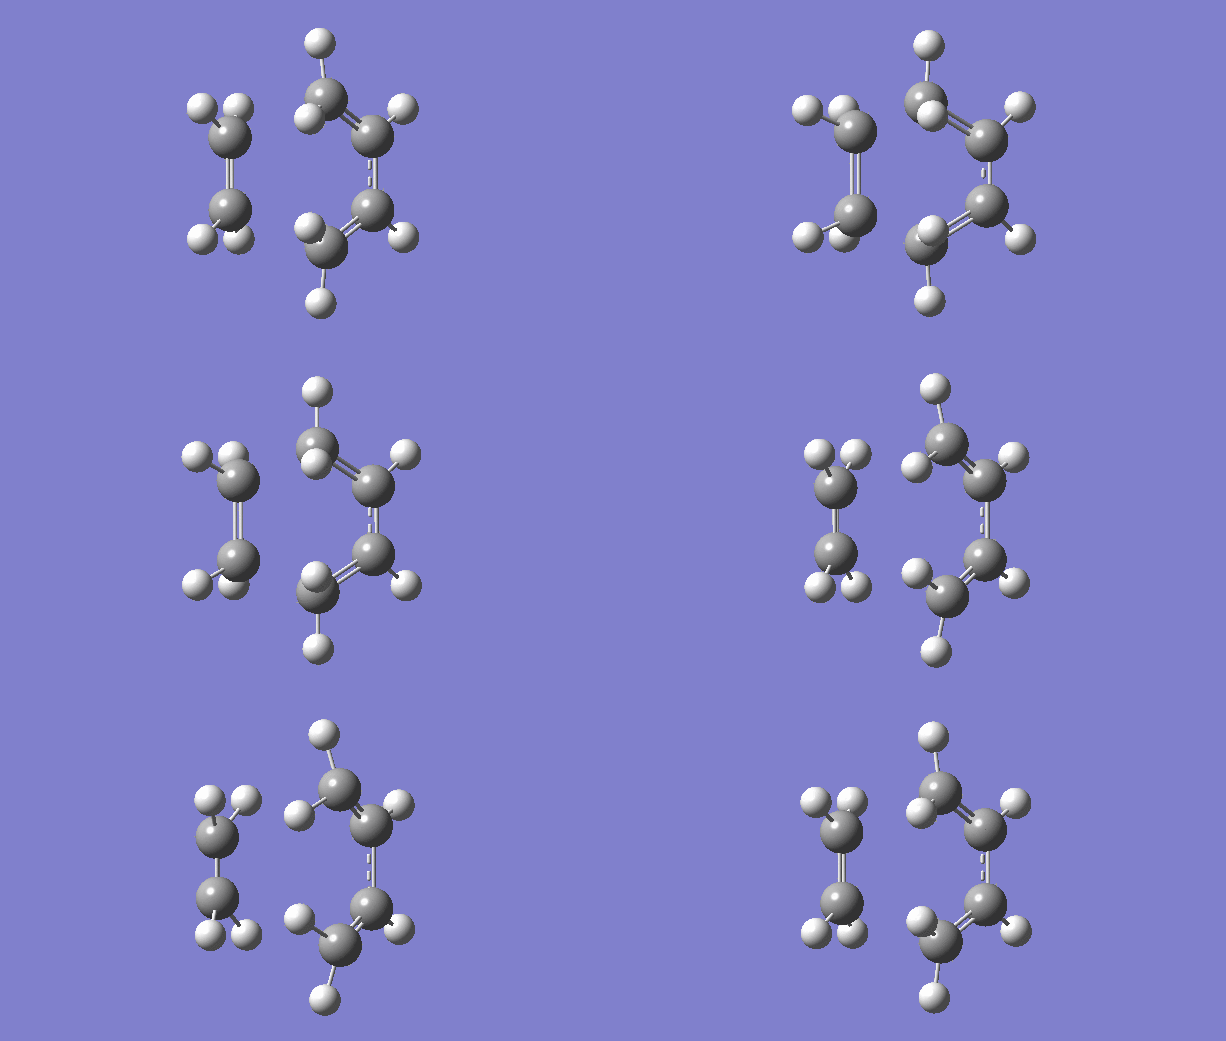
There is only one imaginary vibration (negative vibration) for the TS calculated, confirming that the TS is optimized correctly. Transition state corresponds to the highest potential energy point along the minimum energy path. At TS, the first derivative of energy graph is zero and the second derivative is negative. The frequency represents the second derivative of the energy. Therefore a single negative frequency indicates that the structure is the maximum point in only one degree of freedom but minimum in all others. That is the correct transition state.
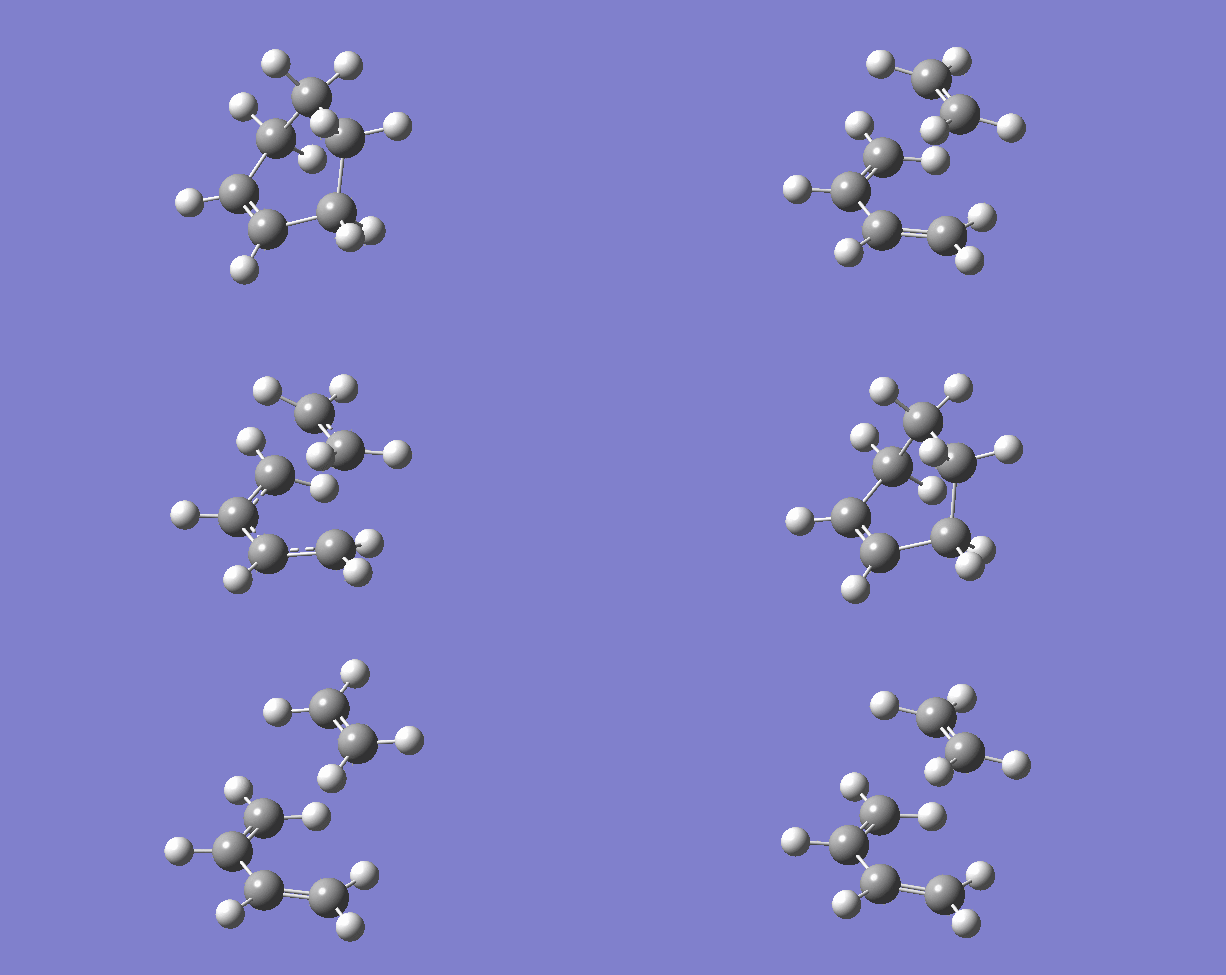
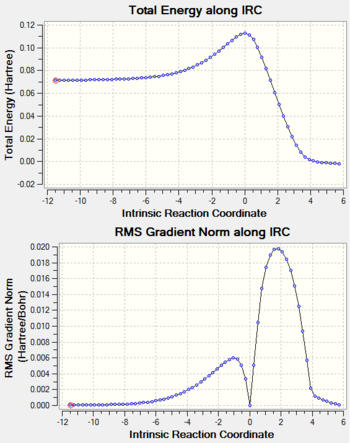
The IRC plots also show the correct optimization of TS. The maximum energy point corresponds to zero RMS gradient,showing the geometry is optimized at that point.
The animation of vibration at -949 cm-1 shows that the formation of bonds in this reaction is synchronous. They form at the same time.
MO Analysis
| HOMO | LUMO | MO Diagram | ||||||||||||||
|---|---|---|---|---|---|---|---|---|---|---|---|---|---|---|---|---|
| Butadiene |
|
|
 | |||||||||||||
| Ethene |
|
| ||||||||||||||
| Transition state |
|
|
|
| ||||||||||||
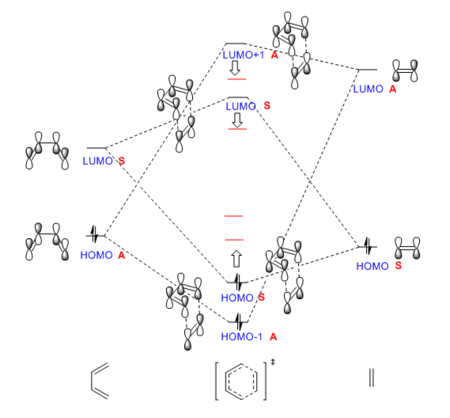
The MO diagram is constructed based on the energies of MOs calculated at PM6 level. The diene has a smaller HOMO-LUMO energy gap as the HOMO and LUMO are neither the lowest energy bonding MO nor the highest energy antiboning MO, which is the case for the ethene. Noticed that the energy of HOMO/HOMO-1 of TS is higher than expected and the energy of the LUMO/LUMO+1 of TS is lower than expected (real energy levels indicated by red lines in the graph). This is because the MO diagram is based on the transition state MO energies, not on product as we used to do. In the TS, the new bonds are not completely formed. Therefore the "bonding orbitals" are higher in energy and the "anti-bonding orbitals" are lower in energy than expected.
Due to the larger energy gap between interacting MOs of ethene and diene, this reaction is not efficient. This can be improved by adding electron donating groups to the diene and adding electron withdrawing groups to the dienophile. By doing this, the energy leveles of diene are raised and that of the dienophile are lowered. This leads to better overlap as MOs closer in energy. The reaction is more efficient.
As shown by the MO visualization, reactants' MOs of the same symmetry overlap and give the TS MOs. This indicates that only interactions between MOs of the same symmetry are allowed. Mis-symmetry interactions are forbidden, i.e. they don't interact.
The overlap between MOs is described by the orbital overlap integral . It is defined as:
and are the wavefunctions of the interacting MOs. It is known that integral of asymmetric functions is zero. The product of an asymmetric and a symmetric function is asymmetric as the product of two functions of the same symmetry is symmetric. In conclusion, the overlap integral of two MOs of different symmetry is zero and the overlap integral of two MOs of the same symmetry is non-zero. This is consistent to the symmetry requirement mentioned before as reaction can't happen with zero overlap.
Exercise 2: Reaction of Cyclohexadiene and 1,3-Dioxole

This a Diels-Alder reaction. The 1,3-Dioxole acts as the dienophile. There are two possible products: endo and exo.
Optimization Results
| Cyclohexadiene | 1,3-dioxole | Endo TS | Exo TS | Endo Product | Exo Product | |||||||||||||
|---|---|---|---|---|---|---|---|---|---|---|---|---|---|---|---|---|---|---|
| PM6 | ||||||||||||||||||
| B3LYP/6-31G(d) | ||||||||||||||||||
| Frequency values at B3LYP/6-31G(d) Level |  |
 |
 |
 |
 |
 |
The structures above are optimized as confirmed by the frequency calculation. None of them has more than one negative frequencies. There is only one negative frequency for both TS structures, indicating they are correctly optimized.
MO Analysis
(Fv611 (talk) Good MO diagrams, but you could have discussed the differences between the endo and exo conformations in terms of their relative energies.)
| ENDO MO | EXO MO |
|---|---|
 |
 |
| Cyclohexadiene HOMO | Cyclohexadiene LUMO | 1,3-Dioxole HOMO | 1,3-Dioxole LUMO | ||||||||
|---|---|---|---|---|---|---|---|---|---|---|---|
| EXO TS HOMO | EXO TS LUMO | EXO TS HOMO-1 | EXO TS LUMO+1 | ||||||||
| ENDO TS HOMO | ENDO TS LUMO | ENDO TS HOMO-1 | ENDO TS LUMO+1 | ||||||||
The MO diagram is constructed based on the energies of MOs calculated at BY3LYP/6-31(d) level.
This is an inverse demand DA reaction. The frontier molecular orbitals of the dienophile are higher in energy than that of the diene, i.e. the diene is electron poor while the dienophile is electron rich. In result of that, the HOMOdienophile and the LUMOdiene are more similar in energy compared to the HOMOdiene and the LUMOdienophile. The strongest orbital interaction is between FMOs that are closest in energy, in this case, that are the HOMOdienophile and the LUMOdiene. In a normal demand DA reaction, the strongest orbital interaction is between the HOMOdiene and the LUMOdienophile and the diene is electron rich as the dienophile is electron poor.
This can be rationalized as the dienophile of this reaction: 1,3-dioxole, is relatively electron rich. The neighbouring oxygen atoms donate electron density into the double bond, raise the energy of the double bond MOs. The reaction proceeds in an inverse demand fashion.
Nf710 (talk) 16:43, 9 March 2018 (UTC) How do you know this? Have you run a single point energy to investigate this quanitiatively?
Reaction Barriers and Reaction Energies
| Cyclohexadiene | 1,3-Dioxole | Endo TS | Exo TS | Endo Product | Exo Product | |
|---|---|---|---|---|---|---|
| Energies Calculated From B3LYP/631G(d) (kJmol-1) | -612584.1026 | -701187.072 | -1313621.484 | -1313613.647 | -1313848.695 | -1313845.101 |
| Reaction Barrier (kJmol-1) | Reaction Energy (kJmol-1) | |
|---|---|---|
| Endo | + 150 | -77.5 |
| Exo | +157 | -73.9 |
The reaction barrier and the reaction energy were calculated by using the energy data from the BY3LYP/6-31G(d) results.
For this reaction, the endo reaction has a more negative reaction energy and a lower activation energy. Therefore the endo product is both the kinetically and thermodynamically favourable products. The endo product is more stable and less energy is required to overcome the reaction barrier of the endo reaction. Noticed both the endo and exo reactions are exothermic, i.e. the products are lower in energy compared to the reactants.
Secondary Orbital Interaction
| Endo TS | Exo TS | ||||||
|---|---|---|---|---|---|---|---|
|
| ||||||
 |
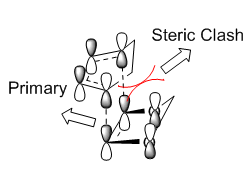 |
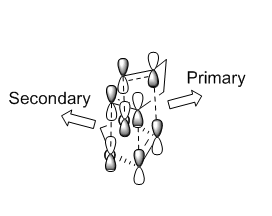
As shown in the graph, only the endo TS has the secondary orbital interactions between diene and dienophile. The lone pair orbitals of oxygen atoms interact with the LUMO of cyclohexadiene. This interaction stabilizes the endo transition state, lowering the reaction barrier. According to the Hammond's Postulate, the transition state of a reaction resembles either the reactants or the products, to whichever it is closer in energy. In this reaction, the energy of both TS are closer in energy to the product, hence the structure of the TS resembles the product. Consequently, the secondary orbital interactions which stabilizes the endo TS, also stabilizes the endo product. This explains the endo selectivity of this reaction.
For the exo TS, there is no secondary orbital interactions and the steric clash between the diene and dienophile destablizes the exo TS and product. This results in disfavouring of the exo reaction.
Nf710 (talk) 16:48, 9 March 2018 (UTC) This was a good section your figures were really nice. There were a few points where you could have gone into more detail. Such as with the kenetic and thermo theory. But otherwise a good section.
Nf710 (talk) 16:51, 9 March 2018 (UTC) You are also slightly out with your energies suggesting your reactant are not optimised fully.
Exercise 3: Diels-Alder vs Cheletropic
Optimization Results
| Endo TS | Exo TS | Cheletropic TS | ||||||
|---|---|---|---|---|---|---|---|---|
| Endo Product | Exo Product | Cheletropic Product | ||||||
IRC Analysis
| Endo | 
|
| Exo | 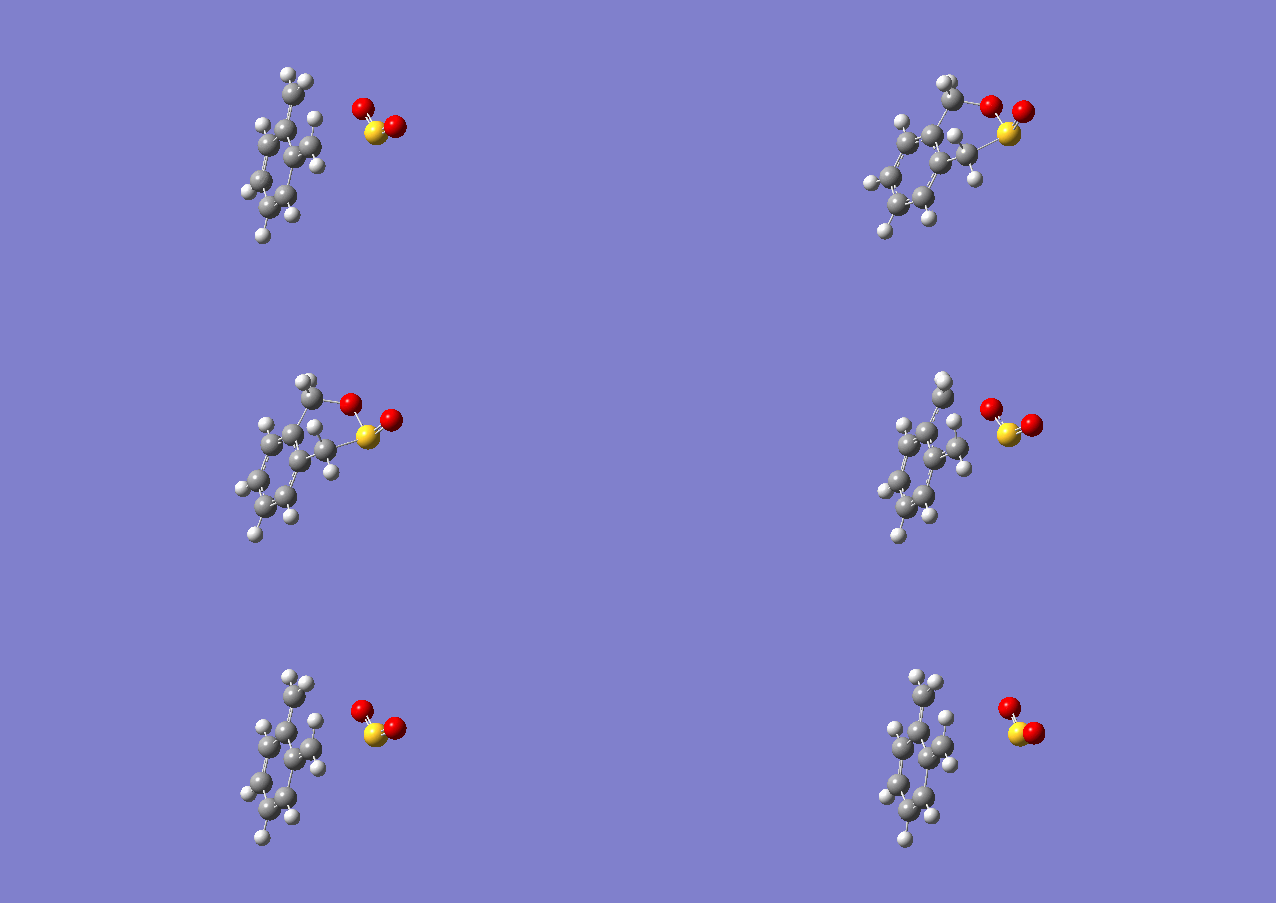
|
| Cheletropic | 
|
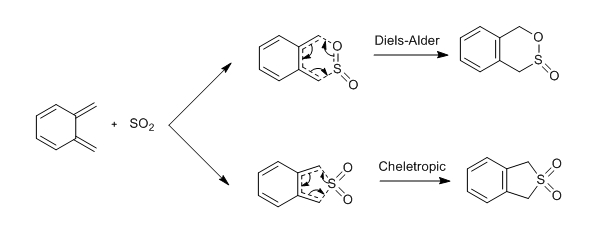
Ortho-xylylene has 8 electrons. According to the Huckle's rule (4n+2), it is not aromatic. However, it is planar as all carbons are sp2 hybridised. When SO2 approaches o-xylylene, the two ortho bonds stick out of the 6-membered ring plane towards the SO2 and form new bonds with it while the bonds in the two ortho double bonds break. This leaves 6 electrons within the ring and the ring establishes aromaticity. Then the molecule adjusts to such that the original 8 carbons of the o-xylylene back to the same plane. The formation of aromatic ring and new sigma bonds are the driving force for the reactions.
Reaction Barriers and Reaction Energies
| Xylylene | SO2 | Endo TS | Exo TS | Cheletropic TS | Endo Product | Exo Product | Cheletropic Product | |
|---|---|---|---|---|---|---|---|---|
| Energy (kJmol-1) | +469.3446755 | -311.42092 | +237.7678009 | +241.7506826 | +260.0871666 | +56.96807393 | +56.32220122 | -0.013127494 |
| Reaction Barrier (kJmol-1) | Reaction Energy (kJmol-1) | |
|---|---|---|
| Endo | + 79.8 | -101.0 |
| Exo | +83.8 | -101.6 |
| Cheletropic | +102.2 | -157.9 |
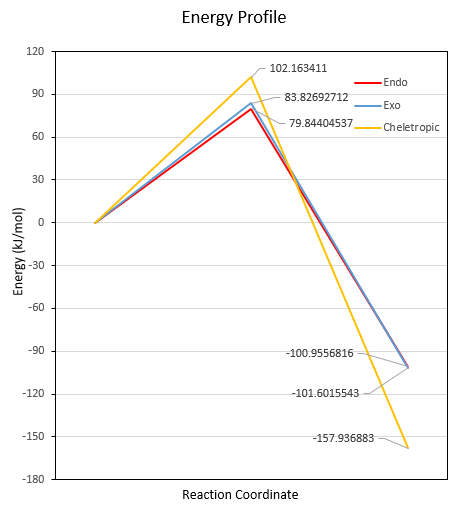
(This level of precision is far too high Tam10 (talk) 12:18, 7 March 2018 (UTC))
The Diels-Alder reactions have lower reaction barrier than the Cheletropic reaction. They are kinetically favoured. The endo reaction has the lowest reaction barrier and it is the most favoured kinetically. The reaction energy of the endo and exo reactions are very close with the exo one slightly lower (probably due to less steric hindrance). Hence thermodynamically, they are favoured similarly. However, the Cheletropic reaction has a much lower reaction energy, i.e. the Cheletropic product is the most stable. The Cheletropic reaction is thermodynamically the most favoured reaction.
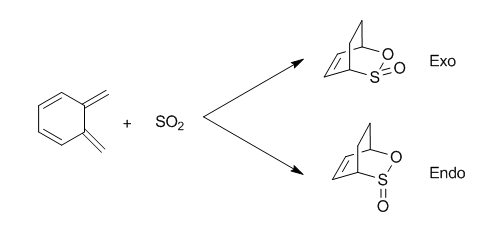
Extension: Second Cis-butadiene Fragment in O-xylylene
Optimization Results
| Endo TS | Endo Product | Exo TS | Exo Product | ||||||||
|---|---|---|---|---|---|---|---|---|---|---|---|
Reaction Barriers and Reaction Energies
| Xylylene | SO2 | Endo TS | Exo TS | Endo Product | Exo Product | |
|---|---|---|---|---|---|---|
| Energy (kJmol-1) | +469.3446755 | -311.42092 | +267.9846671 | +275.8217811 | +172.2537282 | +176.7223272 |
| Reaction Barrier (kJmol-1) | Reaction Energy (kJmol-1) | |
|---|---|---|
| Endo | + 110.1 | +14.3 |
| Exo | +117.9 | +18.8 |
The reaction barrier for both endo and exo reactions is much higher than that of the reactions with the other cis-butadiene fragment in Exercise 3. More energy required to overcome the barrier. In addition, the reaction energy for both endo and exo is positive, i.e. the products are more unstable than the reactants. Thus, this reaction with the cis-butadiene fragment within the ring is thermodynamically and kinetically unfavoured.
Conclusion
In this experiment, the transition structures for three pericyclic reactions were located and characterized using two electronic structure methods: the semi-empirical method PM6 and the Density Functional Theory (DFT) method B3LYP in Gaussian. The structures were visualized in GaussView. An Intrinsic Reaction Coordinate (IRC) calculation on the correctly located TS showed the trajectories of the reactions and the change in physical parameters such as bond lengths and energy during the reaction. The TS MO diagram of these reactions were constructed based on the MO energy calculated from Gaussian. This showed the interacting orbitals and symmetry requirement for the reaction. The demand of the Diel-Alder reactions (normal/inverse) was also determined by analysis of the TS MO. Analysis of energy of optimized products, reactants and transition states demonstrated which products or route of reactions are more kinetically or thermodynamically favoured.
References
- ↑ P. Atkins and J. De Paula, Atkins' Physical Chemistry, University Press, Oxford, 10th edn., 2014.,pp 908-909
- ↑ Joseph J W McDouall, Computational Quantum Chemistry: Molecular Structure and Properties in Silico, Royal Society of Chemistry, Cambridge, 2013.,pp 1-62
- ↑ E. V. Anslyn and D. A. Dougherty, Modern physical organic chemistry, Univ. Science Books, Sausalito, CA, 2008
Appendix
Exercise 1: Reaction of Butadiene with Ethylene
| PM6 | |
|---|---|
| Ethene | File:E1 SM ALKENE OP PM6.LOG |
| Butadiene | File:DIENE OP PM6 J.LOG |
| TS | File:REACTANT TS PM6 J.LOG |
| Cyclohexene | File:E1 PRODUCT OP PM6.LOG |
| IRC | File:E1 TS IRC PM6.LOG |
Exercise 2: Reaction of Cyclohexadiene and 1,3-Dioxole
| PM6 | BY3LYP/6-31(d) | |
|---|---|---|
| Cyclohexadiene | File:ZZY E2 DIENE OP PM6.LOG | File:ZZY E2 DIENE OP 631.log |
| 1,3-dioxole | File:ZZY E2 DIOXOLE OP PM6.LOG | File:ZZY E2 DIOXOLE OP 631.log |
| Endo TS | File:ZZY E2 ENDO TS PM6 J.LOG | File:ZZY E2 ENDO TS 631 J.LOG |
| Exo TS | File:ZZY E2 EXO TS PM6 J.LOG | File:ZZY E2 EXO TS 631 J.LOG |
| Endo Product | File:ZZY E2 ENDO OP PM6.LOG | File:ZZY E2 ENDO OP 631.LOG |
| Exo Product | File:ZZY E2 EXO OP PM6.LOG | File:ZZY E2 EXO OP 631.LOG |
| Endo IRC | File:ZZY E2 ENDO IRC PM6.LOG | |
| Exo IRC | File:ZZY E2 EXO IRC PM6.LOG |
Exercise 3: Diels-Alder vs Cheletropic
| PM6 | |
|---|---|
| Xylylene | File:E3 XYLYLENE ZZY.LOG |
| SO2 | File:E3 SO2 ZZY.LOG |
| Endo TS | File:E3 ENDO TS ZZY 2.LOG |
| Exo TS | File:E3 EXO TS ZZY.LOG |
| Cheletropic TS | File:E3 CHE TS ZZY.LOG |
| Endo Product | File:E3 ENDO Product ZZY.LOG |
| Exo Product | File:E3 EXO Product ZZY.LOG |
| Cheletropic Product | File:E3 CHE Product ZZY.LOG |
| Endo IRC | File:E3 ENDO IRC ZZY.LOG |
| Exo IRC | File:E3 EXO IRC ZZY.LOG |
| Cheletropic IRC | File:E3 CHE IRC ZZY.LOG |
Extension
| PM6 | |
|---|---|
| Endo TS | File:EX ENDO TS ZZY J.LOG |
| Exo TS | File:EX EXO TS ZZY J.LOG |
| Endo Product | File:EX ENDO PRODUCT ZZY J.LOG |
| Exo Product | File:EX EXO PRODUCT ZZY J.LOG |
| Endo IRC | File:EX ENDO IRC ZZY J.LOG |
| Exo IRC | File:EX EXO IRC ZZY J.LOG |
